Bulletin of the Geological Society of Denmark, Vol. 27/01-02, pp. 15-45
Bulletin of the Geological Society of Denmark, Vol. 27/01-02, pp. 15-45
Bulletin of the Geological Society of Denmark, Vol. 27/01-02, pp. 15-45

Create successful ePaper yourself
Turn your PDF publications into a flip-book with our unique Google optimized e-Paper software.
<strong>Bulletin</strong> <strong>of</strong> <strong>the</strong> <strong>Geological</strong> <strong>Society</strong> <strong>of</strong> <strong>Denmark</strong>, vol. <strong>27</strong> 1978 21<br />
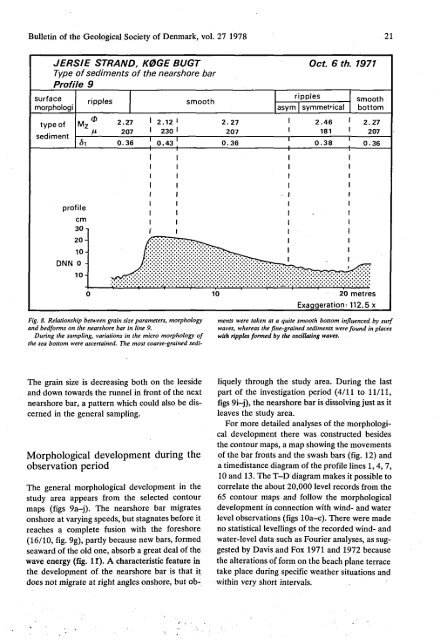
JERSIE STRAND, KØGE BUGT<br />
Type <strong>of</strong> sediments <strong>of</strong> <strong>the</strong> nearshore bar<br />
Pr<strong>of</strong>ile 9<br />
surface<br />
morphologi<br />
type <strong>of</strong><br />
sediment<br />
ri<strong>pp</strong>les<br />
M-<br />
><br />
2.<strong>27</strong> I 2.12 I<br />
207 ' 230 '<br />
smooth<br />
2.<strong>27</strong><br />
207<br />
ri<strong>pp</strong>les<br />
Oct. 6 th. 1971<br />
asym symmetrical<br />
2.46<br />
181<br />
smooth<br />
bottom<br />
I 2.<strong>27</strong><br />
207<br />
20 metres<br />
Exaggeration- 112.5 x<br />
Fig. 8. Relationship between grain size parameters, morphology ments were taken at a quite smooth bottom influenced by surf<br />
and bedforms on <strong>the</strong> nearshore bar in line 9.<br />
waves, whereas <strong>the</strong> fine-grained sediments were found in places<br />
During <strong>the</strong> sampling, variations in <strong>the</strong> micro morphology <strong>of</strong> with ri<strong>pp</strong>les formed by <strong>the</strong> oscillating waves.<br />
<strong>the</strong> sea bottom were ascertained. The most coarse-grained sedi<br />
The grain size is decreasing both on <strong>the</strong> leeside<br />
and down towards <strong>the</strong> runnel in front <strong>of</strong> <strong>the</strong> next<br />
nearshore bar, a pattern which could also be discerned<br />
in <strong>the</strong> general sampling.<br />
Morphological development during <strong>the</strong><br />
observation period<br />
The general morphological development in <strong>the</strong><br />
study area a<strong>pp</strong>ears from <strong>the</strong> selected contour<br />
maps (figs 9a-j). The nearshore bar migrates<br />
onshore at varying speeds, but stagnates before it<br />
reaches a complete fusion with <strong>the</strong> foreshore<br />
(16/10, fig. 9g), partly because new bars, formed<br />
seaward <strong>of</strong> <strong>the</strong> old one, absorb a great deal <strong>of</strong> <strong>the</strong><br />
wave energy (fig. 11). A characteristic feature in<br />
<strong>the</strong> development <strong>of</strong> <strong>the</strong> nearshore bar is that it<br />
does not migrate at right angles onshore, but obliquely<br />
through <strong>the</strong> study area. During <strong>the</strong> last<br />
part <strong>of</strong> <strong>the</strong> investigation period (4/11 to 11/11,<br />
figs 9i-j), <strong>the</strong> nearshore bar is dissolving just as it<br />
leaves <strong>the</strong> study area.<br />
For more detailed analyses <strong>of</strong> <strong>the</strong> morphological<br />
development <strong>the</strong>re was constructed besides<br />
<strong>the</strong> contour maps, a map showing <strong>the</strong> movements<br />
<strong>of</strong> <strong>the</strong> bar fronts and <strong>the</strong> swash bars (fig. 12) and<br />
a timedistance diagram <strong>of</strong> <strong>the</strong> pr<strong>of</strong>ile lines 1,4, 7,<br />
10 and 13. The T-D diagram makes it possible to<br />
correlate <strong>the</strong> about 20,000 level records from <strong>the</strong><br />
65 contour maps and follow <strong>the</strong> morphological<br />
development in connection with wind- and water<br />
level observations (figs lOa-c). There were made<br />
no statistical levellings <strong>of</strong> <strong>the</strong> recorded wind- and<br />
water-level data such as Fourier analyses, as suggested<br />
by Davis and Fox 1971 and 1972 because<br />
<strong>the</strong> alterations <strong>of</strong> form on <strong>the</strong> beach plane terrace<br />
take place during specific wea<strong>the</strong>r situations and<br />
within very short intervals.