GRECO Annual Report 2011
GRECO Annual Report 2011
GRECO Annual Report 2011

You also want an ePaper? Increase the reach of your titles
YUMPU automatically turns print PDFs into web optimized ePapers that Google loves.
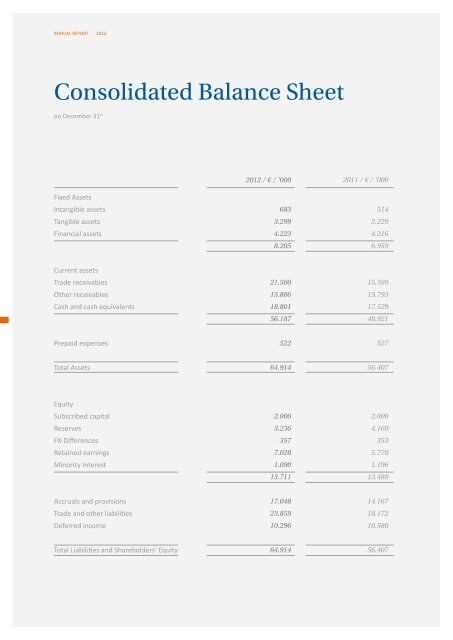
ANNUAL REPORT 2012<br />
Consolidated Balance Sheet<br />
on December 31 st<br />
Key Performance Indicators<br />
on December 31 st<br />
2012 / € / ‘000<br />
<strong>2011</strong> / € / ‘000<br />
Fixed Assets<br />
Intangible assets<br />
Tangible assets<br />
Financial assets<br />
683<br />
3.299<br />
4.223<br />
8.205<br />
514<br />
2.229<br />
4.216<br />
6.959<br />
return on equity<br />
(before tax) in percent<br />
67,3<br />
76,3<br />
12<br />
11<br />
return on assets<br />
(before tax) in percent<br />
14,2<br />
12<br />
equity ratio<br />
in percent<br />
21,1<br />
18,3 23,9<br />
12<br />
11 11<br />
Current assets<br />
Trade receivables<br />
Other receivables<br />
Cash and cash equivalents<br />
Prepaid expenses<br />
21.500<br />
15.886<br />
18.801<br />
56.187<br />
522<br />
15.599<br />
15.793<br />
17.529<br />
48.921<br />
527<br />
66,1<br />
10<br />
13,6 20,5<br />
Return on equity (Profit before taxation / Equity) as well as Return on assets have<br />
been stable during the past years. These figures reflect the high profitability of the<br />
group which was mainly based on organic growth but also strengthened by successful<br />
acquisitions like VMG.<br />
10 10<br />
Equity in 2012 remained at the same<br />
level and the rise in balance sheet total<br />
produced a decline in equity ratio.<br />
Total Assets<br />
64.914<br />
56.407<br />
Equity<br />
Subscribed capital<br />
Reserves<br />
FX-Differences<br />
Retained earnings<br />
Minority Interest<br />
Accruals and provisions<br />
Trade and other liabilities<br />
Deferred income<br />
2.000<br />
3.236<br />
357<br />
7.028<br />
1.090<br />
13.711<br />
17.048<br />
23.859<br />
10.296<br />
2.000<br />
4.169<br />
353<br />
5.770<br />
1.196<br />
13.488<br />
14.167<br />
18.172<br />
10.580<br />
total revenue per<br />
employee<br />
€ ‘000<br />
95,2<br />
95,9<br />
96,1<br />
12<br />
11<br />
10<br />
Revenue per employee remained static.<br />
Especially in PL the rising number of<br />
employees will help to generate higher<br />
revenue in future years.<br />
trading margin *<br />
in percent<br />
15,1<br />
17,7<br />
13,9<br />
Trading margin shows the high effectivness<br />
of the group based on a high level of<br />
organisation and experience.<br />
* Trading Margin represents profit before<br />
taxation divided by net revenue<br />
12<br />
11<br />
10<br />
Total Liabilities and Shareholders‘ Equity<br />
64.914<br />
56.407