Sustainability in the Dutch Power Sector - Greenpeace Nederland
Sustainability in the Dutch Power Sector - Greenpeace Nederland
Sustainability in the Dutch Power Sector - Greenpeace Nederland

Create successful ePaper yourself
Turn your PDF publications into a flip-book with our unique Google optimized e-Paper software.
<strong>Susta<strong>in</strong>ability</strong> <strong>in</strong> <strong>the</strong> <strong>Dutch</strong> <strong>Power</strong> <strong>Sector</strong><br />
Fact Sheet Series – Update 2009<br />
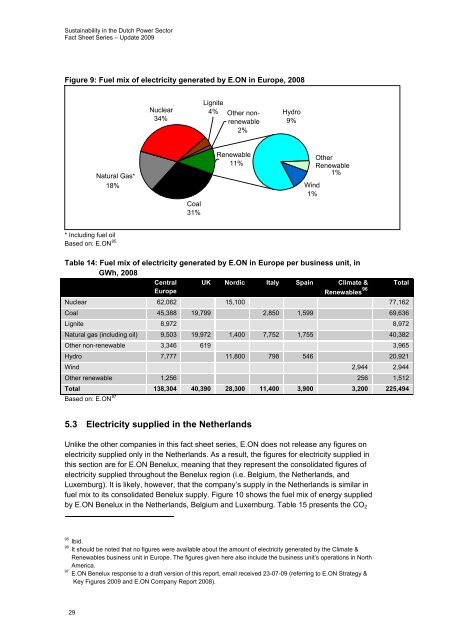
Figure 9: Fuel mix of electricity generated by E.ON <strong>in</strong> Europe, 2008<br />
Lignite<br />
Nuclear 4% O<strong>the</strong>r non- Hydro<br />
34%<br />
renewable 9%<br />
2%<br />
Natural Gas*<br />
18%<br />
Coal<br />
31%<br />
Renewable<br />
11%<br />
O<strong>the</strong>r<br />
Renewable<br />
1%<br />
W<strong>in</strong>d<br />
1%<br />
* Includ<strong>in</strong>g fuel oil<br />
Based on: E.ON 95<br />
Table 14: Fuel mix of electricity generated by E.ON <strong>in</strong> Europe per bus<strong>in</strong>ess unit, <strong>in</strong><br />
GWh, 2008<br />
Central<br />
Europe<br />
UK Nordic Italy Spa<strong>in</strong> Climate &<br />
Renewables 96<br />
Nuclear 62,062 15,100 77,162<br />
Coal 45,388 19,799 2,850 1,599 69,636<br />
Lignite 8,972 8,972<br />
Natural gas (<strong>in</strong>clud<strong>in</strong>g oil) 9,503 19,972 1,400 7,752 1,755 40,382<br />
O<strong>the</strong>r non-renewable 3,346 619 3,965<br />
Hydro 7,777 11,800 798 546 20,921<br />
W<strong>in</strong>d 2,944 2,944<br />
O<strong>the</strong>r renewable 1,256 256 1,512<br />
Total 138,304 40,390 28,300 11,400 3,900 3,200 225,494<br />
Based on: E.ON 97<br />
Total<br />
5.3 Electricity supplied <strong>in</strong> <strong>the</strong> Ne<strong>the</strong>rlands<br />
Unlike <strong>the</strong> o<strong>the</strong>r companies <strong>in</strong> this fact sheet series, E.ON does not release any figures on<br />
electricity supplied only <strong>in</strong> <strong>the</strong> Ne<strong>the</strong>rlands. As a result, <strong>the</strong> figures for electricity supplied <strong>in</strong><br />
this section are for E.ON Benelux, mean<strong>in</strong>g that <strong>the</strong>y represent <strong>the</strong> consolidated figures of<br />
electricity supplied throughout <strong>the</strong> Benelux region (i.e. Belgium, <strong>the</strong> Ne<strong>the</strong>rlands, and<br />
Luxemburg). It is likely, however, that <strong>the</strong> company’s supply <strong>in</strong> <strong>the</strong> Ne<strong>the</strong>rlands is similar <strong>in</strong><br />
fuel mix to its consolidated Benelux supply. Figure 10 shows <strong>the</strong> fuel mix of energy supplied<br />
by E.ON Benelux <strong>in</strong> <strong>the</strong> Ne<strong>the</strong>rlands, Belgium and Luxemburg. Table 15 presents <strong>the</strong> CO 2<br />
95<br />
Ibid.<br />
96<br />
It should be noted that no figures were available about <strong>the</strong> amount of electricity generated by <strong>the</strong> Climate &<br />
Renewables bus<strong>in</strong>ess unit <strong>in</strong> Europe. The figures given here also <strong>in</strong>clude <strong>the</strong> bus<strong>in</strong>ess unit’s operations <strong>in</strong> North<br />
America.<br />
97<br />
E.ON Benelux response to a draft version of this report, email received 23-07-09 (referr<strong>in</strong>g to E.ON Strategy &<br />
Key Figures 2009 and E.ON Company Report 2008).<br />
29