Sustainability in the Dutch Power Sector - Greenpeace Nederland
Sustainability in the Dutch Power Sector - Greenpeace Nederland
Sustainability in the Dutch Power Sector - Greenpeace Nederland

Create successful ePaper yourself
Turn your PDF publications into a flip-book with our unique Google optimized e-Paper software.
<strong>Susta<strong>in</strong>ability</strong> <strong>in</strong> <strong>the</strong> <strong>Dutch</strong> <strong>Power</strong> <strong>Sector</strong><br />
Fact Sheet Series – Update 2009<br />
Nuclear n/a 0 0 77,162 n/a n/a 46,200<br />
O<strong>the</strong>r n/a 2,039 0 3,965 n/a n/a 0<br />
Total n/a 18,536 9,500 225,494 n/a n/a 179,100<br />
* Incomplete <strong>in</strong>formation; SOMO compilation based on company data<br />
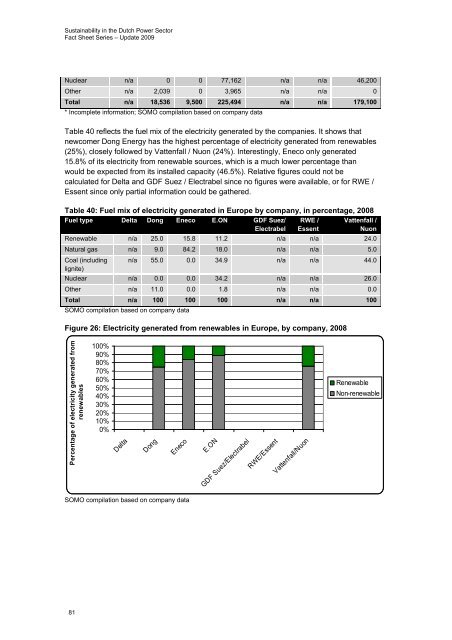
Table 40 reflects <strong>the</strong> fuel mix of <strong>the</strong> electricity generated by <strong>the</strong> companies. It shows that<br />
newcomer Dong Energy has <strong>the</strong> highest percentage of electricity generated from renewables<br />
(25%), closely followed by Vattenfall / Nuon (24%). Interest<strong>in</strong>gly, Eneco only generated<br />
15.8% of its electricity from renewable sources, which is a much lower percentage than<br />
would be expected from its <strong>in</strong>stalled capacity (46.5%). Relative figures could not be<br />
calculated for Delta and GDF Suez / Electrabel s<strong>in</strong>ce no figures were available, or for RWE /<br />
Essent s<strong>in</strong>ce only partial <strong>in</strong>formation could be ga<strong>the</strong>red.<br />
Table 40: Fuel mix of electricity generated <strong>in</strong> Europe by company, <strong>in</strong> percentage, 2008<br />
Fuel type Delta Dong Eneco E.ON GDF Suez/<br />
Electrabel<br />
RWE /<br />
Essent<br />
Vattenfall /<br />
Nuon<br />
Renewable n/a 25.0 15.8 11.2 n/a n/a 24.0<br />
Natural gas n/a 9.0 84.2 18.0 n/a n/a 5.0<br />
Coal (<strong>in</strong>clud<strong>in</strong>g n/a 55.0 0.0 34.9 n/a n/a 44.0<br />
lignite)<br />
Nuclear n/a 0.0 0.0 34.2 n/a n/a 26.0<br />
O<strong>the</strong>r n/a 11.0 0.0 1.8 n/a n/a 0.0<br />
Total n/a 100 100 100 n/a n/a 100<br />
SOMO compilation based on company data<br />
Figure 26: Electricity generated from renewables <strong>in</strong> Europe, by company, 2008<br />
Percentage of electricity generated from<br />
renewables<br />
100%<br />
90%<br />
80%<br />
70%<br />
60%<br />
50%<br />
40%<br />
30%<br />
20%<br />
10%<br />
0%<br />
Delta<br />
Dong<br />
Eneco<br />
E.ON<br />
GDF Suez/Electrabel<br />
RWE/Essent<br />
Vattenfall/Nuon<br />
Renewable<br />
Non-renewable<br />
SOMO compilation based on company data<br />
81