The Full Accounts - Grosvenor
The Full Accounts - Grosvenor
The Full Accounts - Grosvenor

You also want an ePaper? Increase the reach of your titles
YUMPU automatically turns print PDFs into web optimized ePapers that Google loves.
CORPORATE GOVERNANCE<br />
THE COMBINED CODE<br />
<strong>Grosvenor</strong>’s business approach is based on openness and high levels of accountability, elements which are essential not only for the conduct of our<br />
own business but particularly for the operation of our third party arrangements, whether in fund management, joint ventures or other partnerships.<br />
As a consequence, <strong>Grosvenor</strong>’s approach to corporate governance follows best practice recommended by the Financial Reporting Council under the<br />
heading of the “Combined Code”, even though that code applies only to publicly quoted companies. After consultation with the Group’s auditors, the<br />
Board has reviewed all the provisions of the Combined Code issued by the UK Financial Reporting Council in July 2003 and has determined which<br />
of those provisions are appropriate in the context of <strong>Grosvenor</strong>’s ownership structure.<br />
BOARD OF DIRECTORS<br />
<strong>The</strong> Board comprises six full time Executive Directors and seven Non-Executive Directors, amongst whom four are also Trustees of the <strong>Grosvenor</strong><br />
Trusts (see page 62). <strong>The</strong> composition of the Board is designed to ensure effective management and control of the Group, provide complete and<br />
timely information to the shareholders as well as proper representation of the shareholders’ interests.<br />
<strong>The</strong> Board is responsible for setting and monitoring Group strategy, reviewing performance, ensuring adequate funding, formulating policy on key<br />
issues and reporting to shareholders.<br />
<strong>The</strong> roles of Chairman and Chief Executive are clearly defined.<strong>The</strong> Chairman is primarily responsible for overseeing the working of the Board.<strong>The</strong><br />
Chief Executive is responsible for the implementation of the strategy and policies set by the Board and the day-to-day management of the business.<br />
<strong>The</strong> Board and its committees held ten meetings during the year, with majority attendance at all meetings.<strong>The</strong> Group’s Operating Companies have<br />
their own boards, each with Non-Executive Directors who are independent from the management team; each Operating Company is required to<br />
hold at least four board meetings each year.<br />
<strong>The</strong> biographies of the members of the Board on pages 16 and 17 demonstrate a range of experience and professional background to bring<br />
independent judgement on issues of strategy, performance, resources (including key appointments) and standards of conduct. A Statement of the<br />
Directors’ Responsibilities in respect of the accounts is set out on page 64.<br />
To enable the Board to discharge its duties, all Directors receive appropriate and timely information, including briefing papers distributed in advance<br />
of board meetings.<strong>The</strong> Directors have access to the Company Secretary and may, at the Company’s expense, take independent professional advice<br />
and receive additional training as they see fit. All new Directors receive an induction training programme.<br />
<strong>The</strong> Board undertakes a regular evaluation of its own performance.<br />
<strong>The</strong> Board encourages the appointment of Executive Directors to appropriate external posts as this increases the breadth of knowledge and experience<br />
of Directors. Earnings from all such appointments are returned to the Group.Trustees of the <strong>Grosvenor</strong> Trusts receive no fees from the Company.<br />
AUDIT COMMITTEE<br />
<strong>The</strong> Board has a well established Audit Committee, which provides independent scrutiny of the Group’s affairs.<strong>The</strong> Audit Committee is chaired by<br />
Lord George and includes two other Non-Executive Directors.<strong>The</strong> members bring both a wide range of relevant international experience and an<br />
appreciation of the long term interests of the shareholders.<br />
<strong>The</strong> Audit Committee meets at least twice a year with the auditors and is attended by invitation by the Group Chief Executive, Group Finance<br />
Director and other senior personnel as appropriate. It is responsible for reviewing a wide range of financial matters including the annual financial<br />
statements and accompanying reports, Group audit arrangements, accounting policies, internal control and the actions and procedures involved in the<br />
management of risk throughout the Group.<br />
<strong>The</strong> Audit Committee reviews annually the independence of the auditors. Auditor objectivity is ensured through a variety of procedures including<br />
rotation of audit partners. Any non-audit fees received by the auditors in excess of fifty per cent of the audit fee are pre-approved by the Audit Committee.<br />
<strong>The</strong> regional Operating Companies each have their own audit committees which also meet at least twice a year; the decisions of these audit<br />
committees are reported to the Group Audit Committee.<br />
NOMINATIONS COMMITTEE<br />
<strong>The</strong> Nominations Committee comprises all of the Non-Executive Directors.<strong>The</strong> Committee meets at least once a year and is attended, by invitation,<br />
by the Group Chief Executive and other senior personnel as appropriate. It is responsible for reviewing the structure of the Board, giving consideration<br />
to succession planning and for making recommendations to the Board with regard to any changes. It is also responsible for identifying and nominating,<br />
for the approval of the Board, candidates to fill Board vacancies as and when they arise.<br />
RELATIONS WITH SHAREHOLDERS AND LENDERS<br />
Given the private ownership of the Group, the requirements of the Combined Code to communicate with institutional shareholders are not relevant.<br />
All the principal shareholders are represented on the Board and all shareholders receive a monthly report.<strong>The</strong> Annual Report and <strong>Accounts</strong> is widely<br />
distributed and the Group’s policy is to maintain close contact during each financial year with bondholders and other lenders at Group and Operating<br />
Company levels.<br />
55<br />
<strong>Accounts</strong>
CORPORATE GOVERNANCE<br />
INTERNAL CONTROL<br />
<strong>The</strong> Board is responsible for the Group’s system of internal control and for reviewing its effectiveness.This is designed to manage rather than eliminate the risk<br />
of not achieving business objectives and can provide only reasonable and not absolute assurance against material misstatement or loss.<br />
<strong>The</strong> Board considers that there is a continuous process for identifying, evaluating and managing significant risks faced by the Group in the course of its<br />
business, which has been in place throughout the year and up to the date of approval of the Annual Report and <strong>Accounts</strong>.This process is regularly reviewed by<br />
the Audit Committee and the Board and is consistent with the internal control guidance for Directors in the Combined Code.<br />
A key part of the system of internal control is the delegation of management responsibility for all the Group’s property investment, development and fund<br />
management activities together with supporting financial functions to regional management teams. <strong>The</strong> Britain & Ireland, Americas and Continental Europe<br />
regions have local boards, with Non-Executive Chairmen and at least two other Non-Executive Directors, which oversee the regions’ operations.<strong>The</strong>se boards<br />
form an integral part of the overall internal control process. Local boards for the Australia Asia Pacific region and <strong>Grosvenor</strong> Fund Management work closely<br />
with the Holding Company team to ensure appropriate internal controls are maintained. <strong>The</strong> relationship between regional boards and the Group Board is<br />
clearly defined and is set out in formally approved financial delegation procedures.<br />
In addition to local boards, each region and <strong>Grosvenor</strong> Fund Management, together with the Holding Company, is represented on the Group Finance Board,<br />
which meets at least two times each year and provides a forum for debating issues of a financial nature which are relevant to the Group as a whole, including<br />
the setting of Group policy, development of systems and risk management.<br />
In view of the relatively small number of staff and the interaction of local boards, including the Group Finance Board, the <strong>Grosvenor</strong> Group Board has been<br />
satisfied that an internal audit function has not been required.<strong>The</strong> need for this additional control is reviewed by the Board on a regular basis and a framework<br />
for internal audit, risk management and better practice reviews has been adopted by the audit committee.<br />
<strong>The</strong> Board carried out its annual assessment of internal control for the year 2006 at its meeting in March 2007 by considering reports from management<br />
and the Audit Committee and taking account of events since 31 December 2006.<br />
Risk management is a regular agenda item for all parts of the business with the emphasis on continuous improvement. Specific financial and other controls<br />
can be summarised under the following headings:<br />
OPERATING AND HOLDING COMPANY CONTROLS<br />
Key controls over major business risks include reviews against performance indicators and exception reporting. Each team makes regular assessments of its<br />
exposure to major financial, operational and strategy risks and the extent to which these are controlled.<br />
FINANCIAL INFORMATION<br />
<strong>The</strong> Group and each Operating Company have comprehensive systems for reporting financial results. Financial results are reviewed on a quarterly basis<br />
(consistent with the pattern of income receipts in the majority of the Group’s operations) with comparisons against budget and prior periods together with a<br />
forecast for the full financial year and the potential variances to that forecast. Each year a detailed operational budget and a five year financial plan is prepared.<br />
Treasury reporting is reviewed on a monthly basis, with further reporting each quarter.<br />
TREASURY POLICIES<br />
Treasury policies, approved by the Board, are:<br />
• except for Holding Company operations, to raise all debt at Operating Company level and operate a decentralised treasury management structure.<br />
In November 2006 the Board approved a co-ordinated Group approach to treasury;<br />
• to ensure sufficient committed loan facilities to support anticipated business requirements as they arise;<br />
• to ensure that the Group’s debt can be supported from maintainable cashflow through clear internal guidelines;<br />
• to manage interest rate exposure with a combination of fixed rate debt and interest rate swaps so that a minimum of 60% of borrowings are at fixed<br />
interest rates for the next three years;<br />
• not to hedge long term net asset positions held in foreign currencies; and<br />
• to invest short term cash with approved institutions within limits agreed by the Board.<br />
Transactions in financial instruments are either governed by specific delegations to Operating Company boards or have prior Board approval.<strong>The</strong> Group does<br />
not enter into any treasury positions for purely speculative purposes.<br />
FINANCIAL SERVICES AUTHORITY (FSA)<br />
<strong>Grosvenor</strong> Investment Management Limited, a wholly owned subsidiary, is authorised and regulated by the FSA for the purposes of undertaking regulated property<br />
advisory investment activities. All transactions with managed funds are separately accounted for under a full client accounting regime.<br />
<strong>Grosvenor</strong> Australia Nominees Pty Limited, a wholly owned subsidiary, provides financial services and products to wholesale clients as authorised under its<br />
Australian Financial Services Licence No. 302153 issued by the Australian Securities and Investments Commission.<br />
<strong>Grosvenor</strong> Investment Management US Inc, a wholly owned subsidiary, is a registered investment adviser pursuant to the Investment Advisers Act of 1940,<br />
for the purposes of providing real estate related investment advice.<br />
56
REMUNERATION REPORT<br />
REPORT ON EMPLOYMENT AND REMUNERATION MATTERS SPECIFICALLY RELATING TO<br />
EXECUTIVE DIRECTORS AND SENIOR STAFF<br />
Consistent with the delegation of management responsibility to regional management teams, each Operating Company has its own remuneration committee<br />
with appropriate responsibility for remuneration matters within its Operating Company.<br />
THE GROUP’S EMPLOYMENT POLICIES recognise the value of staff to its long term success.<strong>The</strong> promotion of loyalty is important for <strong>Grosvenor</strong> and<br />
good relationships between employer and employee are nurtured. <strong>Grosvenor</strong> is an equal opportunities employer and staff are kept informed on matters<br />
affecting them and on the financial and economic factors affecting the Group’s performance. We are committed to improving performance through regular<br />
review and continuous learning. Programmes are in place to train and develop suitable individuals for future senior or Directors’ roles.<br />
THE REMUNERATION COMMITTEE comprises three Non-Executive Directors. It meets at least twice a year. <strong>The</strong> Group Chief Executive and Group<br />
Human Resources Director are in attendance unless their own remuneration is being discussed. <strong>The</strong> committee is responsible for overseeing remuneration and<br />
employment policies across the whole Group and also for administering directly the remuneration and contracts of Directors and staff in the Holding Company,<br />
Australia Asia Pacific and <strong>Grosvenor</strong> Fund Management. <strong>The</strong>y consult with independent professional advisers as necessary.<br />
THE GROUP’S REMUNERATION POLICIES recognise the importance of attracting, retaining and motivating executives of the appropriate calibre and<br />
experience to enhance the performance and reputation of the Group.<strong>The</strong> size, complexity and international perspective, as well as the long term nature of the<br />
business, are all important factors.<strong>The</strong> policy is to provide competitive potential levels of compensation, benefits and incentive opportunities within appropriate<br />
local markets. Compensation includes variable elements to reward superior Company, team and individual performance, in line with market practice.<br />
THE REMUNERATION of Executive Directors and senior staff includes a blend of short and long term rewards and has been designed to address the<br />
interests of both employees and shareholders. <strong>The</strong> elements are:<br />
• BASIC SALARY AND BENEFITS are competitive within the property industry in the locations in which the Group operates. Salaries are reviewed<br />
annually, or on promotion.Taxable benefits are provided at levels similar to those for comparable positions and include, as appropriate, health insurance<br />
and car allowance.<br />
• BONUS AND INCENTIVE SCHEMES operate for Executive Directors and senior staff and are designed to link rewards to both individual and<br />
Company performance. Awards relating to Company performance are determined by the achievement of total return compared with the relevant<br />
weighted average cost of capital and, in the case of <strong>Grosvenor</strong> Fund Management, performance against other business improvement targets. <strong>The</strong> incentive<br />
arrangements are designed to reward outstanding performance and are linked to the achievement of performance targets at both team and individual<br />
levels. A proportion of incentive awards each year are long term and vest over periods of up to five years.<strong>The</strong> Remuneration Committee has discretion<br />
to award individual bonuses in recognition of special performance.<br />
• PENSIONS AND LIFE ASSURANCE for Executive Directors and senior staff in the UK are provided through membership of the <strong>Grosvenor</strong> Pension<br />
Plan (GPP) and, if applicable, supplementary pension arrangements. GPP is non-contributory and provides, for those who were members before 2004,<br />
a maximum pension of up to two-thirds of pensionable salary on retirement.<strong>The</strong> cost of the Group’s contribution to GPP in respect of each Director is<br />
based on the senior executive member current average contribution rate of 29.1% of pensionable salary per year. <strong>The</strong> GPP also provides for dependants’<br />
pensions of two-thirds of the member’s pension and an insured lump sum payment of four times basic salary in the event of death in service. For all staff<br />
who joined the Group after 1 January 2004 GPP provides a defined benefit pension up to an upper earnings limit, and above this limit the Group will<br />
contribute between 25% and 30% of salary into employees’ accounts with the <strong>Grosvenor</strong> Estate Money Purchase Scheme.<br />
Outside the UK pensions are provided from a number of schemes, including separate defined benefit schemes in Australia, Canada and the USA. Further<br />
details of the Group’s pension schemes are given in note 10 of the <strong>Accounts</strong>.<br />
57
REMUNERATION REPORT<br />
A SCHEDULE OF DIRECTORS’ REMUNERATION, including all amounts required to be disclosed by the Directors’ Remuneration Report Regulations<br />
2002, is approved by the shareholders and details of Directors’ remuneration in accordance with the Companies Act 1985 are set out in note 11 to the financial<br />
statements.<br />
THE NOTICE PERIOD for the termination of the employment of an Executive Director is six months.<br />
NON-EXECUTIVE DIRECTORS representing the shareholders receive no fee from the Company.<strong>The</strong> fees for other Non-Executive Directors are reviewed<br />
every two years by the Chairman. Non-Executive Directors do not have service contracts and do not participate in bonus arrangements.<br />
TRANSACTIONS BETWEEN THE GROUP AND GROSVENOR TRUSTS are disclosed in note 40 to the financial statements. Certain Company<br />
Directors are Trustees of <strong>Grosvenor</strong> Trusts and are also Directors of other companies with which the Group may from time to time enter into transactions on<br />
normal commercial terms. In the opinion of the Board, none of these relationships are such as to impair the independence of the Non-Executive Directors.<br />
Robin Broadhurst<br />
Chairman of the Remuneration Committee<br />
15 March 2007<br />
58
DIRECTORS’ REPORT<br />
<strong>The</strong> Directors present their annual report and the Group’s audited consolidated financial statements for the year ended 31 December 2006.<br />
PRINCIPAL ACTIVITIES AND BUSINESS REVIEW<br />
<strong>The</strong> Group’s principal activities are property investment, development and fund management in Britain & Ireland, North America, Continental Europe and<br />
Australia Asia Pacific.<br />
<strong>The</strong> review of the business in accordance with the requirements of Section 234ZZB of the Companies Act 1985 (the “Business Review”) can be found in<br />
the review section on pages 1 to 53, which is incorporated into this report by reference.<br />
<strong>The</strong> other information that fulfils the requirements of the Business Review is set out below.<br />
RISKS AND UNCERTAINTIES<br />
We aim to generate returns over the long term (5-10+ years) at or above our cost of capital. Each Operating Company endeavours to maximise its returns<br />
in accordance with an agreed stance on risk.We seek to ensure that the risks encountered by the business are identified, quantified, understood and managed<br />
in an appropriate way.<br />
<strong>The</strong> Group’s operations are managed under a devolved structure. However, since the activities of property investment, development and fund management<br />
are common to each region, the nature of business risks encountered in each region is broadly similar. Set out below is a summary of the principal risks faced<br />
by the business, followed by an explanation of each of those risks.<br />
Market risk<br />
Property markets are cyclical, so our businesses will always be subject to variations in the value of our portfolio.Taking a long term view, our focus is less on<br />
short term fluctuations and more on the underlying revenue generating potential of the Group.<br />
Our exposure to market risk is mitigated through a balanced allocation of capital to different geographic markets and property sectors, which is explained<br />
in more detail under asset allocation below.<br />
Short term market risk is more relevant in our development activity, where market conditions may affect leasing terms.We commit to development projects<br />
only after taking careful account of the outlook for our markets. Development exposures are frequently reduced by working in joint ventures. If a trading project<br />
completes at a relatively low point in the market cycle, we might retain the asset until the market recovers.<br />
In the future we expect to be able to make use of property derivatives as a further mechanism for managing our exposure to market risk.<br />
Asset allocation<br />
<strong>The</strong> Group’s primary financial objective is to maximise returns at acceptable levels of risk. Fundamental to this is the optimal allocation of equity between each<br />
of the Operating Companies and the devolution of property decision-making authority to local boards.<br />
<strong>The</strong> allocation of equity to regional Operating Companies is a continuous process on an annual cycle.<strong>The</strong> process includes detailed research of long term<br />
(5+ years) macro-economic projections, a review of regional economic and Operating Company historic and projected performance, consideration of wider<br />
issues such as climate change, and the use of portfolio theory simulations. From this, the Holding Company determines a range of the desired relative weighting<br />
of capital to each region over the long term. Medium term (2-5 year) target weightings are set by reference to long term ranges, adjusted for medium term<br />
factors. Actual annual allocations are made consistent with medium term targets and long term ranges, but in response to short term (0-2 year), tactical and<br />
opportunistic considerations.<strong>The</strong> Group retains the financial capacity for unplanned opportunities that may arise.<br />
Long term ranges agreed in January 2007, and actual equity allocations at 31 December 2006, were as follows:<br />
Percentage of Group Equity<br />
Long term<br />
At 31 December<br />
range 2006<br />
Region % %<br />
–––––––––––––––––——————–––––––––———<br />
Britain & Ireland 45.0 – 65.0 60.7<br />
Americas 12.5 – 27.5 14.7<br />
Continental Europe 10.0 – 22.5 16.0<br />
Australia Asia Pacific 5.0 – 20.0 7.5<br />
Fund Management 0 – 10.0 1.1<br />
–––––––––––––––––——————–––––––––———<br />
At the Operating Company level, each board reviews the strategy within its region annually. This review takes account of the geographic allocation in the region<br />
as well as the allocation between sectors and the split between investment and development.<br />
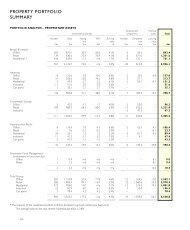
<strong>The</strong> current distribution of the Group’s portfolio by sector and region is shown in the portfolio summary on pages 112 and 113, and the distribution of<br />
total assets under management is shown on pages 4 and 5.<br />
59
DIRECTORS’ REPORT<br />
Property risks<br />
Investment properties<br />
<strong>The</strong> principal risk in property investment is the loss of income.We ensure that properties are properly maintained and managed, occupancy is maximised and<br />
our exposure to individual tenants is managed. Asset management is undertaken by teams with overall responsibility for the properties within their portfolios.<br />
Day to day property management is either outsourced to professional property managers or managed in house.<br />
Leasing risk is managed by dedicated in house leasing teams and the use of professional leasing agents. Exposure to individual tenants or sector groups is<br />
reduced by maintaining a diversified tenant base and by reviewing the credit worthiness of new tenants.<br />
Developments<br />
In property development the main risks arise in managing the development cycle, including obtaining appropriate planning consents and controlling the<br />
construction process. We have dedicated teams involved in site assembly and planning and we limit committed expenditure prior to planning consent being<br />
obtained. Construction risk is managed by in house project management teams using external contractors. In many cases construction risk is shared with partners.<br />
Capital raising<br />
We have no plans to seek further equity capital through the issue of new shares. Capital for investment is available from retained earnings. Our preference for<br />
working with partners and fund management investors provides access to capital, beyond our own resources, for investment and development opportunities.<br />
Recognising the importance of this source of capital we established <strong>Grosvenor</strong> Fund Management two years ago.Working with like minded investors in property<br />
is now a core part of our business.<br />
Acquisitions and sales<br />
When acquiring or selling property the principal risk is in underwriting the future income flows in order to determine an appropriate price.Timing of property<br />
transactions is managed as part of the annual asset allocation review within each Operating Company. Estimated price levels are supported by detailed financial<br />
appraisals – which are conducted for all property transactions. Where deals occur within joint ventures or funds, they require the approval of an investment<br />
committee which is independent from the asset management team. Every property transaction is subject to a due diligence review, including corporate due<br />
diligence where properties are acquired within corporate vehicles.<br />
Health and safety<br />
<strong>Grosvenor</strong> operates in four regions of the world and across a range of sectors including offices, residential, retail, business parks and light industrial.<strong>The</strong> Group<br />
is committed to achieving high standards of health and safety throughout the business and adhering to best practice.<br />
Overall responsibility for health and safety is taken by the Group Finance Director. Each Operating Company board is responsible for health and safety in<br />
its business with the support of the internal Health and Safety Director and external consultants with local expertise to help them achieve compliance.<br />
<strong>The</strong> Group’s objective is to ensure that employees throughout the Group are well informed and consulted on matters regarding health and safety which is<br />
treated as a key part of the wider risk management process.<br />
Each Operating Company formally reports its compliance each year and progress is monitored on a regular basis.<br />
<strong>The</strong> Group continues to review its reporting of performance information and has implemented a health and safety IT management system to assist the<br />
business. All accidents and cases of ill health are treated seriously. In 2006 each business had a health and safety action plan and made good progress in<br />
completing these plans.<br />
In 2006, there were 170 (2005 – 29) incidents relating to premises and projects that <strong>Grosvenor</strong> controls that were reportable to statutory authorities.<br />
<strong>The</strong> increase arises from an expansion in our development activities and relates to injuries to third parties.<br />
<strong>Grosvenor</strong> did not receive any enforcement action from statutory Health and Safety authorities in 2006.<br />
Health and safety targets have been developed by the Group and each Operating Company.<strong>The</strong>se include achieving a full understanding of the risk burden<br />
that each business needs to manage and receiving assurances that we have management systems in place to cope with workplace and other risks.<br />
Environment<br />
<strong>The</strong> Group takes a long term view of its activities and responsibilities. Environmental considerations are therefore an important factor throughout the<br />
management of all Group companies.Two main principles are observed:<br />
• <strong>Grosvenor</strong> seeks to identify and minimise its environmental impact, wherever it occurs, aiming for continuous improvement in performance; and<br />
• <strong>Grosvenor</strong> seeks to make a positive contribution to sustainable development, giving consideration to environmental, economic and social sustainability in all<br />
its operations.<br />
<strong>The</strong>se principles are applied through specific objectives, policies, targets and benchmarks which are managed at Operating Company level. <strong>The</strong> Director<br />
responsible for environmental policy is the Group Chief Executive.<br />
60
DIRECTORS’ REPORT<br />
Reputation and brand<br />
We are aware that the professional reputation of the individuals and businesses within the Group is an important intangible asset, as is the <strong>Grosvenor</strong> brand.<br />
We seek to manage those assets by investing appropriately in them, and by identifying potential reputational or brand risks and acting swiftly to mitigate them<br />
whether they be real or perceived. In 2006 we enhanced the expertise available to us by increasing our in house and consultancy resource in reputation<br />
management; for 2007 we have initiated a Group-wide project to continue the development of our brand.<br />
Financial risks<br />
Liquidity/cashflow<br />
<strong>Grosvenor</strong> obtains financing from a number of sources, including secured lending at project level together with secured and unsecured borrowing at the<br />
corporate level. To ensure we have sufficient available cash to meet our operating plans, cash flow projections are maintained at Operating Company level.<br />
Committed borrowing facilities are maintained as deemed appropriate. At 31 December 2006 the Group had undrawn working capital facilities of £429.1m.<br />
We set limits at each Operating Company to ensure that the interest cost of all projected debt can be met from “sustainable” cash flows, excluding those<br />
that are dependent on property sales.<br />
Credit<br />
Surplus cash is deposited with major financial institutions with credit ratings at or above a specified level. We set limits to restrict the total amount of funds that<br />
can be deposited with any single counterparty.<br />
Interest rate<br />
Exposure to interest rate movements is controlled through the use of a mixture of floating and fixed rate debt and interest rate derivatives, to achieve the<br />
required interest rate profile.<br />
Foreign currency<br />
Our investments outside Britain & Ireland are held for the long term, so it is the Group’s policy not to hedge the net investment in these regions. Within each<br />
region there is a certain amount of natural currency hedging as debt is drawn in local currency to finance local operations. Short term cash flows between<br />
currencies are hedged by the use of foreign exchange derivatives.<br />
Tax<br />
Exposure to tax risk arises as a result of the Group operating across a large number of tax jurisdictions. In addition to different tax filing requirements in each<br />
territory, there is also exposure to the impact of future changes in tax legislation.<strong>The</strong>se risks are managed by an in-house team who work alongside a team of<br />
external tax advisers.<br />
People<br />
We take considerable care in recruiting, retaining and growing <strong>Grosvenor</strong> people. We have graduate qualifying programmes and a range of development<br />
opportunities exist. Succession planning is overseen by Remuneration Committees. Our compensation is regularly benchmarked against the market and we<br />
reward loyalty, excellence and effort.<br />
Information technology<br />
<strong>The</strong> Group’s operations are highly dependent on the effectiveness of IT systems, including communications systems, property databases and financial systems.<br />
We have control procedures to protect the integrity and security of our data.<strong>The</strong>se procedures are supported by detailed disaster recovery plans, tested on a<br />
regular basis. In 2006 we established the Business Process Group to ensure that the Group achieves business improvement through the efficient delivery of<br />
Group-wide process and system changes.<br />
KEY PERFORMANCE INDICATORS AND MEASURES OF RETURN<br />
At <strong>Grosvenor</strong> we take a long term view so we are less interested in year on year comparisons and more concerned with the overall trend in our performance.<br />
We monitor total return on property assets and growth in revenue profit. We calculate total return on a proportional basis, including our share of joint<br />
ventures and associates. We define it as profit before tax and interest payable, plus revaluations and after exchange movements, as a percentage of average<br />
property assets (before current year revaluations) including cash. Revenue profit is shown in note 4.<br />
Our achievement against these indicators is set out in the Finance Director’s report on pages 12 to 15. We currently employ numerous key performance<br />
indicators throughout the Group to help achieve ambitious goals and our philosophy of continuous improvement.<br />
61
DIRECTORS’ REPORT<br />
RESULTS AND DIVIDENDS<br />
<strong>The</strong> results for the year are set out in the consolidated income statement on page 66. Profit for the year was £364.2m (2005 – £265.1m). Dividends paid during<br />
the year amounted to £9.4m (2005 – £8.5m). Subsequent to the year end a dividend of £6.7m (2005 – £6.1m) was proposed, but in accordance with IFRS<br />
has not been provided in these financial statements.<br />
On 14 March 2007 the Company purchased the following shares from shareholders representing 6.56% of its called up share capital:<br />
Ordinary shares Nominal value £1 399,047<br />
Non-voting ordinary shares Nominal value £1 3,192,376<br />
12% Non-cumulative irredeemable preference shares Nominal value £1 399,047<br />
<strong>The</strong> total consideration for the purchase of the above shares was £40.3m, funded from available cash.<strong>The</strong> reason for the purchase of the shares is to better<br />
align the shareholders’ interests with the Group’s activities.<br />
DIRECTORS<br />
Details of the Directors of the Company and their biographies are given on pages 16 and 17. All Directors served throughout the year with the exception of<br />
those set out below.<br />
Jonathan O Hagger (resigned 31 May 2006)<br />
Nicholas R Scarles (appointed 1 June 2006)<br />
Mark R Preston (appointed 15 June 2006)<br />
Stephen H R Musgrave (resigned 30 June 2006)<br />
DIRECTORS’ INTERESTS IN SECURITIES<br />
<strong>The</strong> interests of the Directors who served during the year in the share and loan capital of <strong>Grosvenor</strong> Group Limited are shown below.<br />
12% Non-cumulative<br />
Non-voting<br />
irredeemable<br />
Ordinary shares ordinary shares preference shares<br />
At At At At At At<br />
1 January 31 December 1 January 31 December 1 January 31 December<br />
2006 2006 2006 2006 2006 2006<br />
–––––––––––––––––––––––––––––––––––––––––––––––––––––––––––––––––––—————————<br />
Beneficial<br />
<strong>The</strong> Duke of Westminster 6,083,924 6,083,924 48,671,392 48,671,392 6,083,924 6,083,924<br />
Non-beneficial<br />
<strong>The</strong> Earl of Home 1,515,529 1,515,529 12,124,233 12,124,233 1,515,529 1,515,529<br />
Jeremy H M Newsum 4,290,433 4,290,433 34,323,463 34,323,463 4,290,433 4,290,433<br />
Robin S Broadhurst 4,052,363 4,052,363 32,418,904 32,418,904 4,052,363 4,052,363<br />
–––––––––––––––––––––––––––––––––––––––––––––––––––––––––––––––––––—————————<br />
<strong>The</strong> non-beneficial interests above represent the shares owned by the respective Directors in their capacity as Trustees of the <strong>Grosvenor</strong> Trusts. <strong>The</strong>re have<br />
been no changes in beneficial or non-beneficial interests since 31 December 2006 other than the beneficial interests of the Duke of Westminster, which have<br />
reduced as a result of the purchase of shares noted above.<br />
Where a Director has a joint interest in securities, the above disclosures include for each Director the number of securities that are jointly held.<br />
5,438 ordinary shares of <strong>Grosvenor</strong> Continental Europe Holdings S.A., representing 0.2% of its share capital, have been awarded but not yet issued to Neil<br />
Jones in connection with a long term incentive scheme.<br />
Except as disclosed above, none of the Directors of the Company who served during the year had any interests in the securities of the Company or any<br />
of its subsidiary undertakings.<br />
62
DIRECTORS’ REPORT<br />
CHARITABLE AND POLITICAL CONTRIBUTIONS<br />
Charitable contributions during the year amounted to £1.5m (2005 – £1.3m). £1.2m was donated to the Westminster Foundation (2005 – £1.0m) which<br />
supports a wide range of charitable causes. No political contributions were made during the year (2005 – £nil).<br />
POLICY ON PAYMENT OF SUPPLIERS<br />
Payment terms are agreed with suppliers on an individual basis. It is the policy of both the Company and the Group to abide by the agreed terms, provided<br />
that the suppliers also comply with all relevant terms and conditions. In respect of the Group’s activities in the UK, trade creditors at 31 December 2006<br />
represented 8 days’ purchases (2005 – 8 days).<strong>The</strong> Company has no trade creditors.<br />
EMPLOYEES<br />
<strong>The</strong> Group gives full and fair consideration to applications by disabled persons for employment. Disabled employees and those who become disabled are<br />
afforded the same training, career development and promotion opportunities as other staff.<strong>The</strong> Directors recognise the importance of good communications<br />
and relations with the Group’s employees. Each part of the Group maintains employee relationships appropriate to its own particular needs and environment.<br />
AUDITORS<br />
<strong>The</strong> Company has elected to dispense with the obligation to appoint auditors annually and, accordingly, Deloitte & Touche LLP shall be deemed to be<br />
re-appointed as auditors for a further term under the provisions of section 386(2) of the Companies Act 1985.<br />
In so far as the Directors are aware:<br />
a) there is no relevant audit information of which the auditors are unaware; and<br />
b) the Directors have taken all reasonable steps that they ought to have taken to make themselves aware of any relevant information and to establish that the<br />
Company’s auditors are aware of that information.<br />
This information is given in accordance with s.234ZA of the Companies Act 1985.<br />
Judith Ball UK Company registration number 3219943<br />
Company Secretary<br />
Registered Office<br />
15 March 2007 70 <strong>Grosvenor</strong> Street<br />
London W1K 3JP<br />
63
STATEMENT OF DIRECTORS’ RESPONSIBILITIES<br />
<strong>The</strong> Directors are responsible for preparing the Annual Report and the financial statements in accordance with applicable law and regulations.<br />
Company law requires the Directors to prepare financial statements for each financial year. Under that law the Directors have elected to prepare the<br />
financial statements in accordance with International Financial Reporting Standards (IFRSs) as adopted by the European Union.<strong>The</strong> financial statements are<br />
also required by law to be properly prepared in accordance with the Companies Act 1985.<br />
International Accounting Standard 1 requires that financial statements present fairly for each financial year the Company’s financial position, financial<br />
performance and cash flows.This requires the faithful representation of the effects of transactions, other events and conditions in accordance with the definitions<br />
and recognition criteria for assets, liabilities, income and expenses set out in the International Accounting Standards Board’s ‘Framework for the preparation and<br />
presentation of financial statements’. In virtually all circumstances, a fair presentation will be achieved by compliance with all applicable IFRSs. However, Directors<br />
are also required to:<br />
• properly select and apply accounting policies;<br />
• present information, including accounting policies, in a manner that provides relevant, reliable, comparable and understandable information;<br />
• provide additional disclosures when compliance with the specific requirements in IFRSs are insufficient to enable users to understand the impact of particular<br />
transactions, other events and conditions on the entity’s financial position and financial performance; and<br />
• make an assessment of the Company’s ability to continue as a going concern.<br />
<strong>The</strong> Directors are responsible for keeping proper accounting records that disclose with reasonable accuracy at any time the financial position of the<br />
Company and enable them to ensure that the financial statements comply with the Companies Act 1985.<strong>The</strong>y are also responsible for safeguarding the assets<br />
of the Company and hence for taking reasonable steps for the prevention and detection of fraud and other irregularities.<br />
<strong>The</strong> Directors are responsible for the maintenance and integrity of the corporate and financial information included on the Company’s website. Legislation<br />
in the United Kingdom governing the preparation and dissemination of financial statements may differ from legislation in other jurisdictions.<br />
CORPORATE ADVISERS AND BANKERS<br />
AUDITORS:<br />
TAX ADVISERS:<br />
PRINCIPAL VALUERS:<br />
SOLICITORS:<br />
LEAD BANKERS:<br />
ACTUARIES:<br />
Deloitte & Touche LLP<br />
KPMG LLP<br />
CB Richard Ellis, Cushman & Wakefield, DTZ Debenham Tie Leung<br />
Boodle Hatfield, Slaughter and May<br />
<strong>The</strong> Royal Bank of Scotland Group plc<br />
Lane Clark & Peacock LLP<br />
64
INDEPENDENT AUDITORS’ REPORT TO THE MEMBERS<br />
OF GROSVENOR GROUP LIMITED<br />
We have audited the Group and parent Company financial statements (the “financial statements”) of <strong>Grosvenor</strong> Group Limited for the year ended<br />
31 December 2006 which comprise the consolidated income statement, the consolidated and parent Company balance sheets, the consolidated statement of<br />
recognised income and expense, the consolidated statement of cash flows, and the related notes 1 to 40.<strong>The</strong>se financial statements have been prepared under<br />
the accounting policies set out therein.<br />
This report is made solely to the Company’s members, as a body, in accordance with section 235 of the Companies Act 1985. Our audit work has been<br />
undertaken so that we might state to the Company’s members those matters we are required to state to them in an auditors’ report and for no other purpose.<br />
To the fullest extent permitted by law, we do not accept or assume responsibility to anyone other than the Company and the Company’s members as a body,<br />
for our audit work, for this report, or for the opinions we have formed.<br />
RESPECTIVE RESPONSIBILITIES OF DIRECTORS AND AUDITORS<br />
<strong>The</strong> Directors’ responsibilities for preparing the Annual Report and the financial statements in accordance with applicable law and International Financial<br />
Reporting Standards (IFRSs) as adopted by the European Union are set out in the Statement of Directors’ Responsibilities.<br />
Our responsibility is to audit the financial statements in accordance with relevant United Kingdom legal and regulatory requirements and International<br />
Standards on Auditing (UK and Ireland).<br />
We report to you our opinion as to whether the financial statements give a true and fair view and are properly prepared in accordance with the Companies<br />
Act 1985.We also report to you whether, in our opinion, the information given in the Directors’ Report is consistent with the financial statements.<br />
In addition we report to you if, in our opinion, the Company has not kept proper accounting records, if we have not received all the information and<br />
explanations we require for our audit, or if information specified by law regarding Directors’ Remuneration and other transactions is not disclosed.<br />
We read the other information contained in the Annual Report as described in the contents section and consider whether it is consistent with the audited<br />
financial statements. We consider the implications for our report if we become aware of any apparent misstatements or material inconsistencies with the financial<br />
statements. Our responsibilities do not extend to any further information outside the Annual Report.<br />
BASIS OF AUDIT OPINION<br />
We conducted our audit in accordance with International Standards on Auditing (UK and Ireland) issued by the Auditing Practices Board. An audit includes<br />
examination, on a test basis, of evidence relevant to the amounts and disclosures in the financial statements. It also includes an assessment of the significant<br />
estimates and judgments made by the Directors in the preparation of the financial statements, and of whether the accounting policies are appropriate to the<br />
circumstances of the Company and the Group, consistently applied and adequately disclosed.<br />
We planned and performed our audit so as to obtain all the information and explanations which we considered necessary in order to provide us with<br />
sufficient evidence to give reasonable assurance that the financial statements are free from material misstatement, whether caused by fraud or other irregularity<br />
or error. In forming our opinion we also evaluated the overall adequacy of the presentation of information in the financial statements.<br />
OPINION<br />
In our opinion:<br />
• the financial statements give a true and fair view, in accordance with IFRSs as adopted by the European Union, of the state of the Group’s and the Parent<br />
Company’s affairs as at 31 December 2006, and of the Group’s profit for the year then ended;<br />
• the financial statements have been properly prepared in accordance with the Companies Act 1985; and<br />
• the information given in the Directors’ Report is consistent with the financial statements.<br />
Deloitte & Touche LLP<br />
Chartered Accountants and Registered Auditors<br />
London<br />
15 March 2007<br />
Neither an audit nor a review provides assurance on the maintenance and integrity of the website, including controls used to achieve this, and in particular<br />
whether any changes may have occurred to the financial information since first published.<strong>The</strong>se matters are the responsibility of the directors but no control<br />
procedures can provide absolute assurance in this area.<br />
Legislation in the United Kingdom governing the preparation and dissemination of financial information differs from legislation in other jurisdictions.<br />
65
CONSOLIDATED INCOME STATEMENT<br />
for the year ended 31 December 2006<br />
2006 2005<br />
Note £m £m<br />
–––––––––––––––——————–––––––––———<br />
Total revenue 3 352.8 391.2<br />
–––––––––––––––——————–––––––––———<br />
Gross rental income 5 106.8 96.8<br />
Property outgoings 6 (41.6) (45.9)<br />
–––––––––––––––——————–––––––––———<br />
Net rental income 65.2 50.9<br />
Other income 7 52.9 29.9<br />
Administrative expenses 8 (75.8) (53.3)<br />
Loss on trading and development properties 12 (176.6) (7.3)<br />
Gains on other investments 13 0.3 –<br />
Net gains on revaluation and sale of investment property 14 518.7 246.8<br />
Impairment of goodwill 25 (0.2) (3.3)<br />
Share of profit from joint ventures 22 149.6 121.6<br />
Share of loss from associates 23 (4.6) –<br />
–––––––––––––––——————–––––––––———<br />
Profit from operations including share of joint ventures and associates 529.5 385.3<br />
Dividend income 15 1.1 0.3<br />
Financial income 15 19.3 21.4<br />
Financial expenses 15 (41.2) (38.9)<br />
–––––––––––––––——————–––––––––———<br />
Net financing costs 15 (20.8) (17.2)<br />
–––––––––––––––——————–––––––––———<br />
Profit before tax 508.7 368.1<br />
Current tax 16 (20.1) (8.5)<br />
Deferred tax 16 (124.4) (94.5)<br />
–––––––––––––––——————–––––––––———<br />
Profit for the year 38 364.2 265.1<br />
–––––––––––––––——————–––––––––———<br />
Attributable to:<br />
Equity holders of the parent 38 347.1 251.5<br />
Minority interests 38 17.1 13.6<br />
–––––––––––––––——————–––––––––———<br />
Profit for the year 38 364.2 265.1<br />
–––––––––––––––——————–––––––––———<br />
All activities derive from continuing operations.<br />
66
BALANCE SHEETS<br />
as at 31 December 2006<br />
Group Group Company Company<br />
2006 2005 2006 2005<br />
Note £m £m £m £m<br />
––––––––––––––––––––––––––––––––––––––—————––––––––––––––———<br />
ASSETS<br />
Non-current assets<br />
Investment property 18 2,264.4 1,936.0 – –<br />
Investment property under development 19 85.6 71.4 – –<br />
Other property, plant and equipment 20 43.1 33.8 – –<br />
Investments in subsidiaries 21 – – 1,358.4 1,363.9<br />
Investments in joint ventures 22 988.3 790.0 – –<br />
Investment in associates 23 61.8 29.4 – –<br />
Other financial assets 24 50.0 71.0 – –<br />
Intangible assets 25 4.9 3.9 – –<br />
Deferred tax assets 26 65.8 95.0 – –<br />
––––––––––––––––––––––––––––––––––––––—————––––––––––––––———<br />
Total non-current assets 3,563.9 3,030.5 1,358.4 1,363.9<br />
––––––––––––––––––––––––––––––––––––––—————––––––––––––––———<br />
Current assets<br />
Trading properties 27 48.7 34.5 – –<br />
Trade and other receivables 28 133.1 75.5 110.5 15.0<br />
Other financial assets 24 9.4 – – –<br />
Income tax receivable 30.7 12.7 – –<br />
Cash and cash equivalents 29 455.4 385.5 – –<br />
––––––––––––––––––––––––––––––––––––––—————––––––––––––––———<br />
Total current assets 677.3 508.2 110.5 15.0<br />
––––––––––––––––––––––––––––––––––––––—————––––––––––––––———<br />
TOTAL ASSETS 4,241.2 3,538.7 1,468.9 1,378.9<br />
LIABILITIES<br />
Non-current liabilities<br />
Interest-bearing loans and borrowings 30 (565.6) (555.1) – –<br />
Trade and other payables 32 (154.6) (176.0) – –<br />
Employee benefits 10 (15.8) (27.8) – –<br />
Deferred tax liabilities 26 (555.2) (450.6) – –<br />
––––––––––––––––––––––––––––––––––––––—————––––––––––––––———<br />
Total non-current liabilities (1,291.2) (1,209.5) – –<br />
––––––––––––––––––––––––––––––––––––––—————––––––––––––––———<br />
Current liabilities<br />
Overdrafts 29 (4.6) (1.2) – –<br />
Interest-bearing loans and borrowings 30 (89.3) (19.1) – –<br />
Trade and other payables 32 (106.9) (94.7) – –<br />
Income tax payable (23.6) (17.7) – –<br />
Provisions 33 (158.8) (10.0) – –<br />
––––––––––––––––––––––––––––––––––––––—————––––––––––––––———<br />
Total current liabilities (383.2) (142.7) – –<br />
––––––––––––––––––––––––––––––––––––––—————––––––––––––––———<br />
TOTAL LIABILITIES (1,674.4) (1,352.2) – –<br />
––––––––––––––––––––––––––––––––––––––—————––––––––––––––———<br />
NET ASSETS 2,566.8 2,186.5 1,468.9 1,378.9<br />
––––––––––––––––––––––––––––––––––––––—————––––––––––––––———<br />
––––––––––––––––––––––––––––––––––––––—————––––––––––––––———<br />
Equity<br />
Share capital 37 60.8 60.8 60.8 60.8<br />
Share premium 38 173.1 173.1 28.3 28.3<br />
Reserves 38 210.2 240.2 1,268.7 1,268.7<br />
Retained earnings 38 1,973.8 1,617.5 111.1 21.1<br />
––––––––––––––––––––––––––––––––––––––—————––––––––––––––———<br />
Shareholders’ funds 38 2,417.9 2,091.6 1,468.9 1,378.9<br />
Minority interests 38 148.9 94.9 – –<br />
––––––––––––––––––––––––––––––––––––––—————––––––––––––––———<br />
TOTAL EQUITY 38 2,566.8 2,186.5 1,468.9 1,378.9<br />
––––––––––––––––––––––––––––––––––––––—————––––––––––––––———<br />
Approved by the Board on 15 March 2007 and signed on behalf of the Board<br />
<strong>The</strong> Duke of Westminster KG OBE TD DL (Chairman)<br />
Nicholas Scarles FCA CPA ATTORNEY AT LAW (Group Finance Director)<br />
67
CONSOLIDATED STATEMENT OF RECOGNISED INCOME AND EXPENSE<br />
for the year ended 31 December 2006<br />
2006 2005<br />
£m £m<br />
–––——————–––––––––———<br />
Foreign exchange translation differences (77.5) 55.6<br />
Revaluation of investment property under development – Group 19.0 11.4<br />
– joint ventures 22.0 0.1<br />
– associates 29.9 –<br />
Revaluation of other property, plant and equipment 8.7 5.8<br />
Change in fair value of equity shares available for sale (0.1) (7.8)<br />
Fair value adjustments on swaps 2.9 0.2<br />
Fair value adjustments transferred to income statement – 5.7<br />
Deferred tax on gains recognised in reserves (25.0) 0.8<br />
Actuarial gains and losses on defined benefit pension schemes 10.6 (11.3)<br />
–––——————–––––––––———<br />
Net (loss)/gain recognised directly in equity (9.5) 60.5<br />
Profit for the year 364.2 265.1<br />
–––——————–––––––––———<br />
Total recognised income and expense for the year 354.7 325.6<br />
–––——————–––––––––———<br />
Attributable to:<br />
Equity holders of the parent 335.7 311.9<br />
Minority interest 19.0 13.7<br />
–––——————–––––––––———<br />
354.7 325.6<br />
–––——————–––––––––———<br />
A consolidated statement of changes in equity is given in the reconciliation of share capital and reserves on page 104. <strong>The</strong> Company’s equity increased<br />
during the year as a result of the retained profit for the year of £99.4m (2005 – £8.5m) and reduced as a result of dividends paid to shareholders of<br />
£9.4m (2005 – £8.5m).<br />
68
CONSOLIDATED STATEMENT OF CASH FLOWS<br />
For the year ended 31 December 2006<br />
2006 2005<br />
Note £m £m<br />
–––––––––––––––——————–––––––––———<br />
Operating activities<br />
Operating profit before changes in working capital and provisions 39(A) 38.1 22.0<br />
(Increase)/decrease in trade and other receivables (24.4) 55.7<br />
(Increase)/decrease in trading and development properties (17.4) 16.3<br />
Increase in trade and other payables 8.3 20.8<br />
Decrease in employee benefits (4.9) (1.6)<br />
–––––––––––––––——————–––––––––———<br />
Cash generated from operations (0.3) 113.2<br />
Interest paid (47.2) (44.5)<br />
Income taxes paid (30.5) (8.1)<br />
Interest received 22.4 16.4<br />
–––––––––––––––——————–––––––––———<br />
Net cash flows from operating activities (55.6) 77.0<br />
–––––––––––––––——————–––––––––———<br />
Investing activities<br />
Proceeds from sale of investment property 371.9 261.2<br />
Acquisition of investment property (192.7) (73.1)<br />
Development of investment property (20.3) (31.0)<br />
Acquisition of other property, plant and equipment (2.6) (0.7)<br />
Acquisition of other financial assets (14.5) (13.5)<br />
Proceeds from sales of other financial assets 24.9 5.7<br />
Net cash flow from joint ventures and associates 15.9 (14.7)<br />
Acquisition of Group undertakings 39(C) (161.9) –<br />
Dividends received 1.1 0.3<br />
–––––––––––––––——————–––––––––———<br />
Net cash flows from investing activities 21.8 134.2<br />
–––––––––––––––——————–––––––––———<br />
Financing activities<br />
Proceeds from additional borrowings 108.0 26.3<br />
Repayment of borrowings (19.9) (79.1)<br />
Capital reduction in a subsidiary undertaking – (30.1)<br />
Minority shares issued by subsidiaries 35.5 –<br />
Dividends paid (9.9) (10.7)<br />
–––––––––––––––——————–––––––––———<br />
Net cash flows from financing activities 113.7 (93.6)<br />
–––––––––––––––——————–––––––––———<br />
Net increase in cash and cash equivalents 79.9 117.6<br />
Cash and cash equivalents at 1 January 384.3 264.2<br />
Effect of exchange rate fluctuation on cash held (13.4) 2.5<br />
–––––––––––––––——————–––––––––———<br />
Cash and cash equivalents at 31 December 29 450.8 384.3<br />
–––––––––––––––——————–––––––––———<br />
<strong>The</strong> Company had no cash or cash equivalents during the current and prior year and accordingly no cash flow is presented.<br />
69
NOTES TO THE FINANCIAL STATEMENTS<br />
1. ACCOUNTING POLICIES<br />
(A)<br />
(B)<br />
(C)<br />
(D)<br />
BASIS OF PREPARATION<br />
<strong>The</strong>se financial statements have been prepared in accordance with ‘International Financial Reporting Standards’ as adopted by the European Union. <strong>The</strong>se<br />
are those International Accounting Standards, International Financial Reporting Standards and related Interpretations (SIC-IFRIC interpretations),<br />
subsequent amendments to those standards and related interpretations, future standards and related interpretations issued or adopted by the<br />
International Accounting Standards Board (IASB) that have been adopted by the European Union.<br />
<strong>The</strong> financial statements are prepared on the historical cost basis, except for the revaluation of investment and development properties, certain<br />
financial assets and derivatives and deferred tax thereon.<strong>The</strong> principal accounting policies adopted are set out below.<br />
Certain minor changes have been made to the comparative figures in order to assist with comparability.<strong>The</strong> Company has elected under section<br />
230 of the Companies Act 1985 not to include its own income statement in these financial statements.<br />
BASIS OF CONSOLIDATION<br />
<strong>The</strong> consolidated financial statements of the Group incorporate the financial statements of the Company and entities controlled wholly or jointly by<br />
the Company up to 31 December 2006.<br />
Subsidiaries are those entities, including special purpose entities, controlled by the Company. Control exists when the Company has the power,<br />
directly or indirectly, to govern the financial and operating policies of an entity so as to obtain benefits from its activities.<strong>The</strong> financial statements of<br />
subsidiaries are included in the consolidated financial statements from the date that control commences until the date that control ceases.<br />
Joint ventures are those entities over whose activities the Group has joint control, established by contractual agreement. Associates are those<br />
entities over whose activities the Group has significant influence established by contractual agreement. Interests in joint ventures and associates are<br />
accounted for under the equity method whereby the consolidated balance sheet incorporates the Group’s share of the net assets of its joint ventures<br />
and associates and the consolidated income statement includes the Group’s share of the joint ventures’ and associates’ profit or loss after tax for the<br />
period, in both cases presented separately. <strong>The</strong> consolidated financial statements include the Group’s share of the total recognised gains and losses<br />
of joint ventures and associates on an equity accounted basis.<br />
Jointly controlled assets are those where the Group has joint ownership of a direct interest in an asset.<strong>The</strong> Group accounts for jointly controlled<br />
assets by including its share of the individual items of assets, liabilities, income and expenses.<br />
Business combinations are accounted for under the acquisition method. Any discount between the cost of the acquisition and the fair value of the<br />
Group’s share of the net assets of the acquired subsidiary, joint venture or associate at the effective date of acquisition is credited to the income statement<br />
in the period of acquisition while any excess is recognised as goodwill. Goodwill is reported in the balance sheet as an intangible asset or included within<br />
associates and joint ventures, as appropriate. Goodwill is subject to annual impairment reviews and is stated at cost less any impairment.<br />
<strong>The</strong> gain or loss on disposal of subsidiaries, joint ventures and associates is calculated by reference to the Group’s share of the net assets at the<br />
date of disposal including the attributable amount of goodwill which has not been impaired.<br />
FOREIGN CURRENCY TRANSLATION<br />
At entity level, transactions denominated in foreign currencies are translated into sterling at the exchange rate ruling on the date the transaction is<br />
recorded. Monetary assets and liabilities denominated in foreign currencies are retranslated at the exchange rate ruling at the balance sheet date or,<br />
if hedged, at the exchange rate under the related hedging transaction and the resultant exchange differences are dealt with in the income statement.<br />
On consolidation, the results of overseas companies are translated into Sterling at the average exchange rate for the period and their assets and<br />
liabilities are translated into sterling at the exchange rate ruling at the balance sheet date.<br />
In the cash flow statement, cash flows denominated in foreign currencies are translated into Sterling at the average exchange rate for the period.<br />
Exchange differences arising from the translation of foreign operations, and of related hedges, are taken to the translation reserve. <strong>The</strong>y are<br />
released into the income statement upon disposal.<br />
INVESTMENT PROPERTY<br />
Investment properties, including freehold and long leasehold properties and those in joint ventures, are those which are held either to earn rental<br />
income or for capital appreciation or for both. Investment properties are initially measured at cost, including transaction costs. After initial recognition<br />
investment properties are carried at their fair values, based on annual market valuations as determined by independent valuers.<br />
Any surplus or deficit on revaluation is recognised in the income statement as a valuation gain or loss.<br />
When the Group begins to redevelop an existing investment property for continued future use as investment property, the property continues<br />
to be classified as an investment property, and is measured based on the fair value model with valuation gains and losses being recorded in the<br />
income statement.<br />
When the Group begins to redevelop an existing investment property with a view to sale, the property is transferred to trading properties and<br />
held as a current asset.<strong>The</strong> property is re-measured to fair value at the date of transfer and any gain or loss is recognised in the income statement.<br />
<strong>The</strong> re-measured amount becomes the deemed cost at which the property is then carried in trading properties.<br />
70
NOTES TO THE FINANCIAL STATEMENTS<br />
1. ACCOUNTING POLICIES (CONTINUED)<br />
Property that is being constructed or developed for future use as investment property but which has not been previously classified as such is<br />
classified as investment property under development. Investment properties under development are initially measured at cost, including transaction<br />
costs. After initial recognition the properties are carried at their fair values, with any surplus or deficit recognised in the revaluation reserve, unless a<br />
deficit reduces the carrying value of a property to below its historic cost in which case it is recognised in the income statement. On practical<br />
completion development properties are transferred to investment property.<br />
(E)<br />
(F)<br />
(G)<br />
LEASES<br />
Leases to tenants where substantially all the risks and rewards of ownership are retained by the Group as lessor, are classified as operating leases.<br />
Payments made under operating leases, including prepayments, and net of any incentives provided by the Group, are charged to the income<br />
statement on a straight line basis over the period of the lease.<br />
Where a long leasehold property is held as an investment property, it is initially recognised at an amount equal to the sum of the premium paid<br />
on acquisition and the present value of minimum ground rent payments.<strong>The</strong> corresponding rent liability to the freeholder is included in the balance<br />
sheet as a finance lease obligation.<br />
OTHER PROPERTY, PLANT AND EQUIPMENT<br />
Property, plant and equipment are stated at cost less accumulated depreciation and impairment losses. Land and buildings are stated at fair value,<br />
with valuation gains and losses recognised in equity.<br />
Depreciation is charged to the income statement on a straight-line basis over the estimated useful lives of items of property, plant and equipment,<br />
and major components that are accounted for separately, at rates varying between 10% and 33.3% per annum, except for freehold property<br />
occupied by the Group which is depreciated where material over its expected useful life.<br />
OTHER FINANCIAL ASSETS<br />
Financial assets available for sale are stated at fair value which is determined by reference to an active market and any resultant gain or loss is<br />
recognised in the fair value reserve.Where the Group has the positive intent and ability to hold a financial asset to maturity, it is stated at amortised<br />
cost less impairment losses. Loans and receivables are included at amortised cost.<br />
(H)<br />
TRADING PROPERTIES<br />
Trading properties are held as current assets and are shown at the lower of cost and net realisable value. Net realisable value is the estimated selling<br />
price at completion less the estimated costs of completion including the estimated costs necessary to make the sale.<br />
(I)<br />
(J)<br />
(K)<br />
TRADE AND OTHER RECEIVABLES<br />
Trade and other receivables are stated at cost less any provision for impairment.<br />
CASH AND CASH EQUIVALENTS<br />
Cash and cash equivalents comprise cash balances and call deposits. Cash equivalents are short term, highly liquid investments that are readily<br />
convertible to a known amount of cash and which are subject to an insignificant risk of changes in value. Bank overdrafts that are repayable on<br />
demand and form an integral part of the Group’s cash management are included as a component of cash and cash equivalents for the purpose of<br />
the statement of cash flows.<br />
FINANCIAL INSTRUMENTS<br />
Derivative instruments utilised by the Group are interest rate swaps and caps and forward exchange contracts against known transactions.<strong>The</strong> Group<br />
does not enter into speculative derivative contracts. Any instruments used are for hedging purposes to alter the risk profile of an existing underlying<br />
exposure of the Group in line with its risk management policies. Amounts payable or receivable in respect of interest rate swaps are recognised as<br />
adjustments to interest expense over the period of the contracts.<br />
Changes in the fair value of derivative financial instruments that are designated and effective as hedges of future cash flows are recognised directly<br />
in equity and the ineffective portion is recognised immediately in the income statement. If the cash flow hedge of a firm commitment or forecasted<br />
transaction results in the recognition of an asset or a liability, then, at the time the asset or liability is recognised, the associated gains or losses on<br />
the derivative that had previously been recognised in equity are included in the initial measurement of the asset or liability. For hedges that do not<br />
result in the recognition of an asset or a liability, amounts deferred in equity are recognised in the income statement in the same period in which<br />
the hedged item affects net profit or loss.<br />
Changes in the fair value of derivative financial instruments that do not qualify for hedge accounting are recognised in the income statement as<br />
they arise.<br />
71
NOTES TO THE FINANCIAL STATEMENTS<br />
1. ACCOUNTING POLICIES (CONTINUED)<br />
Hedge accounting is discontinued when the hedging instrument expires or is sold, terminated, or exercised, or no longer qualifies for hedge<br />
accounting. At that time, any cumulative gain or loss on the hedging instrument recognised in equity is retained in equity until the forecasted<br />
transaction occurs. If a hedged transaction is no longer expected to occur, the net cumulative gain or loss recognised in equity is transferred to net<br />
profit or loss for the period.<br />
Derivatives embedded in other financial instruments or other host contracts are treated as separate derivatives when their risks and<br />
characteristics are not closely related to those of host contracts and the host contracts are not carried at fair value, with gains or losses reported<br />
in the income statement.<br />
(L)<br />
TRADE AND OTHER PAYABLES<br />
Trade and other payables are stated at cost.<br />
(M)<br />
(N)<br />
(O)<br />
BORROWINGS<br />
Borrowings are recognised initially at fair value, less attributable transaction costs. Subsequent to initial recognition, borrowings are stated at<br />
amortised cost with any difference between cost and redemption value being recognised in the income statement over the period of the borrowings<br />
on an effective interest basis.<br />
EMPLOYEE BENEFITS<br />
Obligations for contributions to defined contribution pension plans are recognised as an expense in the income statement as incurred.<br />
<strong>The</strong> Group’s net obligation in respect of defined benefit pension plans is calculated separately for each plan by estimating the amount of future<br />
benefit that employees have earned in return for their service in the current and prior periods; that benefit is discounted to determine its present value.<br />
<strong>The</strong> calculation is performed by a qualified actuary using the projected unit credit method.<strong>The</strong> future benefit liability is offset by the fair value of<br />
the pension plan assets at the balance sheet date.<br />
<strong>The</strong> expected annual charge for the defined benefit pension costs as estimated by the actuary is included in the income statement and comprises<br />
the current service cost, the interest cost on the future benefit liability and the expected return on plan assets.<br />
Adjustments between expectation and actual, together with all actuarial adjustments, are recognised in full in the year in which they arise and<br />
are credited or debited directly to reserves.<br />
REVENUE<br />
<strong>The</strong> Group’s revenue comprises rental income, service charges and other recoverables from tenants, income from provision of services including<br />
property management fees, development fees and fund management fees, proceeds of sales of its trading properties and development income.<br />
Revenue from development is recognised in the income statement in proportion to the stage of completion of the transaction at the balance<br />
sheet date. Revenue is not recognised if there are significant uncertainties regarding recovery of the consideration due. Provision is made for<br />
anticipated development losses.<br />
Rental income from investment property leased out under an operating lease is recognised in the income statement on a straight-line basis over<br />
the term of the lease. Lease incentives granted are recognised as an integral part of the total rental income over the life of the lease.<br />
Revenue from the sale of trading properties is recognised in the income statement when the significant risks and rewards of ownership have<br />
been transferred to the buyer, which is usually at completion.<br />
Performance fees receivable from funds are recognised in income when it is considered probable that a performance fee will be received and<br />
that fee can be reliably estimated.<strong>The</strong> amount of the performance fee recognised is the lower of the fee that has accrued at the balance sheet date<br />
and a prudent estimate of the fee that will be receivable at the end of the life of the fund. Where material, performance fees are discounted with<br />
any unwinding of the discount being recognised in interest income.<br />
(P)<br />
EXPENSES<br />
Rental payments made under operating leases are recognised in the income statement on a straight-line basis over the term of the lease. Lease incentives<br />
received are recognised in the income statement as an integral part of the total lease expense on a straight-line basis over the life of the lease.<br />
Minimum lease payments on finance leases are apportioned between the finance charge and the reduction of the outstanding liability.<strong>The</strong> finance<br />
charge is allocated to each period during the lease term so as to produce a constant periodic rate of interest on the remaining balance of the liability.<br />
Contingent rents are charged as expenses in the periods in which they are incurred.<br />
72
NOTES TO THE FINANCIAL STATEMENTS<br />
1. ACCOUNTING POLICIES (CONTINUED)<br />
(Q)<br />
BORROWING COSTS<br />
Borrowing costs relating to the financing of development properties and major improvements to investment properties are capitalised. Borrowing<br />
costs are calculated by reference to the actual rate payable on borrowings specific to a project or, where a project is financed out of general funds,<br />
to the average rate for all borrowings. Borrowing costs are capitalised from the commencement of the project, until the date of practical completion<br />
of the project.<br />
All other borrowing costs are recognised in the Group income statement in the period in which they are incurred.<br />
(R)<br />
(S)<br />
(T)<br />
INCOME TAX<br />
Income tax on the profit and loss for the year comprises current and deferred tax including tax on capital gains. Income tax is recognised in the<br />
income statement except to the extent that it relates to items recognised directly in equity, in which case it is recognised in equity.<br />
Current tax is the expected tax payable on the taxable income for the year, and any adjustment to tax payable in respect of previous years.<br />
Deferred tax is provided using the balance sheet liability method, providing for temporary differences between the carrying amounts of assets<br />
and liabilities for financial reporting purposes and the amounts used for taxation purposes. <strong>The</strong> following temporary differences are not provided<br />
for: the initial recognition of assets and liabilities that affect neither accounting nor taxable profit and differences relating to investments in subsidiaries<br />
to the extent that they will probably not reverse in the foreseeable future.<strong>The</strong> amount of deferred tax provided is based on the expected manner<br />
of realisation or settlement of the carrying amount of assets and liabilities, using tax rates enacted or substantially enacted at the balance sheet date.<br />
<strong>The</strong> Group provides deferred tax on investment properties by reference to the tax that would be due on the ultimate sale of the properties.<br />
Recognition on this basis means that, where applicable, indexation allowance is taken into account in the tax base cost.<br />
A deferred tax asset is recognised only to the extent that it is probable that future taxable profits will be available against which the asset can<br />
be utilised. Deferred tax assets are reduced to the extent that it is no longer probable that the related tax benefit will be realised.<br />
GOVERNMENT GRANTS<br />
An unconditional government grant is recognised in the income statement as revenue when the grant becomes receivable. Any other government<br />
grant is recognised in the balance sheet initially as deferred income when there is reasonable assurance that it will be received and that the Group<br />
will comply with the conditions attaching to it. Grants that compensate the Group for expenses incurred are recognised as revenue in the income<br />
statement on a systematic basis in the same periods in which the expenses are incurred. Grants that compensate the Group for the cost of an asset<br />
are deducted from the carrying amount of the asset.<br />
ADOPTION OF STANDARDS<br />
<strong>The</strong> following standards and interpretations have been issued but are not yet effective:<br />
• IFRS 7 Financial instruments: disclosures<br />
• IFRS 8 Operating segments<br />
• IFRIC 7 Applying the restatement approach under IAS 29<br />
• IFRIC 8 Scope of IFRS 2<br />
• IFRIC 9 Reassessment of embedded derivatives<br />
• IFRIC 10 Interim financial reporting and impairment<br />
• IFRIC 11 IFRS 2: Group and treasury share transactions<br />
• IFRIC 12 Service concession arrangements<br />
<strong>The</strong> Directors anticipate that the adoption of these standards and interpretations in future periods will have no material impact on the financial<br />
statements of the Group except for additional disclosures on capital and financial instruments when the relevant standards come into effect for<br />
periods commencing on or after 1 January 2007.<br />
73
NOTES TO THE FINANCIAL STATEMENTS<br />
1. ACCOUNTING POLICIES (CONTINUED)<br />
(U)<br />
SIGNIFICANT JUDGEMENTS AND KEY ESTIMATES<br />
i) Investment property valuation<br />
Investment properties and investment properties under development are carried at open market value in accordance with valuations carried<br />
out by independent valuers. Valuations are based on a number of key assumptions including an estimate of future rental income and the<br />
appropriate discount rate. For investment properties under development, key judgements also include estimates of future development costs.<br />
ii)<br />
iii)<br />
iv)<br />
Development provisions<br />
<strong>The</strong> provision for losses on the Liverpool One project is based on a detailed review of progress and an estimate of the remaining costs to<br />
complete the project.<br />
Deferred lease premiums<br />
Where operating lease premiums are received in exchange for the grant of a long leasehold interest, the related profit is recognised over<br />
the term of the lease. Many of the transactions giving rise to deferred lease premiums took place a number of years ago before the<br />
requirement to spread profit recognition; the Group has had to apply its judgement to estimate certain of the lease premium deferrals and<br />
associated deferred tax assets.<br />
Defined benefit pension schemes<br />
<strong>The</strong> net balance sheet obligation and the expected annual charge in respect of defined benefit pension plans is determined according to<br />
estimates carried out by actuaries on the basis of assumptions agreed by the Board. <strong>The</strong> key assumptions underlying these calculations are set<br />
out in note 10.<br />
2. FOREIGN CURRENCY<br />
<strong>The</strong> principal exchange rates used to translate the results, assets, liabilities and cashflows of overseas companies were as follows:<br />
Average rate<br />
Year end rate<br />
2006 2005 2006 2005<br />
£1 £1 £1 £1<br />
–––––––––––––––––––––––––––—————––––––––––––––———<br />
Euro 1.47 1.46 1.48 1.46<br />
US Dollar 1.85 1.82 1.96 1.72<br />
Canadian Dollar 2.09 2.20 2.28 2.01<br />
Australian Dollar 2.44 2.39 2.48 2.34<br />
Hong Kong Dollar 14.35 14.17 15.22 13.31<br />
Singapore Dollar 2.93 3.03 3.00 2.85<br />
Japanese Yen 214.53 200.36 233.20 202.63<br />
–––––––––––––––––––––––––––—————––––––––––––––———<br />
74
NOTES TO THE FINANCIAL STATEMENTS<br />
3. SEGMENTAL ANALYSIS<br />
2006<br />
Australia<br />
Britain & Continental Asia Fund<br />
Ireland Americas Europe Pacific Management Consolidated<br />
GEOGRAPHICAL SEGMENTS* £m £m £m £m £m £m<br />
–––––––––––––––––––––––––––––––––––––––––––––––––––––—————––––––––––––––———<br />
Income statement<br />
Income from external customers<br />
Rental income 69.1 22.0 2.4 13.3 – 106.8<br />
Income from trading and<br />
development properties 164.2 9.4 – 11.6 – 185.2<br />
Service charge income 7.6 – 0.3 – – 7.9<br />
Other income 12.3 11.4 1.5 1.1 26.6 52.9<br />
–––––––––––––––––––––––––––––––––––––––––––––––––––––—————––––––––––––––———<br />
Total revenue 253.2 42.8 4.2 26.0 26.6 352.8<br />
–––––––––––––––––––––––––––––––––––––––––––––––––––––—————––––––––––––––———<br />
Net rental and other income less administrative<br />
expenses 18.2 11.0 (1.2) 5.3 9.0 42.3<br />
(Losses)/gains from trading and development<br />
properties (180.7) 2.9 – 1.2 – (176.6)<br />
Gains on other investments 0.1 – – 0.2 – 0.3<br />
Net gains/(losses) on revaluation and sale of<br />
investment property 440.8 51.3 (0.2) 26.8 – 518.7<br />
Impairment of goodwill – – (0.2) – – (0.2)<br />
Share of profit from joint ventures 67.1 20.5 58.3 3.4 0.3 149.6<br />
Share of losses from associates (4.6) – – – – (4.6)<br />
Net financing costs (20.7) 1.6 (1.6) (0.7) 0.6 (20.8)<br />
–––––––––––––––––––––––––––––––––––––––––––––––––––––—————––––––––––––––———<br />
Profit before tax 320.2 87.3 55.1 36.2 9.9 508.7<br />
Current tax (5.8) (7.4) (0.6) (2.1) (4.2) (20.1)<br />
Deferred tax (98.2) (20.8) 0.5 (6.6) 0.7 (124.4)<br />
–––––––––––––––––––––––––––––––––––––––––––––––––––––—————––––––––––––––———<br />
Profit for the year 216.2 59.1 55.0 27.5 6.4 364.2<br />
–––––––––––––––––––––––––––––––––––––––––––––––––––––—————––––––––––––––———<br />
Balance sheet<br />
Segment assets – Investments in joint ventures<br />
and associates 417.1 142.9 454.8 33.6 1.7 1,050.1<br />
– Other 2,131.1 462.8 178.1 276.6 46.0 3,094.6<br />
–––––––––––––––––––––––––––––––––––––––––––––––––––––—————––––––––––––––———<br />
2,548.2 605.7 632.9 310.2 47.7 4,144.7<br />
Segment liabilities (782.4) (155.4) (65.0) (82.5) (10.3) (1,095.6)<br />
Segment net tax liabilities (371.3) (83.0) (9.7) (14.8) (3.5) (482.3)<br />
–––––––––––––––––––––––––––––––––––––––––––––––––––––—————––––––––––––––———<br />
Net assets 1,394.5 367.3 558.2 212.9 33.9 2,566.8<br />
–––––––––––––––––––––––––––––––––––––––––––––––––––––—————––––––––––––––———<br />
Capital expenditure 103.0 139.4 – 14.8 – 257.2<br />
–––––––––––––––––––––––––––––––––––––––––––––––––––––—————––––––––––––––———<br />
Depreciation and amortisation of segment assets 2.0 0.1 – 0.1 0.7 2.9<br />
–––––––––––––––––––––––––––––––––––––––––––––––––––––—————––––––––––––––———<br />
* <strong>The</strong> business is organised across five Operating Companies, four of which are geographical regions. <strong>Grosvenor</strong> Fund Management operates across all<br />
regions and is therefore presented separately.<br />
75
NOTES TO THE FINANCIAL STATEMENTS<br />
3. SEGMENTAL ANALYSIS (CONTINUED)<br />
BUSINESS SEGMENTS<br />
Fund and<br />
Property Property Joint Venture<br />
Investment Development Management Unallocated Consolidated<br />
£m £m £m £m £m<br />
–––––––––––––––––––––––––––––––––––––––––––—————––––––––––––––———<br />
Income from external customers 117.9 208.3 26.6 – 352.8<br />
–––––––––––––––––––––––––––––––––––––––––––—————––––––––––––––———<br />
Profit/(loss) for the period 551.6 (115.4) 9.9 (81.9) 364.2<br />
–––––––––––––––––––––––––––––––––––––––––––—————––––––––––––––———<br />
Segment assets 3,292.5 397.4 68.9 385.9 4,144.7<br />
–––––––––––––––––––––––––––––––––––––––––––—————––––––––––––––———<br />
Capital expenditure 215.1 42.1 – – 257.2<br />
–––––––––––––––––––––––––––––––––––––––––––—————––––––––––––––———<br />
2005 Australia<br />
Britain & Continental Asia Fund<br />
Ireland Americas Europe Pacific Management Consolidated<br />
GEOGRAPHICAL SEGMENTS £m £m £m £m £m £m<br />
–––––––––––––––––––––––––––––––––––––––––––––––––––––—————––––––––––––––———<br />
Income statement<br />
Income from external customers<br />
Rental income 66.0 16.7 – 14.1 – 96.8<br />
Income from trading and<br />
development properties 245.6 13.9 – – – 259.5<br />
Service charge income 5.0 – – – – 5.0<br />
Other income 10.7 9.7 1.0 0.9 7.6 29.9<br />
–––––––––––––––––––––––––––––––––––––––––––––––––––––—————––––––––––––––———<br />
Total revenue 327.3 40.3 1.0 15.0 7.6 391.2<br />
–––––––––––––––––––––––––––––––––––––––––––––––––––––—————––––––––––––––———<br />
Net rental and other income less administrative<br />
expenses 16.3 8.2 (1.3) 7.1 (2.8) 27.5<br />
(Losses)/gains from trading and development<br />
properties (10.4) 3.9 – (0.8) – (7.3)<br />
Net gains on revaluation and sale of investment<br />
property 208.4 23.7 – 14.7 – 246.8<br />
Impairment of goodwill – – (3.3) – – (3.3)<br />
Share of profit from joint ventures 44.1 32.4 41.0 3.9 0.2 121.6<br />
Net financing costs (18.8) 0.5 2.8 (1.9) 0.2 (17.2)<br />
–––––––––––––––––––––––––––––––––––––––––––––––––––––—————––––––––––––––———<br />
Profit/(loss) before tax 239.6 68.7 39.2 23.0 (2.4) 368.1<br />
Current tax 0.9 (4.5) (0.4) (4.5) – (8.5)<br />
Deferred tax (78.0) (15.1) (0.5) (0.7) (0.2) (94.5)<br />
–––––––––––––––––––––––––––––––––––––––––––––––––––––—————––––––––––––––———<br />
Profit/(loss) for the year 162.5 49.1 38.3 17.8 (2.6) 265.1<br />
–––––––––––––––––––––––––––––––––––––––––––––––––––––—————––––––––––––––———<br />
Balance sheet<br />
Segment assets – Investments in joint ventures 327.7 197.6 270.0 22.7 1.4 819.4<br />
– Other 1,844.7 352.5 133.8 260.0 20.6 2,611.6<br />
–––––––––––––––––––––––––––––––––––––––––––––––––––––—————––––––––––––––———<br />
2,172.4 550.1 403.8 282.7 22.0 3,431.0<br />
Segment liabilities (649.5) (115.4) (38.5) (61.5) (19.0) (883.9)<br />
Segment net tax liabilities (270.3) (68.4) (10.3) (11.3) (0.3) (360.6)<br />
–––––––––––––––––––––––––––––––––––––––––––––––––––––—————––––––––––––––———<br />
Net assets 1,252.6 366.3 355.0 209.9 2.7 2,186.5<br />
–––––––––––––––––––––––––––––––––––––––––––––––––––––—————––––––––––––––———<br />
Capital expenditure 30.3 54.0 32.1 12.4 – 128.8<br />
–––––––––––––––––––––––––––––––––––––––––––––––––––––—————––––––––––––––———<br />
Depreciation and amortisation of segment assets 1.4 0.1 0.1 0.1 – 1.7<br />
–––––––––––––––––––––––––––––––––––––––––––––––––––––—————––––––––––––––———<br />
76
NOTES TO THE FINANCIAL STATEMENTS<br />
3. SEGMENTAL ANALYSIS (CONTINUED)<br />
2005<br />
BUSINESS SEGMENTS<br />
Fund and<br />
Property Property Joint Venture<br />
Investment Development Management Unallocated Consolidated<br />
£m £m £m £m £m<br />
–––––––––––––––––––––––––––––––––––––––––––—————––––––––––––––———<br />
Income from external customers 106.6 271.8 12.8 – 391.2<br />
–––––––––––––––––––––––––––––––––––––––––––—————––––––––––––––———<br />
Profit/(loss) for the period 373.6 25.9 0.2 (134.6) 265.1<br />
–––––––––––––––––––––––––––––––––––––––––––—————––––––––––––––———<br />
Segment assets 2,834.8 260.3 34.6 301.3 3,431.0<br />
–––––––––––––––––––––––––––––––––––––––––––—————––––––––––––––———<br />
Capital expenditure 98.0 30.8 – – 128.8<br />
–––––––––––––––––––––––––––––––––––––––––––—————––––––––––––––———<br />
4. REVENUE (LOSS)/PROFIT<br />
2006 2005<br />
Group Share Total Group Share Total<br />
of joint<br />
of joint<br />
ventures and<br />
ventures and<br />
associates<br />
associates<br />
£m £m £m £m £m £m<br />
–––––––––––––––––––––––––––––––––––––––––––––––––––––––—————––––––––––––––———<br />
Gross rental income 106.8 113.5 220.3 96.8 93.0 189.8<br />
Property outgoings<br />
(excluding major refurbishments) (35.5) (29.8) (65.3) (38.9) (23.0) (61.9)<br />
–––––––––––––––––––––––––––––––––––––––––––––––––––––––—————––––––––––––––———<br />
Net rental income<br />
(before major refurbishments) 71.3 83.7 155.0 57.9 70.0 127.9<br />
Fees and other income 52.9 17.7 70.6 29.9 11.4 41.3<br />
(Loss)/profit on trading and development<br />
properties (176.6) (4.0) (180.6) (7.3) 7.1 (0.2)<br />
Administrative expenses (75.8) (28.3) (104.1) (53.3) (23.9) (77.2)<br />
Net financing costs<br />
(excluding fair value adjustments) (21.8) (27.0) (48.8) (20.1) (25.1) (45.2)<br />
–––––––––––––––––––––––––––––––––––––––––––––––––––––––—————––––––––––––––———<br />
Revenue (loss)/profit (150.0) 42.1 (107.9) 7.1 39.5 46.6<br />
–––––––––––––––––––––––––––––––––––––––––––––––––––––––—————––––––––––––––———<br />
Development loss provision 169.9 – 169.9 10.0 – 10.0<br />
–––––––––––––––––––––––––––––––––––––––––––––––––––––––—————––––––––––––––———<br />
Revenue profit excluding development<br />
loss provision 19.9 42.1 62.0 17.1 39.5 56.6<br />
–––––––––––––––––––––––––––––––––––––––––––––––––––––––—————––––––––––––––———<br />
5. GROSS RENTAL INCOME<br />
2006 2005<br />
£m £m<br />
–––——————–––––––––———<br />
Gross lease payments collected/accrued 104.1 92.1<br />
Amortisation of capitalised lease incentives 0.8 3.0<br />
Amortisation of deferred lease premiums 1.9 1.7<br />
–––——————–––––––––———<br />
106.8 96.8<br />
–––——————–––––––––———<br />
Investment properties are leased out under operating leases. <strong>The</strong> majority of operating lease terms fall in the range between 6 months and 20 years.<br />
Certain investment properties on the London Estate are leased out on longer term ground rent based leases for periods of up to 947 years.<br />
Total contingent rents included in gross rental income amounted to £0.2m (2005 – £0.1m).<br />
77
NOTES TO THE FINANCIAL STATEMENTS<br />
6. PROPERTY OUTGOINGS<br />
2006 2005<br />
£m £m<br />
–––——————–––––––––———<br />
Service charge income 7.9 5.0<br />
Service charge expenses (8.5) (5.0)<br />
–––——————–––––––––———<br />
Net service charge income (0.6) –<br />
Other property operating expenses (41.0) (45.9)<br />
–––——————–––––––––———<br />
Total net property outgoings (41.6) (45.9)<br />
–––——————–––––––––———<br />
Included within property operating expenses are major refurbishment costs of £6.1m (2005 – £7.0m).<br />
7. OTHER INCOME<br />
2006 2005<br />
£m £m<br />
–––——————–––––––––———<br />
Fund management and asset management fees 32.8 12.8<br />
Project management fees 11.3 10.2<br />
Other income 8.8 6.9<br />
–––——————–––––––––———<br />
52.9 29.9<br />
–––——————–––––––––———<br />
8. ADMINISTRATIVE EXPENSES<br />
2006 2005<br />
£m £m<br />
–––——————–––––––––———<br />
Staff costs 51.1 35.6<br />
Office costs 10.9 9.5<br />
Auditors remuneration – audit services 0.8 0.7<br />
– other services 0.1 0.2<br />
Other professional fees 8.1 4.6<br />
Other administrative expenses 4.8 2.7<br />
–––——————–––––––––———<br />
75.8 53.3<br />
–––——————–––––––––———<br />
All of the Group’s Operating Companies were audited by Deloitte. £0.5m of the total audit fee is estimated to relate to the audit of the Group and £0.3m<br />
to the audit of the Group’s subsidiaries.<strong>The</strong> Company's audit fees were borne by another Group Company. Amounts paid to other accountancy firms in<br />
2006 totalled £1.1m (2005 – £1.3m).<br />
78
NOTES TO THE FINANCIAL STATEMENTS<br />
9. EMPLOYEE INFORMATION<br />
2006 2005<br />
£m £m<br />
–––——————–––––––––———<br />
Staff costs<br />
Wages and salaries 46.7 36.5<br />
Social security contributions 4.0 3.4<br />
Other staff costs 9.0 3.6<br />
Pension costs<br />
Contributions to defined contribution plans 1.1 0.4<br />
Net cost of defined benefit plans 6.1 5.2<br />
–––——————–––––––––———<br />
66.9 49.1<br />
–––——————–––––––––———<br />
Included in:<br />
Administrative expenses 51.1 35.6<br />
Property operating expenses 6.7 5.5<br />
Development costs 9.1 8.0<br />
–––——————–––––––––———<br />
66.9 49.1<br />
–––——————–––––––––———<br />
Average number of employees by business 2006 2005<br />
–––——————–––––––––———<br />
Property investment 142 137<br />
Property development 98 79<br />
Fund management 83 31<br />
Management and administration 149 145<br />
Shopping centre and property management 29 32<br />
–––——————–––––––––———<br />
501 424<br />
–––——————–––––––––———<br />
Average number of employees by geographic region 2006 2005<br />
–––——————–––––––––———<br />
Britain & Ireland 325 301<br />
Continental Europe 28 22<br />
North America 97 64<br />
Australia Asia Pacific 51 37<br />
–––——————–––––––––———<br />
501 424<br />
–––——————–––––––––———<br />
<strong>The</strong> Group carries out its own property management for the majority of the portfolio in Britain & Ireland. <strong>The</strong> Company employs no staff (2005 – nil).<br />
10. RETIREMENT BENEFIT SCHEMES<br />
DEFINED BENEFIT SCHEMES<br />
<strong>The</strong> Group operates defined benefit pension schemes in Britain & Ireland, Australia, Canada and the USA.<strong>The</strong> schemes provide retirement benefits based<br />
upon pensionable salary and length of service.<strong>The</strong> Britain & Ireland scheme, which is open to all staff, provides a defined benefit pension up to an upper<br />
earnings limit; above this limit the Group contributes between 25% and 30% of that tranche of salary into a defined contribution scheme. Some members<br />
of the Britain & Ireland scheme accrue benefits on historical scales which pension full salary (subject to the earnings cap).<br />
<strong>The</strong> defined benefit schemes are funded and are administered by independent trustees. Independent qualified actuaries complete valuations of the<br />
schemes at least every three years and in accordance with their recommendations annual contributions are paid to the schemes so as to secure the<br />
benefits set out in the rules.<br />
79
NOTES TO THE FINANCIAL STATEMENTS<br />
10. RETIREMENT BENEFIT SCHEMES (CONTINUED)<br />
<strong>The</strong> Britain & Ireland scheme is a multi-employer scheme because it provides pensions for both the Group and employees of other entities owned by the<br />
shareholders.<strong>The</strong> Group accounts for its proportionate share of the defined benefit obligation, plan assets and cost of this scheme.<br />
Actuarial valuations were last carried out at the following dates:<br />
Britain & Ireland 31 December 2002<br />
Australia 31 December 2006<br />
Canada 31 December 2006<br />
USA 1 January 2006<br />
All the valuations have been updated to 31 December 2006 where appropriate.<strong>The</strong> results of these valuations together with the key assumptions used<br />
are set out below.<strong>The</strong> actuarial valuation of the Britain & Ireland scheme as at 31 December 2005 has been completed but is awaiting final sign off at the<br />
date of approving these accounts.<br />
In addition to the defined benefit schemes set out above, the Group operates unfunded defined benefit schemes in Britain & Ireland and the USA to<br />
satisfy pension commitments not catered for by the funded schemes.<br />
DEFINED CONTRIBUTION SCHEMES<br />
<strong>The</strong> Group operates a number of defined contribution retirement benefit schemes.<strong>The</strong> Group contributes a percentage of salary into defined contribution<br />
schemes to fund the benefits.<strong>The</strong> assets of the schemes are held separately from those of the Group in funds under the control of independent pension<br />
providers.<strong>The</strong> only obligation of the Group with respect to the defined contribution schemes is to make the specified contributions.<br />
<strong>The</strong> total cost of defined contribution pension schemes charged to the income statement was £1.1m (2005 – £0.4m).<br />
ANALYSIS OF DEFINED BENEFIT SCHEMES<br />
<strong>The</strong> key assumptions used in each scheme were:<br />
2006 2005<br />
–––——————–––––––––———<br />
Discount rate<br />
Britain & Ireland 5.1% 4.7%<br />
Canada 5.2% 5.0%<br />
USA 5.7% 5.5%<br />
Australia 5.0% 4.9%<br />
Expected return on scheme assets<br />
Britain & Ireland 7.2% 7.0%<br />
Canada 5.0% 5.2%<br />
USA 8.3% 8.5%<br />
Australia 6.5% 6.5%<br />
Expected rate of salary increases<br />
Britain & Ireland 6.3% 6.3%<br />
Canada 4.5% 4.5%<br />
USA 5.0% 5.0%<br />
Australia 4.5% 4.5%<br />
Expected rate of future pension increases<br />
Britain & Ireland 2.9% 2.9%<br />
Canada 3.0% 2.5%<br />
USA 3.0% 3.0%<br />
Australia 1.9% 3.0%<br />
Inflation<br />
Britain & Ireland 2.9% 2.9%<br />
Canada 3.0% 3.0%<br />
USA 3.0% 3.0%<br />
Australia 2.5% 3.0%<br />
–––——————–––––––––———<br />
80
NOTES TO THE FINANCIAL STATEMENTS<br />
10. RETIREMENT BENEFIT SCHEMES (CONTINUED)<br />
<strong>The</strong> amounts recognised in income in respect of defined benefit schemes were:<br />
2006 2005<br />
£m £m<br />
–––——————–––––––––———<br />
Current service cost 6.2 5.4<br />
Past service cost 0.3 –<br />
Interest cost 5.9 5.2<br />
Expected return on scheme assets (6.3) (5.4)<br />
–––——————–––––––––———<br />
6.1 5.2<br />
–––——————–––––––––———<br />
<strong>The</strong> amount included in the balance sheet arising from the Group’s obligations in respect of defined benefit schemes is as follows:<br />
2006 2005<br />
£m £m<br />
–––——————–––––––––———<br />
Present value of unfunded obligations 9.7 10.5<br />
Present value of funded obligations 101.4 113.6<br />
–––——————–––––––––———<br />
Present value of total defined benefit obligations 111.1 124.1<br />
Fair value of scheme assets (95.3) (96.3)<br />
–––——————–––––––––———<br />
Defined benefit pension deficit 15.8 27.8<br />
–––——————–––––––––———<br />
<strong>The</strong> deficit arises in the following regions:<br />
Britain & Ireland 5.9 17.8<br />
Canada 1.6 1.6<br />
USA 7.3 7.1<br />
Australia 1.0 1.3<br />
–––——————–––––––––———<br />
15.8 27.8<br />
–––——————–––––––––———<br />
This amount is included in the balance sheet under non-current liabilities.<br />
MOVEMENTS IN THE PRESENT VALUE OF DEFINED BENEFIT OBLIGATIONS WERE:<br />
2006 2005<br />
£m £m<br />
–––——————–––––––––———<br />
At 1 January 124.1 93.6<br />
Current service cost 6.2 5.4<br />
Past service cost 0.3 –<br />
Interest cost 5.9 5.2<br />
Actuarial (gains)/losses (5.5) 19.3<br />
Adjustment to the Group’s share of multi employer schemes (10.3) –<br />
Benefits paid (4.3) (3.3)<br />
Curtailment (0.6) –<br />
Settlement (0.7) –<br />
Exchange movements (4.0) 3.9<br />
–––——————–––––––––———<br />
At 31 December 111.1 124.1<br />
–––——————–––––––––———<br />
81
NOTES TO THE FINANCIAL STATEMENTS<br />
10. RETIREMENT BENEFIT SCHEMES (CONTINUED)<br />
MOVEMENTS IN FAIR VALUE OF SCHEME ASSETS WERE:<br />
2006 2005<br />
£m £m<br />
–––——————–––––––––———<br />
At 1 January 96.3 76.5<br />
Expected return on plan assets 6.3 5.4<br />
Actuarial gains 4.9 8.0<br />
Adjustment to the Group’s share of multi employer schemes (10.1) –<br />
Contributions by the employer 5.3 6.8<br />
Benefits paid (4.3) (3.3)<br />
Exchange movements (3.1) 2.9<br />
–––——————–––––––––———<br />
At 31 December 95.3 96.3<br />
–––——————–––––––––———<br />
Analysis of the scheme assets and the expected rates of return:<br />
2006<br />
Equities Bonds Other Total<br />
% £m % £m % £m £m<br />
————————————–——————–——————–——————––——————–––––––––———<br />
Britain & Ireland 7.5 63.5 4.5 6.8 4.5 0.9 71.2<br />
Canada 8.2 7.7 4.5 4.0 3.3 3.7 15.4<br />
USA 9.7 4.8 6.0 2.0 4.2 0.3 7.1<br />
Australia 10.7 0.9<br />
——————–—<br />
6.2 0.4<br />
——————–—<br />
5.6 0.3 1.6<br />
——————–——————–———<br />
76.9 13.2 5.2 95.3<br />
——————–— ——————–— ——————–——————–———<br />
2005<br />
Equities Bonds Other Total<br />
% £m % £m % £m £m<br />
————————————–——————–——————–——————––——————–––––––––———<br />
Britain & Ireland 7.3 63.1 4.0 6.9 4.0 1.0 71.0<br />
Canada 8.1 8.0 4.8 4.5 0.3 4.3 16.8<br />
USA 10.5 4.5 5.3 2.1 4.0 0.5 7.1<br />
Australia 8.0 0.7<br />
——————–—<br />
5.0 0.3<br />
——————–—<br />
5.2 0.4 1.4<br />
——————–——————–———<br />
76.3 13.8 6.2 96.3<br />
——————–— ——————–— ——————–——————–———<br />
<strong>The</strong> history of experience gains and losses is as follows:<br />
2006 2005 2004 2003 2002<br />
£m £m £m £m £m<br />
–––––––––––––––––––––––––––––––––––––––––––––––——————–––––––––———<br />
Present value of defined benefit obligation 111.1 124.1 93.6 77.0 66.6<br />
Fair value of scheme assets (95.3) (96.3) (76.5) (66.5) (51.9)<br />
–––––––––––––––––––––––––––––––––––––––––––––––——————–––––––––———<br />
Deficit in the scheme 15.8 27.8 17.1 10.5 14.7<br />
–––––––––––––––––––––––––––––––––––––––––––––––——————–––––––––———<br />
Experience adjustments on plan assets:<br />
Amount of gain/(loss) 4.9 8.0 3.3 5.6 (14.4)<br />
Percentage of plan assets 5.1% 8.3% 4.3% 8.5% (27.7)%<br />
Experience adjustments on plan liabilities<br />
Amount of (gain)/loss (5.5) 19.3 6.8 – 0.4<br />
Percentage of the present value of scheme liabilities 5.0% 15.6% 7.3% – 0.6%<br />
–––––––––––––––––––––––––––––––––––––––––––––––——————–––––––––———<br />
82
NOTES TO THE FINANCIAL STATEMENTS<br />
11. DIRECTORS’ REMUNERATION DETAILS<br />
2006 2005<br />
£000 £000<br />
–––——————–––––––––———<br />
Aggregate remuneration:<br />
Emoluments 2,285 2,120<br />
Performance-related bonus 929 860<br />
Long term incentive scheme 1,145 197<br />
Compensation to Director for loss of office 1,339 –<br />
–––——————–––––––––———<br />
5,698 3,177<br />
–––——————–––––––––———<br />
<strong>The</strong> total amounts payable under long term incentive schemes comprise all amounts to which Directors became unconditionally entitled during the year.<br />
In previous years the Company has disclosed the amounts accrued in the year, including amounts not vested. <strong>The</strong> Directors believe that the new<br />
presentation more fairly meets the requirements of the Companies Act 1985.<strong>The</strong> comparative amounts have been amended accordingly.<br />
<strong>The</strong> amounts above include for the highest paid Director emoluments of £505,000 (2005 – £455,000), performance related bonus of £199,000<br />
(2005 – £193,000) and long term incentive plans of £262,000 (2005 – £nil).<br />
Retirement benefits are accruing to six Directors under defined benefit schemes sponsored by Group companies, one of whom is a member of a<br />
scheme which combines defined benefit and money purchase benefits. <strong>The</strong> total annual accrued pension under the defined benefit pension schemes was<br />
£472,000 (2005 – £630,000) and for the highest paid Director was £201,000 (2005 – £186,000). Total contributions in respect of money purchase<br />
pension benefits were £35,000 (2005 – £nil) and for the highest paid Director were £nil (2005 – £nil).<br />
12. LOSS ON TRADING AND DEVELOPMENT PROPERTIES<br />
2006 2005<br />
£m £m<br />
–––——————–––––––––———<br />
Development income 160.3 229.7<br />
Development costs (342.5) (239.7)<br />
Proceeds from sale of trading properties 24.8 29.8<br />
Carrying value of trading properties sold (17.8) (26.3)<br />
Provision for impairment of trading properties (1.4) (0.8)<br />
–––——————–––––––––———<br />
(176.6) (7.3)<br />
–––——————–––––––––———<br />
<strong>The</strong> carrying value of trading properties sold includes £0.6m of capitalised interest (2005 – £0.4m).<br />
13. GAINS ON OTHER INVESTMENTS<br />
2006 2005<br />
£m £m<br />
–––——————–––––––––———<br />
Profit on disposal of trade investments 0.3 0.1<br />
Amounts written off investment properties held for development – (0.1)<br />
–––——————–––––––––———<br />
0.3 –<br />
–––——————–––––––––———<br />
83
NOTES TO THE FINANCIAL STATEMENTS<br />
14. NET GAINS ON REVALUATION AND SALE OF INVESTMENT PROPERTY<br />
2006 2005<br />
£m £m<br />
–––——————–––––––––———<br />
Valuation gains on investment property 407.1 233.1<br />
Valuation losses on investment property (4.7) (1.7)<br />
Valuation gains on redevelopment properties 7.1 –<br />
–––——————–––––––––———<br />
Net valuation gains on investment property 409.5 231.4<br />
Profit on disposal of investment property 109.2 15.4<br />
–––——————–––––––––———<br />
518.7 246.8<br />
–––——————–––––––––———<br />
15. NET FINANCING COSTS<br />
2006 2005<br />
£m £m<br />
–––——————–––––––––———<br />
Dividend income 1.1 0.3<br />
–––——————–––––––––———<br />
Interest income 12.7 14.9<br />
Other financial income 5.6 3.6<br />
Fair value adjustments of interest rate swaps 1.0 2.9<br />
–––——————–––––––––———<br />
Financial income 19.3 21.4<br />
–––——————–––––––––———<br />
Gross interest expense (43.2) (42.2)<br />
Interest capitalised 2.6 3.7<br />
Commitment and other financing costs (0.6) (0.4)<br />
–––——————–––––––––———<br />
Financial expenses (41.2) (38.9)<br />
–––——————–––––––––———<br />
Net financing costs (20.8) (17.2)<br />
–––——————–––––––––———<br />
<strong>The</strong> average rate of interest capitalised in the year was 6.3% (2005 – 6.3%).<br />
16. INCOME TAX EXPENSE<br />
RECOGNISED IN THE INCOME STATEMENT 2006 2005<br />
£m £m<br />
–––——————–––––––––———<br />
Current tax expense<br />
UK corporation tax at 30% (2005 – 30%) 2.0 24.9<br />
Overseas tax 10.7 9.3<br />
Adjustment for prior years 7.4 (25.7)<br />
–––——————–––––––––———<br />
20.1 8.5<br />
–––——————–––––––––———<br />
Deferred tax expense<br />
Origination and reversal of temporary differences 125.3 94.7<br />
Reduction in tax rate (0.2) (0.2)<br />
Benefit of tax losses recognised (0.7) –<br />
–––——————–––––––––———<br />
124.4 94.5<br />
–––——————–––––––––———<br />
Total income tax expense 144.5 103.0<br />
–––——————–––––––––———<br />
–––——————–––––––––———<br />
84
NOTES TO THE FINANCIAL STATEMENTS<br />
16. INCOME TAX EXPENSE (CONTINUED)<br />
DEFERRED TAX RECOGNISED DIRECTLY IN EQUITY<br />
2006 2005<br />
Note £m £m<br />
–––––––––––––––——————–––––––––———<br />
Recognised in equity – Group 26 20.2 (0.8)<br />
Recognised in equity – joint ventures 4.8 –<br />
–––––––––––––––——————–––––––––———<br />
Total recognised in equity 25.0 (0.8)<br />
–––––––––––––––——————–––––––––———<br />
Reconciliation of effective tax rate<br />
Profit on ordinary activities before taxation 508.7 368.1<br />
Less: share of profit of joint ventures and associates (145.0) (121.6)<br />
Add: profit of joint ventures where the tax charge is directly attributable to the Group 59.5 75.1<br />
–––––––––––––––——————–––––––––———<br />
Adjusted group profit on ordinary activities before taxation 423.2 321.6<br />
–––––––––––––––——————–––––––––———<br />
Tax on adjusted group profit at standard UK corporation tax rate of 30% (2005 – 30%) 127.0 96.5<br />
Higher tax rates on overseas earnings 6.0 4.7<br />
Expenses not deductible for tax purposes 7.4 1.7<br />
Other items attracting no tax relief or liability (23.0) (2.3)<br />
Other timing differences (0.2) (0.2)<br />
Adjustments in respect of prior years 27.3 2.6<br />
–––––––––––––––——————–––––––––———<br />
Total income tax expense 144.5 103.0<br />
–––––––––––––––——————–––––––––———<br />
Effective tax rate based on adjusted Group profit 34.1% 32.0%<br />
–––––––––––––––——————–––––––––———<br />
17. PROPERTY ASSETS<br />
2006 2005<br />
Note £m £m<br />
–––––––––––––––——————–––––––––———<br />
Investment property – Group 18 2,264.4 1,936.0<br />
– Share of joint ventures 22 1,658.3 1,390.8<br />
Investment property under development – Group 19 85.6 71.4<br />
– Share of joint ventures 22 242.9 107.3<br />
– Share of associates 23 115.4 51.5<br />
Other financial assets – Group 24 56.5 68.0<br />
Trading properties – Group 27 48.7 34.5<br />
– Share of joint ventures 22 120.6 68.2<br />
–––––––––––––––——————–––––––––———<br />
Total property assets 4,592.4 3,727.7<br />
–––––––––––––––——————–––––––––———<br />
85
NOTES TO THE FINANCIAL STATEMENTS<br />
18. INVESTMENT PROPERTY<br />
Completed property<br />
Redevelopment projects<br />
––––––—————––––––––––––––——— –––––––––—————––––––––––––––———<br />
Freehold Leasehold Total Freehold Leasehold Total Total<br />
£m £m £m £m £m £m £m<br />
–––––––––––––––––––––––––––––––––––––––––––––––––––––––––––––––––—————––––––––––––––———<br />
At 1 January 2005 1,352.3 389.9 1,742.2 14.1 – 14.1 1,756.3<br />
Acquisitions 67.4 2.4 69.8 – – – 69.8<br />
Costs capitalised 2.8 2.1 4.9 6.8 0.1 6.9 11.8<br />
Disposals (174.4) (20.8) (195.2) – – – (195.2)<br />
Revaluation gains 183.9 47.5 231.4 – – – 231.4<br />
Release of deferred costs – 0.1 0.1 – – – 0.1<br />
Transfer to/(from) redevelopment<br />
projects 20.9 (6.8) 14.1 (20.9) 6.8 (14.1) –<br />
Transfer from investment properties<br />
under development 19.3 2.2 21.5 – – – 21.5<br />
Transfer from trading properties 3.1 – 3.1 – – – 3.1<br />
Exchange movements 36.3 0.9 37.2 – – – 37.2<br />
–––––––––––––––––––––––––––––––––––––––––––––––––––––––––––––––––—————––––––––––––––———<br />
At 31 December 2005 1,511.6 417.5 1,929.1 – 6.9 6.9 1,936.0<br />
Acquisitions 97.4 90.1 187.5 – – – 187.5<br />
Costs capitalised 0.8 4.1 4.9 1.1 – 1.1 6.0<br />
Disposals (80.5) (228.9) (309.4) – – – (309.4)<br />
Sale of freeholds (955.2) 950.2 (5.0) – – – (5.0)<br />
Revaluation gains/(losses) 91.8 310.6 402.4 (1.0) 8.1 7.1 409.5<br />
Release of deferred costs (0.6) 3.7 3.1 – – – 3.1<br />
Depreciation of short<br />
leasehold properties – (0.2) (0.2) – – – (0.2)<br />
Transfer (from)/to redevelopment<br />
projects (11.8) 15.0 3.2 11.8 (15.0) (3.2) –<br />
Transfer from investment properties<br />
under development 4.9 17.0 21.9 – – – 21.9<br />
Transfer to trading properties (3.2) – (3.2) – – – (3.2)<br />
Transfer from joint ventures 65.5 – 65.5 – – – 65.5<br />
Exchange movements (45.7) (0.7) (46.4) (0.9) – (0.9) (47.3)<br />
–––––––––––––––––––––––––––––––––––––––––––––––––––––––––––––––––—————––––––––––––––———<br />
At 31 December 2006 675.0 1,578.4 2,253.4 11.0 – 11.0 2,264.4<br />
–––––––––––––––––––––––––––––––––––––––––––––––––––––––––––––––––—————––––––––––––––———<br />
Investment properties were valued at 31 December 2006 by external valuers on the basis of open market value in accordance with the Appraisal and<br />
Valuation Manual of the Royal Institution of Chartered Surveyors.Valuations were performed as follows:<br />
£m<br />
–––––––––––––––––––––––––––––––––––––––––––––––––––––––––––––––––—————––––––––––––––———<br />
Britain & Ireland Freehold CB Richard Ellis, Chartered Surveyors 141.1<br />
Long Leasehold CB Richard Ellis, Chartered Surveyors 1,578.3<br />
Americas Freehold Cushman & Wakefield Le Page, Chartered Surveyors 323.2<br />
Continental Europe Freehold Cushman & Wakefield, Chartered Surveyors 31.2<br />
Australia Asia Pacific Freehold DTZ Australia, Chartered Surveyors 99.9<br />
Freehold CB Richard Ellis, Chartered Surveyors 76.4<br />
Freehold LandMark White, Chartered Surveyors 2.8<br />
Freehold Tanizawa SOGO Appraisal Co Ltd 11.5<br />
–––––––––––––––––––––––––––––––––––––––––––––––––––––––––––––––––—————––––––––––––––———<br />
2,264.4<br />
–––––––––––––––––––––––––––––––––––––––––––––––––––––––––––––––––—————––––––––––––––———<br />
<strong>The</strong> historical cost of the Group's investment properties was £946.5m (2005 – £1,008.8m).<br />
At 31 December 2006, investment properties with a carrying amount of £1,038.0m were pledged as security for bank loans (2005 – £882.5m).<br />
86
NOTES TO THE FINANCIAL STATEMENTS<br />
19. INVESTMENT PROPERTY UNDER DEVELOPMENT<br />
Freehold Leasehold Total<br />
£m £m £m<br />
––––––––––––––––––——————–––––––––———<br />
At 1 January 2005 49.8 3.0 52.8<br />
Acquisitions 20.0 4.8 24.8<br />
Costs capitalised 4.5 – 4.5<br />
Disposals (0.4) – (0.4)<br />
Revaluation gains 10.2 1.2 11.4<br />
Transfer to investment properties (19.3) (2.2) (21.5)<br />
Transfer to trading properties (3.3) – (3.3)<br />
Exchange movements 3.1 – 3.1<br />
––––––––––––––––––——————–––––––––———<br />
At 31 December 2005 64.6 6.8 71.4<br />
Acquisitions 12.4 1.6 14.0<br />
Costs capitalised 1.4 7.1 8.5<br />
Revaluation gains 6.5 12.5 19.0<br />
Transfer to investment properties (4.9) (17.0) (21.9)<br />
Exchange movements (5.4) – (5.4)<br />
––––––––––––––––––——————–––––––––———<br />
At 31 December 2006 74.6 11.0 85.6<br />
––––––––––––––––––——————–––––––––———<br />
Investment properties under development were valued at 31 December 2006 by external valuers on the basis of open market value in accordance with the<br />
Appraisal and Valuation Manual of the Royal Institution of Chartered Surveyors.Valuations were performed as follows:<br />
£m<br />
–––––––––––––––––––––––––––––––––––––––––––––––––––––––––––––––––—————––––––––––––––———<br />
Britain & Ireland Freehold CB Richard Ellis, Chartered Surveyors 28.3<br />
Long Leasehold CB Richard Ellis, Chartered Surveyors 20.7<br />
Americas Freehold Cushman & Wakefield Le Page, Chartered Surveyors 36.6<br />
–––––––––––––––––––––––––––––––––––––––––––––––––––––––––––––––––—————––––––––––––––———<br />
85.6<br />
–––––––––––––––––––––––––––––––––––––––––––––––––––––––––––––––––—————––––––––––––––———<br />
<strong>The</strong> historical cost of the Group’s investment property under development was £59.2m (2005 – £64.1m).<br />
At 31 December 2006, investment property under development with a carrying amount of £25.5m was pledged as security for bank loans (2005 – £nil).<br />
<strong>The</strong> carrying value of investment property under development includes capitalised interest of £1.5m (2005 – £0.5m).<br />
87
NOTES TO THE FINANCIAL STATEMENTS<br />
20. OTHER PROPERTY, PLANT AND EQUIPMENT<br />
2006 Fixtures,<br />
Computer fittings<br />
Land and Leasehold and IT and motor<br />
buildings improvements equipment vehicles Total<br />
£m £m £m £m £m<br />
––––––––––––––––––––––––––––––––––––––––—————––––––––––––––———<br />
Cost<br />
At 1 January 2006 29.1 5.1 4.1 3.9 42.2<br />
Additions 0.1 0.6 1.0 0.9 2.6<br />
Disposals – (0.1) (0.1) (0.2) (0.4)<br />
Revaluation gains 8.7 – – – 8.7<br />
Exchange movements – – – (0.1) (0.1)<br />
––––––––––––––––––––––––––––––––––––––––—————––––––––––––––———<br />
At 31 December 2006 37.9 5.6 5.0 4.5 53.0<br />
––––––––––––––––––––––––––––––––––––––––—————––––––––––––––———<br />
Depreciation<br />
At 1 January 2006 (0.1) (3.7) (2.3) (2.3) (8.4)<br />
Depreciation charge for the year – (0.7) (0.9) (0.5) (2.1)<br />
Disposals – 0.1 – 0.3 0.4<br />
Exchange movements – 0.1 – 0.1 0.2<br />
––––––––––––––––––––––––––––––––––––––––—————––––––––––––––———<br />
At 31 December 2006 (0.1) (4.2) (3.2) (2.4) (9.9)<br />
––––––––––––––––––––––––––––––––––––––––—————––––––––––––––———<br />
Carrying amount<br />
At 1 January 2006 29.0 1.4 1.8 1.6 33.8<br />
––––––––––––––––––––––––––––––––––––––––—————––––––––––––––———<br />
At 31 December 2006 37.8 1.4 1.8 2.1 43.1<br />
––––––––––––––––––––––––––––––––––––––––—————––––––––––––––———<br />
2005 Fixtures,<br />
Computer fittings<br />
Land and Leasehold and IT and motor<br />
buildings improvements equipment vehicles Total<br />
£m £m £m £m £m<br />
––––––––––––––––––––––––––––––––––––––––—————––––––––––––––———<br />
Cost<br />
At 1 January 2005 23.4 5.0 3.4 3.7 35.5<br />
Additions – – 0.7 0.2 0.9<br />
Disposals (0.1) – – (0.1) (0.2)<br />
Revaluation gains 5.8 – – – 5.8<br />
Exchange movements – 0.1 – 0.1 0.2<br />
––––––––––––––––––––––––––––––––––––––––—————––––––––––––––———<br />
At 31 December 2005 29.1 5.1 4.1 3.9 42.2<br />
––––––––––––––––––––––––––––––––––––––––—————––––––––––––––———<br />
Depreciation<br />
At 1 January 2005 (0.2) (3.0) (1.7) (1.8) (6.7)<br />
Depreciation charge for the year – (0.7) (0.6) (0.4) (1.7)<br />
Disposals 0.1 – – – 0.1<br />
Exchange movements – – – (0.1) (0.1)<br />
––––––––––––––––––––––––––––––––––––––––—————––––––––––––––———<br />
At 31 December 2005 (0.1) (3.7) (2.3) (2.3) (8.4)<br />
––––––––––––––––––––––––––––––––––––––––—————––––––––––––––———<br />
Carrying amount<br />
At 1 January 2005 23.2 2.0 1.7 1.9 28.8<br />
––––––––––––––––––––––––––––––––––––––––—————––––––––––––––———<br />
At 31 December 2005 29.0 1.4 1.8 1.6 33.8<br />
––––––––––––––––––––––––––––––––––––––––—————––––––––––––––———<br />
Land and buildings are freehold and were valued at 31 December 2006 by CB Richard Ellis, Chartered Surveyors, on the basis of open market value for<br />
existing use in accordance with the Appraisal and Valuation Manual of the Royal Institution of Chartered Surveyors.<br />
<strong>The</strong> historical cost of the Group’s revalued land and buildings above at 31 December 2006 was £14.4m (2005 – £14.4m).<br />
<strong>The</strong> carrying value of freehold land and buildings above includes capitalised interest of £0.1m (2005 – £0.1m).<br />
At 31 December 2006, land and buildings with a carrying value of £37.1m were pledged as security for bank loans (2005 – £28.6m).<br />
88
NOTES TO THE FINANCIAL STATEMENTS<br />
21. INVESTMENTS IN SUBSIDIARIES<br />
Shares<br />
at cost<br />
Company £m<br />
—–––––––––———<br />
At 1 January 2006 1,363.9<br />
Disposals (5.5)<br />
—–––––––––———<br />
At 31 December 2006 1,358.4<br />
—–––––––––———<br />
AT 31 DECEMBER 2006,THE GROUP HAD THE FOLLOWING PRINCIPAL INVESTMENTS IN SUBSIDIARIES:<br />
INTERMEDIATE HOLDING COMPANIES<br />
<strong>Grosvenor</strong> Estate Holdings*÷<br />
<strong>Grosvenor</strong> Limited (Great Britain)<br />
<strong>Grosvenor</strong> Americas Limited (Canada)<br />
<strong>Grosvenor</strong> Americas USA Inc. (USA)<br />
<strong>Grosvenor</strong> International SA (Luxembourg)π<br />
<strong>Grosvenor</strong> Continental Europe Holdings SA (Luxembourg)<br />
<strong>Grosvenor</strong> First European Property Investments SA (Luxembourg) †<br />
<strong>Grosvenor</strong> Australia Properties Pty Limited (Australia)<br />
<strong>Grosvenor</strong> Australia Investments Pty Limited (Australia)<br />
<strong>Grosvenor</strong> Asset Management Limited (Hong Kong)<br />
<strong>Grosvenor</strong> Fund Management Limited (Great Britain)<br />
PROPERTY INVESTMENT<br />
<strong>Grosvenor</strong> West End Properties*<br />
Eaton Square Properties Limited ÷<br />
<strong>Grosvenor</strong> (Basingstoke) Limited<br />
<strong>Grosvenor</strong> Commercial Properties*<br />
<strong>Grosvenor</strong> Properties*<br />
Old Broad Street Properties Limited<br />
<strong>Grosvenor</strong> Realty Investments Limited<br />
Cambridge Retail Investments Limited<br />
Liverpool Property Investments Limited<br />
PROPERTY DEVELOPMENT<br />
<strong>Grosvenor</strong> Developments Limited<br />
Liverpool PSDA Limited<br />
FUND MANAGEMENT<br />
<strong>Grosvenor</strong> Investment Management Limited (Great Britain)<br />
<strong>Grosvenor</strong> Investment Management US Inc. (USA)<br />
FINANCING<br />
<strong>Grosvenor</strong> UK Finance Plc<br />
* Unlimited company<br />
π Ordinary and non-voting preference shares are wholly owned. All of the floating rate guaranteed voting preferred redeemable shares, which carry<br />
approximately 36% of the total voting rights, are publicly held.<br />
÷ 100% of preference shares also owned<br />
† 67.5% owned<br />
All the above companies except <strong>Grosvenor</strong> Estate Holdings are indirectly owned. All companies are wholly owned and incorporated in Great Britain<br />
except where indicated. Except as disclosed above, all interests are in the form of ordinary shares.<br />
<strong>The</strong> above represents the Group’s material subsidiary undertakings. A full list of all subsidiary undertakings is available on request.<br />
89
NOTES TO THE FINANCIAL STATEMENTS<br />
22. INVESTMENTS IN JOINT VENTURES<br />
2006<br />
Australia<br />
Britain & Continental Asia<br />
Ireland Americas Europe Pacific Total<br />
£m £m £m £m £m<br />
––––––––––––––––––––––––––––––––––––––––—————––––––––––––––———<br />
Share of profit from joint ventures:<br />
Gross rental income 23.0 12.6 74.9 3.0 113.5<br />
––––––––––––––––––––––––––––––––––––––––—————––––––––––––––———<br />
Net rental and other income less administrative expenses 17.9 9.8 59.0 2.1 88.8<br />
Income from trading and development properties 2.8 (0.1) (6.7) – (4.0)<br />
Net gains on revaluation and sale of investment property 56.9 14.2 93.2 2.5 166.8<br />
Net financing costs (5.1) (3.4) (19.2) (0.6) (28.3)<br />
––––––––––––––––––––––––––––––––––––––––—————––––––––––––––———<br />
Profit before tax 72.5 20.5 126.3 4.0 223.3<br />
Current tax (5.1) – (6.6) 0.2 (11.5)<br />
Deferred tax – – (24.1) (0.8) (24.9)<br />
Minority interest – – (37.3) – (37.3)<br />
––––––––––––––––––––––––––––––––––––––––—————––––––––––––––———<br />
67.4 20.5 58.3 3.4 149.6<br />
––––––––––––––––––––––––––––––––––––––––—————––––––––––––––———<br />
Share of assets and liabilities:<br />
Non-current assets<br />
– Investment properties 425.5 186.6 1,001.5 44.7 1,658.3<br />
– Investment properties under development 29.5 11.2 202.2 – 242.9<br />
– Other – – 69.0 0.2 69.2<br />
Current assets<br />
– Trading properties 75.7 0.3 2.8 41.8 120.6<br />
– Other 33.6 4.5 178.4 7.0 223.5<br />
Non-current liabilities (142.8) (55.9) (848.6) (44.5) (1,091.8)<br />
Current liabilities (64.2) (3.8) (182.2) (15.6) (265.8)<br />
––––––––––––––––––––––––––––––––––––––––—————––––––––––––––———<br />
Net assets 357.3 142.9 423.1 33.6 956.9<br />
––––––––––––––––––––––––––––––––––––––––—————––––––––––––––———<br />
Goodwill – – 31.4 – 31.4<br />
––––––––––––––––––––––––––––––––––––––––—————––––––––––––––———<br />
357.3 142.9 454.5 33.6 988.3<br />
––––––––––––––––––––––––––––––––––––––––—————––––––––––––––———<br />
Borrowings included in liabilities<br />
(non-recourse to the Group) (142.8) (55.9) (538.0) (41.2) (777.9)<br />
––––––––––––––––––––––––––––––––––––––––—————––––––––––––––———<br />
90
NOTES TO THE FINANCIAL STATEMENTS<br />
22. INVESTMENTS IN JOINT VENTURES (CONTINUED)<br />
2005<br />
Australia<br />
Britain & Continental Asia<br />
Ireland Americas Europe Pacific Total<br />
£m £m £m £m £m<br />
––––––––––––––––––––––––––––––––––––––––—————––––––––––––––———<br />
Share of profit from joint ventures:<br />
Gross rental income 22.0 18.9 49.5 2.6 93.0<br />
––––––––––––––––––––––––––––––––––––––––—————––––––––––––––———<br />
Net rental and other income less administrative expenses 16.4 14.8 25.2 1.1 57.5<br />
Income from trading and development properties 4.6 0.4 2.1 – 7.1<br />
Net gains on revaluation and sale of investment property 32.9 22.0 61.6 4.1 120.6<br />
Net financing costs (7.5) (4.7) (12.2) (0.7) (25.1)<br />
––––––––––––––––––––––––––––––––––––––––—————––––––––––––––———<br />
Profit before tax 46.4 32.5 76.7 4.5 160.1<br />
Current tax (1.6) (0.1) (4.0) (0.2) (5.9)<br />
Deferred tax (0.5) – (15.6) (0.4) (16.5)<br />
Minority interest – – (16.1) – (16.1)<br />
––––––––––––––––––––––––––––––––––––––––—————––––––––––––––———<br />
44.3 32.4 41.0 3.9 121.6<br />
––––––––––––––––––––––––––––––––––––––––—————––––––––––––––———<br />
Share of assets and liabilities:<br />
Non-current assets<br />
– Investment properties 410.1 279.8 650.2 50.7 1,390.8<br />
– Investment properties under development – 8.6 98.7 – 107.3<br />
– Other – 0.1 32.6 0.2 32.9<br />
Current assets<br />
– Trading properties 56.1 – – 12.1 68.2<br />
– Other 36.1 3.5 128.6 9.6 177.8<br />
Non-current liabilities (157.4) (89.5) (532.1) (32.2) (811.2)<br />
Current liabilities (45.2) (4.9) (108.0) (17.7) (175.8)<br />
––––––––––––––––––––––––––––––––––––––––—————––––––––––––––———<br />
Net assets 299.7 197.6 270.0 22.7 790.0<br />
––––––––––––––––––––––––––––––––––––––––—————––––––––––––––———<br />
Borrowings included in liabilities (non-recourse to the Group) (157.4) (89.5) (362.0) (29.0) (637.9)<br />
––––––––––––––––––––––––––––––––––––––––—————––––––––––––––———<br />
91
NOTES TO THE FINANCIAL STATEMENTS<br />
22. INVESTMENTS IN JOINT VENTURES (CONTINUED)<br />
At 31 December 2006, the Group had the following principal interests in joint ventures which are accounted for on the basis explained in note 1:<br />
Group share<br />
Principal Country of Effective of net assets<br />
activities incorporation/registration interest £m<br />
––––––––––––––––––––––––––––––––––––––––––––––––––––––––––––—————––––––––––––––———<br />
Britain & Ireland<br />
<strong>Grosvenor</strong> Shopping Centre Fund Property investment England and Wales 23.4% 103.9<br />
<strong>Grosvenor</strong> London Office Fund Property investment England and Wales 26.7% 89.3<br />
<strong>Grosvenor</strong> Festival Place Fund Property investment England and Wales 24.5% 67.2<br />
Talbot Residential Fund Property investment England and Wales 50.0% 9.4<br />
<strong>Grosvenor</strong> Street Limited Partnership Property investment England and Wales 50.0% 46.6<br />
Barkhill Limited Property development Republic of Ireland 50.0% 18.0<br />
Americas<br />
Joint ventures with BBCAF Inc Property investment United States of America 50.0%/25.0% 118.8<br />
Joint ventures with the Getty Family Trust Property investment United States of America 50.0% 6.7<br />
GEMOA Inc Property investment United States of America 20.0% 11.0<br />
Art Hill Management Property investment United States of America 48.9% 6.4<br />
Continental Europe*<br />
Sonae Sierra SGPS SA Property investment and development Portugal 50.0% 431.4<br />
Joint ventures with Grupo Lar Property investment and development <strong>The</strong> Netherlands 50.0% 18.4<br />
Australia Asia Pacific<br />
YK Japan Residential Fund Property investment Japan 33.7%/ 18.8% 8.6<br />
TTRES Joint Venture Property investment Japan 50% 1.5<br />
<strong>Grosvenor</strong> Park Partners Limited Property development Japan 25% 4.1<br />
Fieldglen II Property investment Australia 50.0% 8.8<br />
––––––––––––––––––––––––––––––––––––––––––––––––––––––––––––—————––––––––––––––———<br />
* <strong>The</strong> investments in joint ventures in Continental Europe are held by <strong>Grosvenor</strong> First European Property Investments SA (GFEPI), which is 67.5%<br />
owned by the Group.<strong>The</strong> effective interest above is stated before taking account of the minority investors in GFEPI.<br />
<strong>The</strong> financial statements include, on an equity accounted basis, the results and financial position of the Group’s interests in the UK limited partnerships<br />
shown above. Accordingly advantage has been taken of the exemptions provided by Regulation 7 of the Partnerships and Unlimited Companies<br />
(<strong>Accounts</strong>) Regulations 1992 as amended by SI 2005 No. 1987 <strong>The</strong> Partnerships and Unlimited Companies (<strong>Accounts</strong>) (Amendment) Regulations<br />
2005, which dispenses with the requirement for those partnerships to file accounts with Companies House.<br />
92
NOTES TO THE FINANCIAL STATEMENTS<br />
23. ASSOCIATES<br />
2006 2005<br />
£m £m<br />
–––——————–––––––––———<br />
Share of profit from associates:<br />
Profit before tax 1.3 –<br />
Deferred tax (5.9) –<br />
–––——————–––––––––———<br />
Loss after tax (4.6) –<br />
–––——————–––––––––———<br />
Share of assets and liabilities:<br />
Investment properties under development 115.4 51.5<br />
Other assets 1.3 1.1<br />
Liabilities (54.9) (23.2)<br />
–––——————–––––––––———<br />
Net assets 61.8 29.4<br />
–––——————–––––––––———<br />
Borrowings included in liabilities (non-recourse to the Group) (48.7) (22.8)<br />
–––——————–––––––––———<br />
<strong>The</strong> investment in associates comprises the Group’s 19.6% interest in the <strong>Grosvenor</strong> Liverpool Fund, which is involved in property development and is<br />
incorporated in England and Wales.<br />
24. OTHER FINANCIAL ASSETS<br />
2006 2005<br />
£m £m<br />
–––——————–––––––––———<br />
Non-current assets<br />
Available for sale – equity shares 41.9 34.1<br />
– other 2.9 3.0<br />
Held to maturity – fixed rate bond – 21.1<br />
Loans and receivables – mezzanine loans 5.2 12.8<br />
–––——————–––––––––———<br />
50.0 71.0<br />
–––——————–––––––––———<br />
Current assets<br />
Loans and receivables – mezzanine loans 9.4 –<br />
–––——————–––––––––———<br />
Included in the above are property related financial assets of £56.5m (2005 – £68.0m).<br />
Principal other financial assets at 31 December 2006:<br />
EQUITY SHARES<br />
Principal Country of Effective<br />
activities incorporation interest<br />
–––––––––––––––––––––––––––––––––––––––––––––––—————––––––––––––––———<br />
Asia Standard International Group Limited Property Investment and development Hong Kong 15%<br />
(listed on the Hong Kong Stock Exchange)<br />
Hermill Investments Pte Limited Property Investment Singapore 17.4%<br />
–––––––––––––––––––––––––––––––––––––––––––––––—————––––––––––––––———<br />
MEZZANINE LOANS<br />
Mezzanine loans are loans provided to residential developers in the USA and Canada. A return is earned comprising fixed rate interest and a share of<br />
the profits on completion of the development.<br />
93
NOTES TO THE FINANCIAL STATEMENTS<br />
25. INTANGIBLE ASSETS<br />
Other<br />
intangible<br />
Goodwill assets Total<br />
2006 £m £m £m<br />
–––––––––––––—————––––––––––––––———<br />
Cost<br />
At 1 January 2006 7.2 – 7.2<br />
Acquisitions 0.1 2.3 2.4<br />
Disposals - (0.4) (0.4)<br />
Exchange - (0.2) (0.2)<br />
–––––––––––––—————––––––––––––––———<br />
At 31 December 2006 7.3 1.7 9.0<br />
–––––––––––––—————––––––––––––––———<br />
Amortisation/impairment<br />
At 1 January 2006 (3.3) – (3.3)<br />
Provision for impairment (0.2) – (0.2)<br />
Amortisation - (0.6) (0.6)<br />
–––––––––––––—————––––––––––––––———<br />
At 31 December 2006 (3.5) (0.6) (4.1)<br />
–––––––––––––—————––––––––––––––———<br />
Carrying amount<br />
At 1 January 2006 3.9 – 3.9<br />
–––––––––––––—————––––––––––––––———<br />
At 31 December 2006 3.8 1.1 4.9<br />
–––––––––––––—————––––––––––––––———<br />
Other<br />
intangible<br />
Goodwill assets Total<br />
2005 £m £m £m<br />
–––––––––––––—————––––––––––––––———<br />
Cost<br />
At 1 January 2005 – – –<br />
Acquisitions 7.2 – 7.2<br />
–––––––––––––—————––––––––––––––———<br />
At 31 December 2005 7.2 – 7.2<br />
–––––––––––––—————––––––––––––––———<br />
Amortisation/impairment<br />
At 1 January 2005 – – –<br />
Provision for impairment (3.3) – (3.3)<br />
–––––––––––––—————––––––––––––––———<br />
At 31 December 2005 (3.3) – (3.3)<br />
–––––––––––––—————––––––––––––––———<br />
Carrying amount<br />
At 1 January 2005 – – –<br />
–––––––––––––—————––––––––––––––———<br />
At 31 December 2005 3.9 – 3.9<br />
–––––––––––––—————––––––––––––––———<br />
94
NOTES TO THE FINANCIAL STATEMENTS<br />
26. DEFERRED TAX ASSETS AND LIABILITIES<br />
RECOGNISED DEFERRED TAX ASSETS AND LIABILITIES<br />
Deferred tax assets and liabilities are attributable to the following items:<br />
Assets Liabilities Net Assets Liabilities Net<br />
2006 2006 2006 2005 2005 2005<br />
£m £m £m £m £m £m<br />
–––––––––––––––––––––––––––––––––––––––––––––––––––––––—————––––––––––––––———<br />
Investment property – contingent gains 2.4 (521.2) (518.8) 2.3 (414.7) (412.4)<br />
Investment property – deferred gains 46.6 – 46.6 75.7 – 75.7<br />
Other property, plant and equipment – (7.5) (7.5) – (17.2) (17.2)<br />
Other financial assets 1.0 (0.4) 0.6 0.5 (0.9) (0.4)<br />
Interest-bearing loans and borrowings – (0.5) (0.5) 0.1 (0.4) (0.3)<br />
Employee benefits 10.9 (1.7) 9.2 11.0 (0.1) 10.9<br />
Provisions 0.4 (18.3) (17.9) 3.2 (16.8) (13.6)<br />
Other items 2.2 (5.6) (3.4) 1.1 (0.5) 0.6<br />
Tax value and loss carry-forwards recognised 2.3 – 2.3 1.1 – 1.1<br />
–––––––––––––––––––––––––––––––––––––––––––––––––––––––—————––––––––––––––———<br />
Tax assets/(liabilities) 65.8 (555.2) (489.4) 95.0 (450.6) (355.6)<br />
–––––––––––––––––––––––––––––––––––––––––––––––––––––––—————––––––––––––––———<br />
At 31 December 2006, no deferred tax was provided in respect of investments in subsidiaries because the Group is able to control the timing of the<br />
reversal of temporary differences and is satisfied that it is probable they will not reverse in the foreseeable future.<br />
UNRECOGNISED DEFERRED TAX ASSETS<br />
2006 2005<br />
£m £m<br />
–––——————–––––––––———<br />
Tax losses 0.7 0.2<br />
–––——————–––––––––———<br />
Movement in temporary differences during the year<br />
Balance at<br />
Balance at<br />
1 Jan Recognised Recognised Exchange 31 Dec<br />
2006 in Income in Equity movement 2006<br />
£m £m £m £m £m<br />
–––––––––––––––––––––––––––––––––––––––––—————––––––––––––––———<br />
Investment property – contingent gains (412.4) (100.5) (17.1) 11.2 (518.8)<br />
Investment property – deferred gains 75.7 (29.1) – – 46.6<br />
Other property, plant and equipment (17.2) 9.7 – – (7.5)<br />
Other financial assets (0.4) 1.0 – – 0.6<br />
Interest-bearing loans and borrowings (0.3) (0.1) (0.2) 0.1 (0.5)<br />
Employee benefits 10.9 2.1 (2.9) (0.9) 9.2<br />
Provisions (13.6) (6.0) – 1.7 (17.9)<br />
Other items 0.6 (2.6) – (1.4) (3.4)<br />
Tax value and loss carry-forwards recognised 1.1 1.1 – 0.1 2.3<br />
–––––––––––––––––––––––––––––––––––––––––—————––––––––––––––———<br />
(355.6) (124.4) (20.2) 10.8 (489.4)<br />
–––––––––––––––––––––––––––––––––––––––––—————––––––––––––––———<br />
95
NOTES TO THE FINANCIAL STATEMENTS<br />
27. TRADING PROPERTIES<br />
2006 2005<br />
£m £m<br />
–––——————–––––––––———<br />
At 1 January 34.5 44.1<br />
Additions 39.3 13.9<br />
Disposals (17.5) (24.8)<br />
Provision for impairment (1.4) (0.8)<br />
Transfer from/(to) investment properties 3.2 (3.1)<br />
Transfer from investment property under development – 3.3<br />
Transfer to joint venture (6.0) –<br />
Exchange movements (3.4) 1.9<br />
–––——————–––––––––———<br />
At 31 December 48.7 34.5<br />
–––——————–––––––––———<br />
At 31 December 2006, trading properties with a carrying amount of £11.8m were pledged as security for bank loans (2005 – £7.0m).<br />
28. TRADE AND OTHER RECEIVABLES<br />
Group<br />
Company<br />
2006 2005 2006 2005<br />
£m £m £m £m<br />
–––––––––––––––––––––––––––—————––––––––––––––———<br />
Trade receivables 11.7 12.3 – –<br />
Receivables due from subsidiaries – – 110.5 15.0<br />
Receivables due from joint ventures 58.9 30.6 – –<br />
Other receivables 46.4 16.6 – –<br />
Prepayments 16.1 16.0 – –<br />
–––––––––––––––––––––––––––—————––––––––––––––———<br />
133.1 75.5 110.5 15.0<br />
–––––––––––––––––––––––––––—————––––––––––––––———<br />
Included in the above are receivables due after more than one year totalling £47.4m (2005 – £14.5m).<br />
29. CASH AND CASH EQUIVALENTS<br />
2006 2005<br />
£m £m<br />
–––——————–––––––––———<br />
Bank balances 113.1 70.4<br />
Cash deposits 342.3 315.1<br />
–––——————–––––––––———<br />
Cash and cash equivalents 455.4 385.5<br />
Bank overdrafts (4.6) (1.2)<br />
–––——————–––––––––———<br />
Cash and cash equivalents in the statement of cash flows 450.8 384.3<br />
–––——————–––––––––———<br />
<strong>The</strong> amount of cash and cash equivalents not available for use by the Group totals £125.2m (2005 – £3.3m).<br />
96
NOTES TO THE FINANCIAL STATEMENTS<br />
30. INTEREST-BEARING LOANS AND BORROWINGS<br />
2006 2005<br />
£m £m<br />
–––——————–––––––––———<br />
Non-current liabilities<br />
Secured bank loans 238.5 210.2<br />
Unsecured bank loans 70.0 70.1<br />
Secured bond issues 202.6 202.6<br />
Unsecured bond issues 53.1 65.9<br />
Finance lease liabilities 1.4 6.3<br />
–––——————–––––––––———<br />
565.6 555.1<br />
–––——————–––––––––———<br />
Current liabilities<br />
Current portion of secured bank loans 26.6 3.6<br />
Current portion of unsecured bank loans – 0.7<br />
Current portion on unsecured bond issues 13.3 –<br />
Current portion of loan from joint ventures 49.4 14.8<br />
–––——————–––––––––———<br />
89.3 19.1<br />
–––——————–––––––––———<br />
<strong>The</strong> bank loans and secured bonds are secured over investment properties and investment properties under development with a carrying value of £1,063.5m<br />
(2005 – £882.5m), land and buildings with a carrying value of £37.1m (2005 – £28.6m) and trading properties with a carrying value of £11.8m (2005 – £7.0m).<br />
MATURITY PROFILE OF INTEREST-BEARING LOANS AND BORROWINGS<br />
2006 2005<br />
£m £m<br />
–––——————–––––––––———<br />
From 1 to 2 years 61.3 90.6<br />
From 2 to 5 years 146.8 127.3<br />
After 5 years 357.5 337.2<br />
–––——————–––––––––———<br />
Due after more than one year 565.6 555.1<br />
Due within one year 89.3 19.1<br />
–––——————–––––––––———<br />
654.9 574.2<br />
–––——————–––––––––———<br />
BORROWING FACILITIES<br />
Undrawn committed borrowing facilities available to the Group at 31 December 2006 were as follows:<br />
2006 2005<br />
£m £m<br />
–––——————–––––––––———<br />
Expiring less than 1 year 99.7 145.5<br />
Expiring from 1 to 2 years 26.0 77.5<br />
Expiring from 2 to 5 years 303.4 242.9<br />
–––——————–––––––––———<br />
Total 429.1 465.9<br />
–––——————–––––––––———<br />
FINANCE LEASE LIABILITIES<br />
Finance lease liabilities are payable as follows:<br />
Minimum<br />
lease<br />
2006 2005<br />
Minimum<br />
lease<br />
payments Interest Principal payments Interest Principal<br />
£m £m £m £m £m £m<br />
–––––––––––––––——————–––––––––——— –––––––––––––––——————–––––––––———<br />
Less than one year 0.3 0.3 – 0.7 0.7 –<br />
Between one and five years 1.2 1.2 – 2.7 2.7 –<br />
More than five years 74.8 73.4 1.4 98.3 92.0 6.3<br />
–––––––––––––––——————–––––––––——— –––––––––––––––——————–––––––––———<br />
76.3 74.9 1.4 101.7 95.4 6.3<br />
–––––––––––––––——————–––––––––——— –––––––––––––––——————–––––––––———<br />
97
NOTES TO THE FINANCIAL STATEMENTS<br />
31. FINANCIAL INSTRUMENTS<br />
EFFECTIVE INTEREST RATE AND REPRICING ANALYSIS<br />
2006<br />
Effective Floating Fixed interest rate Noninterest<br />
interest ––––––––——————–––––––––——— interest<br />
rate rate < 1 year 1 – 5 years > 5 years bearing Total<br />
% £m £m £m £m £m £m<br />
–––––––––––––––——————–––––––––——— –––––––––––––––——————–––––––––———<br />
Financial assets<br />
Other financial assets<br />
– available for sale – – – – – 44.8 44.8<br />
– loans and receivables 10.0 – 6.5 8.1 – – 14.6<br />
Trade and other receivables – – – – – 133.1 133.1<br />
Cash and cash equivalents 4.4 455.4 – – – – 455.4<br />
––––——————–––––––––———–––––––––––––––——————–––––––––———<br />
Total financial assets 455.4 6.5 8.1 – 177.9 647.9<br />
––––——————–––––––––———–––––––––––––––——————–––––––––———<br />
Financial liabilities<br />
Bank overdrafts 6.0 (4.6) – – – – (4.6)<br />
––––——————–––––––––——— –––––––––––––––——————–––––––––———<br />
Fixed rate loans<br />
Sterling secured mortgage 2034 10.4 – – – (50.0) – (50.0)<br />
Sterling secured bond 2026 6.4 – – – (202.5) – (202.5)<br />
Sterling unsecured bond 2019 8.4 – – – (52.5) – (52.5)<br />
Other Sterling loans 11.0 – – (15.0) – – (15.0)<br />
Euro 4.3 – – – (17.4) – (17.4)<br />
US Dollar 6.0 – – (61.5) (22.2) – (83.7)<br />
Canadian Dollar 5.9 – (13.9) (11.7) (12.2) – (37.8)<br />
Australian Dollar 6.8 – – (36.8) – – (36.8)<br />
Japanese Yen 2.9 – – (8.0) – – (8.0)<br />
––––——————–––––––––———–––––––––––––––——————–––––––––———<br />
Total fixed rate loans – (13.9) (133.0) (356.8) – (503.7)<br />
––––——————–––––––––———–––––––––––––––——————–––––––––———<br />
Floating rate loans<br />
Sterling 5.5 (55.0) – – – – (55.0)<br />
Euro 4.3 (13.3) – – – – (13.3)<br />
Canadian Dollar 6.3 (10.4) – – – – (10.4)<br />
Australian Dollar 7.2 (21.7) – – – – (21.7)<br />
––––——————–––––––––———–––––––––––––––——————–––––––––———<br />
Total floating rate loans (100.4) – – – – (100.4)<br />
––––——————–––––––––———–––––––––––––––——————–––––––––———<br />
Loan from joint ventures 3.8 (41.1) – – – (8.3) (49.4)<br />
Trade and other payables – – – – – (107.6) (107.6)<br />
Finance lease liabilities 11.0 – – – (1.4) – (1.4)<br />
––––——————–––––––––———–––––––––––––––——————–––––––––———<br />
Total financial liabilities (146.1) (13.9) (133.0) (358.2) (115.9) (767.1)<br />
––––——————–––––––––——— –––––––––––––––——————–––––––––———<br />
In the table above borrowings of £108.6m included in fixed rate loans take account of the effect of interest rate swap agreements at 31 December 2006.<br />
98
NOTES TO THE FINANCIAL STATEMENTS<br />
31. FINANCIAL INSTRUMENTS (CONTINUED)<br />
2005<br />
Effective Floating Fixed interest rate Noninterest<br />
interest ––––––––——————–––––––––——— interest<br />
rate rate < 1 year 1 – 5 years > 5 years bearing Total<br />
% £m £m £m £m £m £m<br />
–––––––––––––––——————–––––––––——— –––––––––––––––——————–––––––––———<br />
Financial assets<br />
Other financial assets<br />
– available for sale 7.5 – 0.1 – – 37.0 37.1<br />
– held to maturity 10.0 – – 21.1 – – 21.1<br />
– loans and receivables 9.5 – – 12.8 – – 12.8<br />
Trade and other receivables – – – – – 75.5 75.5<br />
Cash and cash equivalents 4.1 385.5 – – – – 385.5<br />
––––——————–––––––––———–––––––––––––––——————–––––––––———<br />
Total financial assets 385.5 0.1 33.9 – 112.5 532.0<br />
––––——————–––––––––———–––––––––––––––——————–––––––––———<br />
Financial liabilities<br />
Bank overdrafts 5.5 (1.2) – – – – (1.2)<br />
––––——————–––––––––——— –––––––––––––––——————–––––––––———<br />
Fixed rate loans<br />
Sterling secured mortgage 2034 10.4 – – – (50.0) – (50.0)<br />
Sterling secured bond 2026 6.4 – – – (202.6) – (202.6)<br />
Sterling unsecured bond 2019 8.4 – – – (52.5) – (52.5)<br />
Other Sterling loans 11.0 – – (15.0) (0.1) – (15.1)<br />
US Dollar 6.3 – – (45.9) – – (45.9)<br />
Canadian Dollar 6.8 – – (27.1) (4.5) – (31.6)<br />
Australian Dollar 6.8 – – (40.1) – – (40.1)<br />
––––——————–––––––––———–––––––––––––––——————–––––––––———<br />
Total fixed rate loans – – (128.1) (309.7) – (437.8)<br />
––––——————–––––––––———–––––––––––––––——————–––––––––———<br />
Floating rate loans<br />
Sterling 5.1 (55.0) – – – – (55.0)<br />
Euro 3.5 (31.2) – – – – (31.2)<br />
US Dollar 6.1 (19.2) – – – – (19.2)<br />
Canadian Dollar 5.5 (2.0) – – – – (2.0)<br />
Australian Dollar 6.5 (7.9) – – – – (7.9)<br />
––––——————–––––––––———–––––––––––––––——————–––––––––———<br />
Total floating rate loans (115.3) – – – – (115.3)<br />
––––——————–––––––––———–––––––––––––––——————–––––––––———<br />
Loan from joint ventures 2.6 (14.8) – – – – (14.8)<br />
Trade and other payables – – – – – (104.6) (104.6)<br />
Finance lease liabilities 8.2 – – – (6.3) – (6.3)<br />
––––——————–––––––––———–––––––––––––––——————–––––––––———<br />
Total financial liabilities (131.3) – (128.1) (316.0) (104.6) (680.0)<br />
––––——————–––––––––——— –––––––––––––––——————–––––––––———<br />
99
NOTES TO THE FINANCIAL STATEMENTS<br />
31. FINANCIAL INSTRUMENTS (CONTINUED)<br />
In the table below the underlying debt is recorded ignoring the effect of interest swap agreements, which are shown separately.<br />
FAIR VALUES<br />
2006 2005<br />
Carrying Fair Carrying Fair<br />
amount value amount value<br />
£m £m £m £m<br />
——————————————————––––––––––––––———<br />
Financial assets<br />
Other financial assets<br />
– available for sale 44.8 44.8 37.1 37.1<br />
– held to maturity – – 21.1 21.5<br />
– loans and receivables 14.6 14.6 12.8 12.8<br />
Trade and other receivables 133.1 133.1 75.5 75.5<br />
Cash and cash equivalents 455.4 455.4 385.5 385.5<br />
——————————————————––––––––––––––———<br />
Total financial assets 647.9 647.9 532.0 532.4<br />
——————————————————––––––––––––––———<br />
Financial liabilities<br />
Bank overdrafts (4.6) (4.6) (1.2) (1.2)<br />
——————————————————––––––––––––––———<br />
Fixed rate loans<br />
Sterling secured mortgage 2034 (50.0) (86.6) (50.0) (89.2)<br />
Sterling secured bond 2026 (202.5) (231.5) (202.6) (237.1)<br />
Sterling unsecured bond 2019 (52.5) (65.3) (52.5) (68.9)<br />
Other sterling loans (15.0) (16.5) (15.1) (17.6)<br />
US Dollar (40.8) (41.0) (2.4) (2.5)<br />
Canadian Dollar (26.8) (27.5) (18.4) (19.1)<br />
Japanese Yen (8.0) (8.0)<br />
——————————————————––––––––––––––———<br />
Total fixed rate loans (395.6) (476.4) (341.0) (434.4)<br />
——————————————————––––––––––––––———<br />
Interest rate swaps<br />
US Dollar 0.1 0.1 (0.1) (0.1)<br />
Canadian Dollar – – (0.7) (0.7)<br />
Australian Dollar 0.4 0.4 (0.4) (0.4)<br />
——————————————————––––––––––––––———<br />
Total interest rate swaps 0.5 0.5 (1.2) (1.2)<br />
——————————————————––––––––––––––———<br />
Floating rate loans<br />
Sterling (55.0) (55.0) (55.0) (55.0)<br />
Euro (30.7) (30.7) (31.2) (31.2)<br />
US Dollar (42.9) (42.9) (62.7) (62.7)<br />
Canadian Dollar (21.4) (21.4) (14.4) (14.4)<br />
Australian Dollar (59.0) (59.0) (47.6) (47.6)<br />
——————————————————––––––––––––––———<br />
Total floating rate loans (209.0) (209.0) (210.9) (210.9)<br />
——————————————————––––––––––––––———<br />
Loan from joint ventures (49.4) (49.4) (14.8) (14.8)<br />
Trade and other payables (107.6) (107.5) (104.6) (104.6)<br />
Finance lease liabilities (1.4) (2.9) (6.3) (9.1)<br />
——————————————————––––––––––––––———<br />
Total financial liabilities (767.1) (849.3) (680.0) (776.2)<br />
——————————————————––––––––––––––———<br />
100
NOTES TO THE FINANCIAL STATEMENTS<br />
32. TRADE AND OTHER PAYABLES<br />
2006 2005<br />
£m £m<br />
–––——————–––––––––———<br />
Current liabilities<br />
Trade payables 15.5 12.1<br />
Payables due to subsidiaries – –<br />
Payables due to joint ventures 0.6 6.6<br />
Other payables 24.4 11.4<br />
Accrued expenses 64.7 62.9<br />
Deferred income 1.7 1.7<br />
–––——————–––––––––———<br />
106.9 94.7<br />
–––——————–––––––––———<br />
Non-current liabilities<br />
Deferred income 152.2 164.4<br />
Other payables 2.4 11.6<br />
–––——————–––––––––———<br />
Deferred income includes £153.7m in respect of deferred lease premium profits (2005 – £165.9m).<br />
154.6 176.0<br />
–––——————–––––––––———<br />
33. PROVISIONS<br />
2006 2005<br />
Development loss provision £m £m<br />
–––——————–––––––––———<br />
At 1 January 10.0 –<br />
Recognised in the year 148.8 10.0<br />
–––——————–––––––––———<br />
At 31 December 158.8 10.0<br />
–––——————–––––––––———<br />
<strong>The</strong> development loss provision is in respect of the forecast loss on the Liverpool One project. It is not considered practicable to split this amount between<br />
current and non-current liabilities.<strong>The</strong> liabilities are expected to crystallise in the period 2007 to 2008.<br />
101
NOTES TO THE FINANCIAL STATEMENTS<br />
34. OPERATING LEASE COMMITMENTS<br />
LEASES AS LESSEE<br />
<strong>The</strong> amount of lease rentals charged to the income statement during the year comprised:<br />
2006 2005<br />
£m £m<br />
–––——————–––––––––———<br />
Land and buildings 4.4 4.3<br />
–––——————–––––––––———<br />
4.4 4.3<br />
–––——————–––––––––———<br />
Non-cancellable operating lease rentals are payable as follows:<br />
2006 2005<br />
£m £m<br />
–––——————–––––––––———<br />
Less than one year 4.6 3.7<br />
Between one and five years 17.6 13.9<br />
More than five years 10.2 12.3<br />
–––——————–––––––––———<br />
32.4 29.9<br />
–––——————–––––––––———<br />
LEASES AS LESSOR<br />
Future minimum lease payments under non-cancellable leases are as follows:<br />
2006 2005<br />
£m £m<br />
–––——————–––––––––———<br />
Less than one year 91.2 73.1<br />
Between one and five years 277.3 212.6<br />
More than five years 1,416.1 1,712.5<br />
–––——————–––––––––———<br />
1,784.6 1,998.2<br />
–––——————–––––––––———<br />
35. CAPITAL COMMITMENTS<br />
2006 2005<br />
£m £m<br />
–––——————–––––––––———<br />
Investment properties contracted but not provided 91.0 31.6<br />
Development properties contracted but not provided 80.8 152.1<br />
–––——————–––––––––———<br />
171.8 183.7<br />
–––——————–––––––––———<br />
102
NOTES TO THE FINANCIAL STATEMENTS<br />
36. CONTINGENT LIABILITIES<br />
In connection with the demerger of Deva Group Limited (non-core activities) in 1999 the Company has provided guarantees up to a maximum of £22m<br />
(2005 – £22m).<br />
Certain Group companies have given performance undertakings to third parties in respect of various contractual obligations entered into in the<br />
ordinary course of business.<br />
37. SHARE CAPITAL<br />
2006 2005<br />
Number<br />
Number<br />
of shares £m of shares £m<br />
––––––––––––––––––––––––––––—————––––––––––––––———<br />
Authorised<br />
Ordinary shares of £1 8,000,000 8.0 8,000,000 8.0<br />
Non-voting ordinary shares of £1 64,000,000 64.0 64,000,000 64.0<br />
12% Non-cumulative irredeemable preference shares of £1 8,000,000 8.0 8,000,000 8.0<br />
––––––––––––––––––––––––––––—————––––––––––––––———<br />
80,000,000 80.0 80,000,000 80.0<br />
––––––––––––––––––––––––––––—————––––––––––––––———<br />
2006 2005<br />
Number<br />
Number<br />
of shares £m of shares £m<br />
––––––––––––––––––––––––––––—————––––––––––––––———<br />
Allocated, called up and fully paid<br />
Ordinary shares of £1 6,083,924 6.1 6,083,924 6.1<br />
Non-voting ordinary shares of £1 48,671,392 48.6 48,671,392 48.6<br />
12% Non-cumulative irredeemable preference shares of £1 6,083,924 6.1 6,083,924 6.1<br />
––––––––––––––––––––––––––––—————––––––––––––––———<br />
RIGHTS OF CLASSES OF SHARES<br />
60,839,240 60.8 60,839,240 60.8<br />
––––––––––––––––––––––––––––—————––––––––––––––———<br />
Profits determined by the Directors as available for distribution are to be applied first in paying a fixed non-cumulative dividend of 12% per annum on the<br />
amounts paid up on the 12% non-cumulative irredeemable preference shares.<strong>The</strong> balance of profits available for distribution is payable to the holders of<br />
the ordinary shares and non-voting ordinary shares in proportion to the amounts paid up on their shares.<br />
On a return of the Company’s assets to shareholders the assets are to be applied first in repaying to the holders of the 12% non-cumulative<br />
irredeemable preferences shares the amounts paid up on their shares.<strong>The</strong> balance of the assets is payable to the holders of the ordinary shares and nonvoting<br />
ordinary shares in proportion to the amounts paid up on their shares.<br />
Holders of the 12% non-cumulative irredeemable preference shares and non-voting ordinary shares are not entitled to vote at general meetings of<br />
the members of the Company except on resolutions varying or abrogating any of the special rights or privileges attaching to their shares.<br />
On 14 March 2007 the Company purchased the following shares from shareholders representing 6.56% of its called up share capital:<br />
Ordinary shares Nominal value £1 399,047<br />
Non-voting ordinary shares Nominal value £1 3,192,376<br />
12% Non-cumulative irredeemable preference shares Nominal value £1 399,047<br />
<strong>The</strong> total consideration for the purchase of the above shares was £40.3m.<br />
103
NOTES TO THE FINANCIAL STATEMENTS<br />
38. RECONCILIATION OF SHARE CAPITAL AND RESERVES<br />
(A)<br />
GROUP<br />
Trans- Fair Revalu-<br />
Share Share lation Other value ation Retained Minority Total<br />
capital Premium reserve reserve reserve reserve Earnings Total Interest equity<br />
£m £m £m £m £m £m £m £m £m £m<br />
––––––––––––––––––––––––––––––––––––––––––––––––––––––––––––––––––––—————––––––––––––––———<br />
At 1 January 2005 60.8 173.1 (14.5) 102.2 12.0 72.0 1,383.0 1,788.6 113.3 1,901.9<br />
Profit for the year – – – – – – 251.5 251.5 13.6 265.1<br />
Revaluation movement – – – – – 17.0 – 17.0 0.3 17.3<br />
Fair value adjustments – – – 0.2 (7.8) – – (7.6) – (7.6)<br />
Recycled to income statement – – – 5.7 – – – 5.7 – 5.7<br />
Deferred tax – – – – – (2.5) 3.3 0.8 – 0.8<br />
Pension actuarial losses – – – – – – (11.3) (11.3) – (11.3)<br />
Dividends to shareholders – – – – – – (8.5) (8.5) (2.2) (10.7)<br />
Other – – – 0.1 – – (0.5) (0.4) (29.9) (30.3)<br />
Exchange – – 55.8 – – – – 55.8 (0.2) 55.6<br />
––––––––––––––––––––––––––––––––––––––––––––––––––––––––––––––––––––—————––––––––––––––———<br />
At 31 December 2005 60.8 173.1 41.3 108.2 4.2 86.5 1,617.5 2,091.6 94.9 2,186.5<br />
Profit for the year – – – – – – 347.1 347.1 17.1 364.2<br />
Revaluation movement – – – – – 75.9 – 75.9 3.7 79.6<br />
Fair value adjustments – – – 2.9 (0.1) – – 2.8 – 2.8<br />
Deferred tax – – – – – (22.1) (2.9) (25.0) – (25.0)<br />
Pension actuarial gains – – – – – – 10.6 10.6 – 10.6<br />
Dividends to shareholders – – – – – – (9.4) (9.4) (0.5) (9.9)<br />
Transfer between reserves – – – – – (10.9) 10.9 – – –<br />
Minority shares issued by subsidiaries – – – – – – – 35.5 35.5<br />
Exchange – – (75.7) – – – – (75.7) (1.8) (77.5)<br />
––––––––––––––––––––––––––––––––––––––––––––––––––––––––––––––––––––—————––––––––––––––———<br />
At 31 December 2006 60.8 173.1 (34.4) 111.1 4.1 129.4 1,973.8 2,417.9 148.9 2,566.8<br />
––––––––––––––––––––––––––––––––––––––––––––––––––––––––––––––––––––—————––––––––––––––———<br />
Other reserves primarily comprise exchange gains and losses recognised by the Group prior to the adoption of IFRS accounting standards.<br />
(B)<br />
COMPANY<br />
Merger<br />
Share Share Capital Profit and Total<br />
capital Premium reserve loss account equity<br />
£m £m £m £m £m<br />
––––––––––––––––––––––––––––––––––––––––—————––––––––––––––———<br />
At 1 January 2005 60.8 28.3 1,268.7 21.1 1,378.9<br />
Retained profit for the year – – – 8.5 8.5<br />
Dividends to shareholders – – – (8.5) (8.5)<br />
––––––––––––––––––––––––––––––––––––––––—————––––––––––––––———<br />
At 31 December 2005 60.8 28.3 1,268.7 21.1 1,378.9<br />
Retained profit for the year – – – 99.4 99.4<br />
Dividends to shareholders – – – (9.4) (9.4)<br />
––––––––––––––––––––––––––––––––––––––––—————––––––––––––––———<br />
At 31 December 2006 60.8 28.3 1,268.7 111.1 1,468.9<br />
––––––––––––––––––––––––––––––––––––––––—————––––––––––––––———<br />
DIVIDENDS<br />
After the balance sheet date, the following dividends were proposed:<br />
£m<br />
––––––––———<br />
Dividends on ordinary shares 6.0<br />
Dividends on preference shares 0.7<br />
––––––––———<br />
6.7<br />
––––––––———<br />
<strong>The</strong> dividends have not been provided for and there are no income tax consequences for the Group.<br />
104
NOTES TO THE FINANCIAL STATEMENTS<br />
39. NOTES TO THE CONSOLIDATED STATEMENT OF CASH FLOWS<br />
(A)<br />
RECONCILIATION OF PROFIT FROM OPERATIONS INCLUDING SHARE OF JOINT VENTURES TO OPERATING<br />
PROFIT BEFORE CHANGES IN WORKING CAPITAL AND PROVISIONS<br />
2006 2005<br />
£m £m<br />
–––——————–––––––––———<br />
Operating activities<br />
Profit from operations including share of joint ventures 529.5 385.3<br />
Adjustments for<br />
Depreciation 2.3 1.7<br />
Foreign exchange losses 0.3 0.8<br />
Amortisation of capitalised lease incentives (0.8) (2.1)<br />
Amortisation of deferred lease premiums (1.9) (1.7)<br />
Recognition of income from operating lease incentives (3.7) (2.0)<br />
Gain on sale on other investments (0.3) (0.1)<br />
Hedging gains (1.0) (2.1)<br />
Net gains on revaluation and sale of investment property (518.7) (246.8)<br />
Share of profit of joint ventures (149.6) (121.6)<br />
Share of loss of associates 4.6 –<br />
Impairment of goodwill 0.2 3.3<br />
Amortisation of other intangible assets 0.6 –<br />
Loss on trading and development properties 176.6 7.3<br />
–––——————–––––––––———<br />
Operating profit before changes in working capital and provisions 38.1 22.0<br />
–––——————–––––––––———<br />
(B)<br />
ANALYSIS OF NET DEBT<br />
Other<br />
1 January non-cash Exchange 31 December<br />
2006 Cash flow movements movements 2006<br />
£m £m £m £m £m<br />
––––––––––––––––––––––––––––––––––––––––—————––––––––––––––———<br />
Cash at bank and in hand 70.4 45.4 – (2.7) 113.1<br />
Short term deposits and short term liquid investments 315.1 38.3 – (11.1) 342.3<br />
Bank overdraft (1.2) (3.8) – 0.4 (4.6)<br />
––––––––––––––––––––––––––––––––––––––––—————––––––––––––––———<br />
Cash and cash equivalents 384.3 79.9 – (13.4) 450.8<br />
––––––––––––––––––––––––––––––––––––––––—————––––––––––––––———<br />
Borrowings due within one year (19.1) (73.3) – 3.1 (89.3)<br />
Borrowings due after more than 1 year (555.1) (14.8) (12.8) 17.1 (565.6)<br />
––––––––––––––––––––––––––––––––––––––––—————––––––––––––––———<br />
Total borrowings (574.2) (88.1) (12.8) 20.2 (654.9)<br />
––––––––––––––––––––––––––––––––––––––––—————––––––––––––––———<br />
Net borrowings (189.9) (8.2) (12.8) 6.8 (204.1)<br />
––––––––––––––––––––––––––––––––––––––––—————––––––––––––––———<br />
Other non-cash movements relate to a £17.7m transfer of debt from joint ventures and a £4.9m reduction of finance lease liabilities arising on<br />
property sales.<br />
105
NOTES TO THE FINANCIAL STATEMENTS<br />
39. NOTES TO THE CONSOLIDATED STATEMENT OF CASH FLOWS (CONTINUED)<br />
(C)<br />
ACQUISITION OF GROUP UNDERTAKINGS<br />
2006<br />
£m<br />
––––––––––———<br />
Additional investment in Sonae Sierra SGPS 157.3<br />
Acquisition of Legg Mason Real Estate Services Inc. 4.6<br />
––––––––––———<br />
161.9<br />
––––––––––———<br />
On 21 February 2006 the Group acquired 17.1% of Sonae Sierra SGPS, increasing the previous investment of 32.9% to 50%. On 31 March 2006 the<br />
Group acquired 100% of Legg Mason Real Estate Services Inc. (now <strong>Grosvenor</strong> Investment Management Inc.).<br />
Sonae Sierra SGPS<br />
Book value Fair value Fair value<br />
at acquisition adjustments acquired<br />
£m £m £m<br />
–––––––––––––—————––––––––––––––———<br />
Fair value of assets acquired<br />
Intangible assets 6.3 7.4 13.7<br />
Tangible assets 325.5 – 325.5<br />
Debtors 19.6 – 19.6<br />
Cash and cash equivalents 20.2 – 20.2<br />
Current liabilities (23.8) – (23.8)<br />
Non-current liabilities (230.0) – (230.0)<br />
–––––––––––––—————––––––––––––––———<br />
Net assets acquired 117.8 7.4 125.2<br />
–––––––––––––—————––––––––––––––———<br />
Goodwill 32.1<br />
––––––––––———<br />
Total 157.3<br />
––––––––––———<br />
Fair value of consideration<br />
Cash 156.0<br />
Costs 1.3<br />
––––––––––———<br />
Total 157.3<br />
––––––––––———<br />
Legg Mason Real Estate Services Inc.<br />
Book value Fair value Fair value<br />
at acquisition adjustments acquired<br />
£m £m £m<br />
–––––––––––––—————––––––––––––––———<br />
Fair value of assets acquired<br />
Intangible assets 0.3 2.0 2.3<br />
Tangible assets 0.6 – 0.6<br />
Debtors – 1.7 1.7<br />
–––––––––––––—————––––––––––––––———<br />
Net assets acquired 0.9 3.7 4.6<br />
–––––––––––––—————––––––––––––––———<br />
Fair value of consideration<br />
Cash 3.8<br />
Costs 0.8<br />
––––––––––———<br />
Total 4.6<br />
––––––––––———<br />
106
NOTES TO THE FINANCIAL STATEMENTS<br />
40. RELATED PARTY TRANSACTIONS<br />
<strong>Grosvenor</strong> Group Limited is wholly owned by Trusts and members of the <strong>Grosvenor</strong> Family headed by the 6th Duke of Westminster. Group companies<br />
paid £1.0m (2005 – £1.0m) in arms length rentals to <strong>Grosvenor</strong> Trusts and received £1.0m (2005 – £0.3m) in arms length rentals and service charges<br />
from certain Directors, members of the <strong>Grosvenor</strong> Family and <strong>Grosvenor</strong> Trusts.<br />
In the ordinary course of its business the Group provides services to <strong>Grosvenor</strong> Trusts and some members of the <strong>Grosvenor</strong> Family. Income from<br />
these services totalled £6.0m (2005 – £4.7m). At the year end the balance due to certain members of the <strong>Grosvenor</strong> Family and <strong>Grosvenor</strong> Trusts was<br />
£0.2m (2005 – £0.2m due from) in relation to these services.<strong>The</strong>se services mainly relate to the Group’s management of the Belgravia Estate.<br />
In 2006, the Group arranged insurance cover on normal commercial terms through a related company. Aggregate premiums paid in the year were<br />
£6.3m (2005 – £5.9m).<br />
In 2006, the Group purchased development properties of £nil (2005 – £19.9m) in arms length agreements from <strong>Grosvenor</strong> Trusts. At the year end<br />
£nil (2005 – £nil) was due from <strong>Grosvenor</strong> Trusts.<br />
In 2006, the Group received development management income of £0.9m (2005 – £3.6m) in arms length arrangements from <strong>Grosvenor</strong> Trusts, and<br />
£5.2m (2005 – £6.0m) from associates. At year end £nil (2005 – £nil) was due from <strong>Grosvenor</strong> Trusts and £nil (2005 – £0.5m) was accrued in relation<br />
to income owed from associates.<br />
At 31 December 2006, the Group owed £41.1m (2005 – £14.8m) to Sonae Sierra SGPS SA and £8.3m to Barkhill Ltd (2005 – £nil), both joint<br />
ventures.<br />
On 28 February 2006 the Group sold two subsidiaries, <strong>Grosvenor</strong> (Mayfair) Estate and <strong>Grosvenor</strong> (Belgravia) Estate to one of the Trusts for a total<br />
consideration of £5.4m. <strong>The</strong> sale was at book value before the adjustments to defer lease premium profits; the release of these deferrals resulted in a<br />
profit in the year of £41.1m.<br />
As explained in note 36 the Company has provided guarantees up to a maximum of £22m (2005 – £22m) to the Deva Group Limited, which is<br />
owned by the <strong>Grosvenor</strong> Trusts.<br />
107
CONSOLIDATED INCOME STATEMENT PRESENTED IN US DOLLARS<br />
for the year ended 31 December 2006<br />
2006 2005<br />
US$m US$m<br />
–––——————–––––––––———<br />
Total revenue 651.9 712.8<br />
–––——————–––––––––———<br />
Gross rental income 197.3 176.3<br />
Property outgoings (76.9) (83.6)<br />
–––——————–––––––––———<br />
Net rental income 120.4 92.7<br />
Net other income 97.8 54.5<br />
Administrative expenses (140.1) (97.2)<br />
Loss on trading and development properties (326.3) (13.3)<br />
Gains on other investments 0.6 –<br />
Gains on revaluation and sale of investment property 958.5 449.7<br />
Impairment of goodwill (0.4) (6.0)<br />
Share of profit of joint ventures 276.4 221.6<br />
Share of loss of associates (8.5) –<br />
–––——————–––––––––———<br />
Profit from operations including share of joint ventures and associates 978.4 702.0<br />
Dividend income 2.0 0.5<br />
Financial income 35.7 39.1<br />
Financial expenses (76.1) (71.0)<br />
–––——————–––––––––———<br />
Net financing costs (38.4) (31.4)<br />
–––——————–––––––––———<br />
Profit before tax 940.0 670.6<br />
Current tax (37.1) (15.4)<br />
Deferred tax (229.9) (172.2)<br />
–––——————–––––––––———<br />
Profit for the year 673.0 483.0<br />
–––——————–––––––––———<br />
Attributable to:<br />
Equity holders of the parent 641.4 458.1<br />
Minority interest 31.6 24.9<br />
–––——————–––––––––———<br />
Profit for the year 673.0 483.0<br />
–––——————–––––––––———<br />
<strong>The</strong> above statement, prepared under IFRS accounting standards, is translated at the average exchange rate for the relevant year.<br />
108
CONSOLIDATED BALANCE SHEET PRESENTED IN US DOLLARS<br />
as at 31 December 2006<br />
Group Group<br />
2006 2005<br />
US$m US$m<br />
–––——————–––––––––———<br />
ASSETS<br />
Non-current assets<br />
Investment property 4431.9 3,323.7<br />
Investment property under development 167.5 122.6<br />
Other property, plant and equipment 84.4 58.0<br />
Investments in joint ventures 1,934.3 1,356.3<br />
Investment in associates 121.0 50.5<br />
Other financial assets 97.8 121.9<br />
Intangible assets 9.6 6.7<br />
Deferred tax assets 128.8 163.1<br />
–––——————–––––––––———<br />
Total non-current assets 6,975.3 5,202.8<br />
–––——————–––––––––———<br />
Current assets<br />
Trading properties 95.3 59.2<br />
Trade and other receivables 260.5 129.6<br />
Other financial assets 18.4 –<br />
Income tax receivable 60.0 21.8<br />
Cash and cash equivalents 891.3 661.8<br />
–––——————–––––––––———<br />
Total current assets 1,325.5 872.4<br />
–––——————–––––––––———<br />
TOTAL ASSETS 8,300.8 6,075.2<br />
LIABILITIES<br />
Non-current liabilities<br />
Interest-bearing loans and borrowings (1,107.0) (953.0)<br />
Trade and other payables (302.6) (302.2)<br />
Employee benefits (30.9) (47.7)<br />
Deferred tax liabilities (1,086.6) (773.6)<br />
–––——————–––––––––———<br />
Total non-current liabilities (2,527.1) (2,076.5)<br />
–––——————–––––––––———<br />
Current liabilities<br />
Overdrafts (9.0) (2.1)<br />
Interest-bearing loans and borrowings (174.8) (32.8)<br />
Trade and other payables (209.2) (162.4)<br />
Income tax payable (46.2) (30.4)<br />
Provisions (310.8) (17.2)<br />
–––——————–––––––––———<br />
Total current liabilities (750.0) (244.9)<br />
–––——————–––––––––———<br />
TOTAL LIABILITIES (3,277.1) (2,321.4)<br />
–––——————–––––––––———<br />
NET ASSETS 5,023.7 3,753.8<br />
–––——————–––––––––———<br />
Equity<br />
Issued capital 119.0 104.4<br />
Share premium 338.8 297.2<br />
Reserves 411.4 412.4<br />
Retained earnings 3,863.1 2,776.9<br />
–––——————–––––––––———<br />
Shareholders’ funds 4,732.3 3,590.9<br />
Minority interest 291.4 162.9<br />
–––——————–––––––––———<br />
TOTAL EQUITY 5,023.7 3,753.8<br />
–––——————–––––––––———<br />
<strong>The</strong> above statement, prepared under IFRS accounting standards, is translated at the closing exchange rate for the relevant year.<br />
109
CONSOLIDATED INCOME STATEMENT PRESENTED IN EUROS<br />
for the year ended 31 December 2006<br />
2006 2005<br />
€m €m<br />
–––——————–––––––––———<br />
Total revenue 517.6 571.0<br />
–––——————–––––––––———<br />
Gross rental income 156.7 141.3<br />
Property outgoings (61.0) (67.0)<br />
–––——————–––––––––———<br />
Net rental income 95.7 74.3<br />
Other income 77.6 43.7<br />
Administrative expenses (111.2) (77.8)<br />
Loss on trading and development properties (259.1) (10.7)<br />
Gains on other investments 0.4 –<br />
Gains on revaluation and sale of investment property 761.0 360.2<br />
Impairment of goodwill (0.3) (4.8)<br />
Share of profit of joint ventures 219.5 177.5<br />
Share of loss of associates (6.7) –<br />
–––——————–––––––––———<br />
Profit from operations including share of joint ventures and associates 776.9 562.4<br />
Dividend income 1.6 0.4<br />
Financial income 28.3 31.3<br />
Financial expenses (60.4) (56.8)<br />
–––——————–––––––––———<br />
Net financing costs (30.5) (25.1)<br />
–––——————–––––––––———<br />
Profit before tax 746.4 537.3<br />
Current tax (29.5) (12.4)<br />
Deferred tax (182.5) (137.9)<br />
–––——————–––––––––———<br />
Profit for the year 534.4 387.0<br />
–––——————–––––––––———<br />
Attributable to:<br />
Equity holders of the parent 509.3 367.1<br />
Minority interest 25.1 19.9<br />
–––——————–––––––––———<br />
Profit for the year 534.4 387.0<br />
–––——————–––––––––———<br />
<strong>The</strong> above statement, prepared under IFRS accounting standards, is translated, at the average exchange rate for the relevant year.<br />
110
CONSOLIDATED BALANCE SHEET PRESENTED IN EUROS<br />
as at 31 December 2006<br />
2006 2005<br />
€m €m<br />
–––——————–––––––––———<br />
ASSETS<br />
Non-current assets<br />
Investment property 3,360.8 2,817.7<br />
Investment property under development 127.0 103.9<br />
Other property, plant and equipment 64.0 49.2<br />
Investments in joint ventures 1,466.8 1,149.8<br />
Investment in associates 91.7 42.7<br />
Other financial assets 74.2 103.3<br />
Intangible assets 7.3 5.7<br />
Deferred tax assets 97.7 138.3<br />
–––——————–––––––––———<br />
Total non-current assets 5,289.5 4,410.6<br />
–––——————–––––––––———<br />
Current assets<br />
Trading properties 72.3 50.2<br />
Trade and other receivables 197.5 109.9<br />
Other financial assets 14.0 –<br />
Income tax receivable 45.6 18.4<br />
Cash and cash equivalents 675.9 561.1<br />
–––——————–––––––––———<br />
Total current assets 1,005.3 739.6<br />
–––——————–––––––––———<br />
TOTAL ASSETS 6,294.8 5,150.2<br />
LIABILITIES<br />
Non-current liabilities<br />
Interest-bearing loans and borrowings (839.5) (807.9)<br />
Trade and other payables (229.5) (256.2)<br />
Employee benefits (23.4) (40.5)<br />
Deferred tax liabilities (824.0) (655.8)<br />
–––——————–––––––––———<br />
Total non-current liabilities (1,916.4) (1,760.4)<br />
–––——————–––––––––———<br />
Current liabilities<br />
Overdrafts (6.8) (1.7)<br />
Interest-bearing loans and borrowings (132.5) (27.8)<br />
Trade and other payables (158.7) (137.8)<br />
Income tax payable (35.0) (25.7)<br />
Provisions (235.7) (14.6)<br />
–––——————–––––––––———<br />
Total current liabilities (568.7) (207.6)<br />
–––——————–––––––––———<br />
TOTAL LIABILITIES (2,485.1) (1,968.0)<br />
–––——————–––––––––———<br />
NET ASSETS 3,809.7 3,182.2<br />
–––——————–––––––––———<br />
Equity<br />
Issued capital 90.2 88.5<br />
Share premium 256.9 251.9<br />
Reserves 312.0 349.6<br />
Retained earnings 2,929.5 2,354.1<br />
–––——————–––––––––———<br />
Shareholders’ funds 3,588.6 3,044.1<br />
Minority interest 221.1 138.1<br />
–––——————–––––––––———<br />
TOTAL EQUITY 3,809.7 3,182.2<br />
–––——————–––––––––———<br />
Group<br />
Group<br />
<strong>The</strong> above statement, prepared under IFRS accounting standards, is translated at the closing exchange rate for the relevant year.<br />
111
PROPERTY PORTFOLIO<br />
SUMMARY<br />
PORTFOLIO ANALYSIS – PROPRIETARY ASSETS<br />
Development<br />
Investment properties<br />
––––––––––––––––––––––––––––––––––––––––––––––––––––––––<br />
programme<br />
–––––––––—————<br />
assets<br />
––––––—<br />
Total<br />
––––––—<br />
Number Value Passing ERV Running Number Completed Carrying<br />
rent yield cost value<br />
No. £m £m £m % No. £m £m £m<br />
–––––––––––––––––––––––––––––––––––––––––––––––––––––––––––––––––––––––—————––––––––––––––———<br />
Britain & Ireland<br />
Office 287 873.1 35.5 50.8 4.1% 6 20.3 – 893.4<br />
Retail 134 630.6 25.6 35.9 4.1% 6 671.0 – 1,301.6<br />
Residential * 346 639.0 11.1 n/a 1.7%<br />
––––––––––––––––––––––––––––––––– ––––––––– –––––––––––<br />
8 122.1 – 761.1<br />
––––––––––––––––––––––––––––––––––—————<br />
767 2,142.7 72.2 n/a 3.4%<br />
––––––––––––––––––––––––––––––––– ––––––––– –––––––––––<br />
20 813.4 – 2,956.1<br />
––––––––––––––––––––––––––––––––––—————<br />
Americas<br />
Office 8 122.6 7.8 10.0 6.4% 2 33.6 0.8 157.0<br />
Retail 41 256.6 15.0 19.2 5.8% 3 57.1 – 313.7<br />
Residential 3 43.9 2.7 3.2 6.1% 2 92.7 14.7 151.3<br />
Industrial 11 51.6 2.9 2.9 5.6% – – – 51.6<br />
Car parks 1 35.1 2.7 2.7 7.7%<br />
––––––––––––––––––––––––––––––––– ––––––––– –––––––––––<br />
– – – 35.1<br />
––––––––––––––––––––––––––––––––––—————<br />
64 509.8 31.1 38.0 6.1%<br />
––––––––––––––––––––––––––––––––– ––––––––– –––––––––––<br />
7 183.4 15.5 708.7<br />
––––––––––––––––––––––––––––––––––—————<br />
Continental Europe<br />
Office 2 43.3 1.7 1.7 4.0% 2 53.0 – 96.3<br />
Retail 109 989.3 58.2 60.0 5.9% 13 332.5 – 1,321.8<br />
Industrial – – – – –<br />
––––––––––––––––––––––––––––––––– ––––––––– –––––––––––<br />
6 47.3 – 47.3<br />
––––––––––––––––––––––––––––––––––—————<br />
111 1,032.6 59.9 61.7 5.8%<br />
––––––––––––––––––––––––––––––––– ––––––––– –––––––––––<br />
21 432.8 – 1,465.4<br />
––––––––––––––––––––––––––––––––––—————<br />
Australia Asia Pacific<br />
Office 4 119.9 7.9 9.3 6.6% 2 62.4 4.1 186.4<br />
Retail 1 7.6 0.3 0.3 3.9% – – 16.1 23.7<br />
Residential 24 23.1 1.2 1.2 5.2% 3 61.7 4.6 89.4<br />
Industrial 11 41.3 3.1 3.2 7.5% 1 6.1 – 47.4<br />
Car parks 2 43.3 1.5 1.5 3.5%<br />
––––––––––––––––––––––––––––––––– ––––––––– –––––––––––<br />
– – – 43.3<br />
––––––––––––––––––––––––––––––––––—————<br />
42 235.2 14.0 15.5 6.0%<br />
––––––––––––––––––––––––––––––––– ––––––––– –––––––––––<br />
6 130.2 24.8 390.2<br />
––––––––––––––––––––––––––––––––––—————<br />
<strong>Grosvenor</strong> Fund Management<br />
(investment in fund vehicles)<br />
Office 1 0.9 n/a n/a n/a – – 8.1 9.0<br />
Retail 1 1.3 n/a n/a n/a<br />
––––––––––––––––––––––––––––––––– ––––––––– –––––––––––<br />
8.1 9.4<br />
––––––––––––––––––––––––––––––––––—————<br />
2 2.2 n/a n/a n/a<br />
––––––––––––––––––––––––––––––––– ––––––––– –––––––––––<br />
– – 16.2 18.4<br />
––––––––––––––––––––––––––––––––––—————<br />
Total Group<br />
Office 302 1,159.8 52.9 71.8 4.6% 12 169.3 13.0 1,342.1<br />
Retail 286 1,885.4 99.1 115.4 5.3% 22 1,060.6 24.2 2,970.2<br />
Residential 373 706.0 15.0 n/a 2.1% 13 276.5 19.3 1,001.8<br />
Industrial 22 92.9 6.0 6.1 6.5% 7 53.4 – 146.3<br />
Car parks 3 78.4 4.2 4.2 5.4%<br />
––––––––––––––––––––––––––––––––– ––––––––– –––––––––––<br />
– – – 78.4<br />
––––––––––––––––––––––––––––––––––—————<br />
986 3,922.5 177.2 n/a 4.5% 54 1,559.8 56.5 5,538.8<br />
––––––––––––––––––––––––––––––––– ––––––––– ––––––––––– ––––––––––––––––––––––––––––––––––—————<br />
* <strong>The</strong> majority of the residential portfolio in Britain & Ireland is ground rented (low fixed rent).<br />
<strong>The</strong> average yield on the rack rented residential portfolio is 3.8%.<br />
Financial<br />
112
PROPERTY PORTFOLIO<br />
SUMMARY<br />
GEOGRAPHIC ANALYSIS – PROPRIETARY ASSETS<br />
Investment Development Financial Total<br />
properties programme assets<br />
£m £m £m £m<br />
––––––––––––––––—————––––––––––––––———<br />
Britain & Ireland<br />
West End 1,707.5 95.7 – 1,803.2<br />
City 19.0 – – 19.0<br />
Outside London 416.2 717.7 – 1,133.9<br />
––––––––––––––––—————––––––––––––––———<br />
2,142.7 813.4 – 2,956.1<br />
––––––––––––––––—————––––––––––––––———<br />
Americas<br />
USA 316.4 45.6 6.2 368.2<br />
Canada 193.4 137.8 9.3 340.5<br />
––––––––––––––––—————––––––––––––––———<br />
509.8 183.4 15.5 708.7<br />
––––––––––––––––—————––––––––––––––———<br />
Continental Europe<br />
France 109.0 – – 109.0<br />
Spain 267.1 265.2 – 532.3<br />
Portugal 562.7 18.7 – 581.4<br />
Italy 45.3 56.9 – 102.2<br />
Germany – 81.2 – 81.2<br />
Greece 10.0 10.8 – 20.8<br />
Brazil 38.5 – – 38.5<br />
––––––––––––––––—————––––––––––––––———<br />
1,032.6 432.8 – 1,465.4<br />
––––––––––––––––—————––––––––––––––———<br />
Australia Asia Pacific<br />
Australia 193.4 73.6 – 267.0<br />
Hong Kong 17.2 37.5 12.8 67.5<br />
Japan 24.6 19.1 – 43.7<br />
Singapore – – 12.0 12.0<br />
––––––––––––––––—————––––––––––––––———<br />
235.2 130.2 24.8 390.2<br />
––––––––––––––––—————––––––––––––––———<br />
<strong>Grosvenor</strong> Fund Management<br />
Investment in fund vehicles 2.2 – 16.2 18.4<br />
––––––––––––––––—————––––––––––––––———<br />
2.2 – 16.2 18.4<br />
––––––––––––––––—————––––––––––––––———<br />
Total Group<br />
3,922.5 1,559.8 56.5 5,538.8<br />
––––––––––––––––—————––––––––––––––———<br />
113
PROPERTY PORTFOLIO<br />
BRITAIN & IRELAND<br />
<strong>Grosvenor</strong> Britain & Ireland has an interest in a portfolio of assets across 300 acres of Mayfair and Belgravia. More than 760 retail, residential and commercial<br />
properties make up the portfolio. It is not practical to list all these assets. However, the table below shows assets held outside London, large individual<br />
properties in the London portfolio and assets grouped at street-level that are strategic locations on the London Estate.<strong>The</strong> ownership of some of these<br />
strategic locations lies with <strong>Grosvenor</strong> family trusts.<strong>The</strong> number of assets on each street, together with the total floor area, is recorded in the table below.<br />
Property Description Location Area sq m<br />
Investment properties – directly or Trust owned<br />
Chantry House Residential apartment block West End, London, UK 5,100<br />
Duke Street 19 offices, 20 exclusive apartments and 24 retail units. West End, London, UK 25,300<br />
Eaton Square Residential units on 6 floors in historic West End, London, UK 68,200<br />
Grade 2* listed buildings<br />
Ebury Street 25 offices, 86 residential and 48 retail units West End, London, UK 6,400<br />
Elizabeth Street 5 offices, 28 residential and 58 retail units West End, London, UK 2,000<br />
on historic Georgian street<br />
Erskine House Residential apartment block West End, London, UK 1,000<br />
<strong>Grosvenor</strong> Square 52 units, of which 19 are offices and 34 are residential West End, London, UK 71,600<br />
4/8 <strong>Grosvenor</strong> Street 6 floor office building with 5 retail units West End, London, UK 2,900<br />
& 30/32 Avery Row<br />
73 <strong>Grosvenor</strong> Street 6 floor refurbished and partly rebuilt office building West End, London, UK 1,300<br />
75 <strong>Grosvenor</strong> Street 6 floor refurbished and partly rebuilt office building West End, London, UK 1,500<br />
<strong>Grosvenor</strong> Hill Court 2 floor office building with 30 residential units above West End, London, UK 7,300<br />
and car park<br />
Mount Street 21 offices, 33 residential, 28 retail West End, London, UK 70,600<br />
Motcomb Street 4 offices, 26 residential units and 41 retail units West End, London, UK 9,600<br />
16/20North Audley Street 6 floor refurbished and partly rebuilt office building West End, London, UK 11,300<br />
97/99 Park Street Residential apartment block West End, London, UK 1,600<br />
Peterson House, 25 Gilbert Street Residential apartment block West End, London, UK 1,500<br />
Pimlico Road 1 office, 14 residential units and 60 retail units West End, London, UK 1,200<br />
St. Anselm House, 65 Davies Street 8 floor 1930's office building West End, London, UK 7,800<br />
Terminal House, 52 <strong>Grosvenor</strong> Gardens 7 floor office building with 9 retail units West End, London, UK 8,200<br />
This analysis excludes Operating Companies’ interests in properties managed by <strong>Grosvenor</strong> Fund Management.<br />
114
PROPERTY PORTFOLIO<br />
BRITAIN & IRELAND (continued)<br />
Property Description Location Area sq m<br />
Investment properties – held in joint ventures<br />
<strong>Grosvenor</strong> Street Comprising 113 units of which 85 are offices, West End, London, UK 57,600<br />
13 are residential and 15 are retail.<br />
10 <strong>Grosvenor</strong> Street 6 floor open plan office building West End, London, UK 5,300<br />
Liffey Valley Shopping Centre Regional shopping centre with 94 retail units and cinema Dublin, Republic of Ireland 36,300<br />
Viewpoint - Mayfair 9 floor open plan refurbished office building with West End, London, UK 4,600<br />
3 retail units in Oxford Street<br />
Development properties – directly owned<br />
Montrose Place Residential apartment block West End, London, UK 60,000<br />
Preston £600m retail-led mixed use urban regeneration scheme Preston, Lancashire, UK 145,900<br />
Development properties – held in joint ventures and associates<br />
Bankside Residential apartment block Central London, UK 66,000<br />
Edinburgh Technopole Science Park Edinburgh, Scotland, UK 46,500<br />
Fountain North Mixed use city centre scheme Edinburgh, Scotland, UK 83,200<br />
Grand Arcade Mixed use city centre development Cambridge, East Anglia, England 41,800<br />
Liverpool One £600m retail-led, mixed-use urban regeneration project. Liverpool, Merseyside, UK 191,000<br />
Pacific Quay 15 acres of commercial development at the heart Glasgow, Scotland, UK 46,500<br />
of Glasgow’s new urban business district<br />
This analysis excludes Operating Companies’ interests in properties managed by <strong>Grosvenor</strong> Fund Management.<br />
115
PROPERTY PORTFOLIO<br />
AMERICAS<br />
Property Description Location Area sq m<br />
Investment properties – directly owned<br />
Annacis Business Park Warehouse and distribution park Vancouver, B.C., Canada 80,500<br />
Ascent Multiple low-rise apartment buildings containing 90 units Seattle,WA, USA 7,000<br />
Bow Parkade 2 multi-level parking structures (1,000 parking spaces) Calgary, AB, Canada 2,400<br />
with ground floor retail<br />
Chelsea at Juanita Village 2 mid-rise apartment buildings containing 196 units and Seattle,WA, USA 14,800<br />
ground floor retail<br />
Crowfoot Corner Community shopping centre Calgary, AB, Canada 5,800<br />
Crowfoot Village Community shopping centre Calgary, AB, Canada 4,700<br />
1777 F Street 8-storey office building Washington, D.C., USA 5,500<br />
<strong>The</strong> <strong>Grosvenor</strong> Building 22 storey office building with retail space and parking Vancouver, B.C., Canada 18,900<br />
Los Gatos Village Square Neighbourhood shopping centre Los Gatos, CA, USA 4,200<br />
Sancerre Multiple low-rise apartment buildings comprising 140 units Seattle, WA, USA 10,500<br />
1799 Union Street 2-storey retail and office building San Francisco, CA, USA 1,200<br />
1944 Union Street Single building restaurant building San Francisco, CA, USA 400<br />
Venator Building Urban retail building Calgary, AB, Canada 2,300<br />
Viscount & Viceroy 2 low-rise apartment buildings comprising 26 units Calgary, AB, Canada 1,600<br />
Walnut Gate Neighbourhood retail centre Langley, B.C., Canada 2,500<br />
Westgate West Neighbourhood shopping centre San Jose, CA, USA 21,900<br />
Investment properties – held in joint ventures and associates<br />
Best Buy Metro Center Community shopping centre Springfield,VA, USA 9,800<br />
Broadmead Village Shopping Centre Neighbourhood retail centre Saanich, B.C., Canada 11,800<br />
Carlyle Gateway I & II Two 6-storey office buildings with ground floor retail Alexandria,VA, USA 23,200<br />
Church Street Plaza Community lifestyle centre Evanston, IL, USA 16,400<br />
Coventry Hills Shopping Centre Community retail centre Calgary, AB, Canada 12,200<br />
DC Urban Retail Portfolio Retail portfolio comprising 17 buildings Washington, D.C., USA 42,900<br />
2 North Lake 11-storey office building, 3-storey historic building and Pasadena, CA, USA 20,500<br />
an 8-storey split-level garage<br />
830 North Michigan Avenue 6-storey urban retail building Chicago, IL, USA 11,600<br />
1701 Pennsylvania Avenue, N.W. 12-storey office building with ground floor retail and parking Washington, D.C., USA 17,700<br />
180 Post Street Urban retail building San Francisco, CA, USA 2,700<br />
251 Post Street Urban retail/office building San Francisco, CA, USA 3,400<br />
Rice Lake Square 9 building community retail centre Wheaton, IL, USA 23,400<br />
308 – 310 N. Rodeo Drive Urban retail building Beverly Hills, CA, USA 1,400<br />
South Edmonton Common Regional ‘power centre’ Edmonton, AB, Canada 16,800<br />
South Point Exchange Community shopping centre Surrey, B.C., Canada 20,600<br />
USCO Distribution Facility Single floor warehouse/distribution building Calgary, AB Canada 28,100<br />
Valley River Center 2 building retail centre with theatre Eugene, OR, USA 96,000<br />
This analysis excludes Operating Companies’ interests in properties managed by <strong>Grosvenor</strong> Fund Management.<br />
116
PROPERTY PORTFOLIO<br />
AMERICAS (continued)<br />
Property Description Location Area sq m<br />
Principal developments – directly owned<br />
15th Avenue/7th Street (Beltline Site) High rise (17 storey) residential development site Calgary, AB, Canada 10,500<br />
comprising 98 units<br />
5955 Balsam Mid rise (12 storey) luxury residential development Vancouver, B.C., Canada 6,800<br />
comprising 42 units<br />
Hamilton Marketplace 8.93 acre site, planned for a 90,000 sq ft Novato, CA, USA 8,400<br />
grocery-anchored Neighbourhood retail centre<br />
Melcor Site High rise (20 storey) residential development site Calgary, AB, Canada 25,900<br />
comprising 320 units in two towers<br />
Triangle Assembly Low rise (4 storey) residential development site comprising Surrey, B.C., Canada 22,100<br />
220 units<br />
Principal developments – held in joint ventures<br />
Avondale (Lions Gate Hospital Site) Low rise residential development comprising 83 units North Vancouver, B.C., Canada 9,000<br />
<strong>The</strong> Boulevard @ South Point Exchange Fashion oriented lifestyle centre Surrey, B.C., Canada 3,100<br />
High Street @ South Point Exchange Mixed use development comprising 88 residential units and Surrey, B.C., Canada 9,300<br />
17,000 s.f. of retail<br />
<strong>The</strong> RISE (2300 Cambie Street) Mixed use commercial and residential urban development Vancouver, B.C., Canada 25,900<br />
185 Post Street 6 storey retail urban re-development San Francisco, CA, USA 2,400<br />
South Edmonton Common ‘Big Box’ retail development expansion Edmonton, AB, Canada 223,000<br />
<strong>The</strong> Village @ South Point Exchange Community oriented main street retail and residential Surrey, B.C., Canada 47,900<br />
development<br />
WesTech Restaurant Park In-line retail building and 5 restaurant and bank “pad” sites Silver Spring, MD, USA 3,900<br />
This analysis excludes Operating Companies’ interests in properties managed by <strong>Grosvenor</strong> Fund Management.<br />
117
PROPERTY PORTFOLIO<br />
CONTINENTAL EUROPE<br />
Property Description Location Area sq m<br />
Investment properties – directly owned<br />
Paris Antiques market Two galleries with 450 small retail units Paris, France 8,300<br />
Principal Investment properties – held by joint ventures<br />
Airone Shopping centre with 42 retail units Monselice, Italy 9,900<br />
AlgarveShopping Shopping centre with 133 retail units Guia, Portugal 42,400<br />
ArrábidaShopping Shopping centre with 180 retail units Vila Nova de Gaia, Portugal 56,400<br />
Avenida M40 Shopping centre with 136 retail units Leganés, Madrid, Spain 48,300<br />
Boavista Shopping Shopping centre with 182 retail units São Paulo, Brazil 23,900<br />
CascaiShopping Shopping centre with 169 retail units Cascais, Portugal 72,200<br />
Centro Colombo Shopping centre with 427 retail units Lisbon, Portugal 120,000<br />
CoimbraShopping Shopping centre with 69 retail units Coimbra, Portugal 26,500<br />
Dos Mares Shopping and leisure centre with 84 retail units San Javier, Spain 24,300<br />
Estaçao Viana Shopping Shopping centre with 114 retail units Viana do Castelo, Portugal 65,500<br />
La Farga Shopping and leisure centre with 128 retail units Barcelona, Spain 18,600<br />
Faubourg Saint-Honoré, 68 Office building with 9 tenants Paris, France 9,600<br />
Franca Shopping Shopping centre with 95 retail units São Paulo, Brazil 18,200<br />
GaiaShopping Shopping centre with 167 retail units Vila Nova de Gaia, Portugal 59,700<br />
Grancasa Shopping centre with 166 retail units Zaragoza, Spain 79,400<br />
GuimarãeShopping Shopping centre with 92 retail units Guimarães, Portugal 26,900<br />
LoureShopping Shopping centre with 123 retail units Loures, Portugal 39,000<br />
Luz del Tajo Shopping centre with 134 retail units Toledo, Spain 45,600<br />
MadeiraShopping Shopping centre with 112 retail units Funchal, Portugal 26,600<br />
MaiaShopping Shopping centre with 112 retail units Maia, Portugal 30,900<br />
Max Centre Shopping centre with 159 retail units Bilbao, Spain 59,400<br />
Mediterranean Cosmos Shopping and leisure centre with 209 retail units <strong>The</strong>ssaloniki, Greece 46,000<br />
Metrópole Shopping centre with 131 retail units São Paulo, Brazil 23,600<br />
NorteShopping Shopping centre with 289 retail units Porto, Portugal 71,900<br />
Parque Atlântico Shopping and leisure centre with 104 retail units Ponta Delgado, Portugal 22,300<br />
Parque Dom Pedro Shopping centre with 390 retail units Campinas, Brazil 107,000<br />
Parque Principado Shopping centre with 159 retail units Oviedo, Spain 76,800<br />
Pátio Brazil Shopping centre with 167 retail units Brasilia, Brazil 28,500<br />
Penha Shopping Shopping centre with 191 retail units São Paulo, Brazil 26,400<br />
Plaza Eboli Shopping centre with 97 retail units Pinto, Spain 28,500<br />
Plaza Mayor Shopping and leisure centre with 99 retail units Malaga, Spain 33,300<br />
Plaza Sul Shopping centre with 238 retail units Jd.Saúde, Brazil 27,100<br />
Rio Sul Shopping and leisure centre with 137 retail units Seixal, Portugal 39,700<br />
SerraShopping Shopping centre with 86 retail units Lugar da Qta. do Pinheiro, Portugal 17,700<br />
Tivoli Shopping centre with 265 retail units São Paulo, Brazil 22,500<br />
Valecentre Shopping centre with 91 retail units Macron, Italy 26,700<br />
Valle Real Shopping centre with 102 retail units Santander, Spain 47,700<br />
Vasco da Gama Shopping centre with 164 retail units Lisbon, Portugal 47,600<br />
ViaCatarinaShopping Shopping centre with 100 retail units Porto, Portugal 11,900<br />
Warner Village Leisure centre with 5 retail units Marcon, Italy 11,700<br />
Zubiarte Shopping and leisure centre with 79 retail units Bilbao, Spain 20,700<br />
This analysis excludes Operating Companies’ interests in properties managed by <strong>Grosvenor</strong> Fund Management.<br />
118
PROPERTY PORTFOLIO<br />
CONTINENTAL EUROPE (continued)<br />
Property Description Location Area sq m<br />
Principal Development properties – held by joint ventures<br />
Alexa City centre retail development Berlin, Germany 56,000<br />
Arganda Industrial development Arganda, Spain 14,900<br />
Colombo Towers Office development Lisbon, Portugal 48,000<br />
Coslada 2 Industrial development Coslada, Spain 18,700<br />
Coslada 3 Industrial development Coslada, Spain 11,000<br />
El Rosal Shopping centre development Ponferrada, Spain 49,100<br />
Freccia Rossa Retail and leisure development Brescia, Italy 30,300<br />
Galatsi Shopping centre development Athens, Greece 39,000<br />
Gli Orsi Shopping centre development Biella, Italy 27,000<br />
Lima Retail Park Shopping centre development Viana, Portugal 10,700<br />
Omega Office development Madrid, Spain 50,700<br />
Pinto Industrial development Pinto, Spain 18,800<br />
Plaza Mayor Shopping Expansion of existing shopping centre Málaga, Spain 18,800<br />
São Jão da Madeira Shopping centre development SJ Madeira, Portugal 19,800<br />
Torrejon Industrial development Torrejon, Spain 44,800<br />
Valencia Industrial development Valencia, Spain 13,300<br />
Weiterstadt Shopping centre development Weiterstadt, Germany 61,300<br />
This analysis excludes Operating Companies’ interests in properties managed by <strong>Grosvenor</strong> Fund Management.<br />
119
PROPERTY PORTFOLIO<br />
AUSTRALIA ASIA PACIFIC<br />
Property Description Location Area sq m<br />
Investment properties – directly owned<br />
Abbot Road, Seven Hills Retail Trade Outlet Sydney, Australia 7,500<br />
Cinema Centre Car Park Car park with 906 spaces Sydney, Australia 26,800<br />
114 Flinders Street Car park with 864 spaces plus 2500m 2 of office Melbourne, Australia 28,800<br />
151&153 Glendenning Road 2 industrial distribution buildings Sydney, Australia 12,000<br />
20 Hunter Street ‘A’ grade office building Sydney, Australia 10,000<br />
2828-2840 Ipswich Road Industrial warehouse Brisbane, Australia 13,900<br />
61 Plumpton Road Industrial distribution building Sydney, Australia 10,000<br />
22-34 Rosebery Avenue Industrial warehouse Sydney, Australia 5,700<br />
259 Queen Street ‘A+’ grade office building Brisbane, Australia 24,700<br />
Vienna Apartment High-end serviced apartment building Shanghai, China 13,800<br />
Yoshiyasu-kanda Office Office in Chiyoda-ku,Tokyo Japan 3,200<br />
Investment properties – held in joint ventures<br />
15/F Lippo Centre I Office on 15th floor of Lippo Tower Hong Kong 1,200<br />
Sir Joseph Banks Corporate Park Hi Tech business park Sydney, Australia 32,000<br />
Kichijoji Town retail in suburban Tokyo Japan 1,400<br />
Development properties – directly owned<br />
Banyo Residential and industrial sub-division (*land area) Brisbane, Australia 136,700*<br />
19-21 Church Street, 20-23 Tomaree Street 58 Serviced apartments Nelson Bay, Australia 8,300<br />
Development properties – held in joint ventures<br />
103 Castle Peak Road Residential development Castle Peak, Hong Kong 16,200<br />
400 George Street Office development Brisbane, Australia 41,400<br />
25 Smith Street Office development Parramatta, Australia 11,000<br />
Kamizonocho Residential development Tokyo, Japan 17,900<br />
This analysis excludes Operating Companies’ interests in properties managed by <strong>Grosvenor</strong> Fund Management.<br />
120
PROPERTY PORTFOLIO<br />
PROPERTIES MANAGED BY GROSVENOR FUND MANAGEMENT<br />
Property Description Location Area sq m<br />
<strong>Grosvenor</strong> Shopping Centre Fund<br />
Coopers Square Covered shopping centre with 70 retail outlets Burton-on-Trent, East Midlands, UK 35,800<br />
Dolphin Centre Shopping centre with 125 retail units Poole, Dorset, UK 46,100<br />
<strong>The</strong> Eastgate Centre Covered shopping centre with 65 retail units Inverness, Scotland, UK 38,100<br />
Freshney Place Single level covered shopping centre with 100 retail outlets Grimsby, Lincolnshire, UK 46,500<br />
<strong>Grosvenor</strong> London Office Fund<br />
Almack House, King Street 7 floor 1990s office building West End, London, UK 9,300<br />
Belgrave House 8 floor open plan office building West End, London, UK 25,500<br />
40 <strong>Grosvenor</strong> Place 6 floor open plan office building West End, London, UK 18,600<br />
25 Moorgate 7 floor open plan office building City, London, UK 7,700<br />
<strong>Grosvenor</strong> Festival Place Fund<br />
Festival Place, Basingstoke Covered two level shopping centre with 195 shops, Basingstoke, Hampshire, UK 96,700<br />
restaurants and cafes<br />
Talbot Residential Investment Fund<br />
Astwick Manor 8 three bedroom townhouses Hatfield, Hertfordshire, UK 1,100<br />
Beaumont House 8 unit residential building Willesden Green, London, UK 300<br />
Belgrave House 19 unit residential building Pimlico, London, UK 900<br />
Bridge Court 13 two bedroom flats Welwyn Garden City, 800<br />
Hertfordshire, UK<br />
<strong>Grosvenor</strong> House 9 two bedroom flats; 2 three bedroom flats Cheltenham, Gloucestershire, UK 1,000<br />
23 Hulse Road 16 two bedroom apartments Southampton, Hampshire, UK 1,200<br />
<strong>The</strong> Rosery 3 one bedroom flats; 5 two bedroom flats Worcester, Worcestershire, UK 500<br />
Trenchard Close 18 two bedroom terraced houses Stanmore, Middlesex, UK 1,300<br />
<strong>Grosvenor</strong> Retail European Property<br />
10 rue d’Alsace Lorraine High street retail unit Toulouse, France 700<br />
19 rue d’Alsace Lorraine High street retail unit Toulouse, France 600<br />
6 Avenue Pierre Brosselette Three retail units Cannes, France 400<br />
Porte de Chatillon Retail warehouse unit and shopping gallery Malakoff, France 5,800<br />
48 rue de la Chaussée d’Antin Retail space located in one of the prime retail areas of Paris Paris, France 300<br />
Cisalfa Portfolio One town centre and one warehouse retail unit Bergamo, Italy 5,800<br />
French retail warehouse portfolio Three retail warehouse parks with a total of 15 units Bondy, Bourges, France 16,300<br />
15-19 Place Gambetta Four storey Virgin Megastore Bordeaux, France 5,500<br />
28-30 Avenue George V Three restaurant units Paris, France 2,000<br />
Lyon Jacobins Retail space divided into ten small boutiques and a restaurant Lyon, France 900<br />
10 Place du Marché Town centre retail gallery with 7 units Thionville, France 2,200<br />
Place du RER Two retail warehouse style units Saint Ouen, France 3,100<br />
102 rue de Rivoli High street retail unit Paris, France 1,100<br />
Rue Jean Monnet Retail warehouse park with 17 units Claye Souilly, France 16,900<br />
SPIIC Portfolio Portfolio of 11 French high street retail properties with Bordeaux,Toulouse, Avignon, 18,600<br />
a total of 23 units<br />
Paris; France<br />
Transeuropean Retail Warehouses Portfolio of 8 retail warehouses Belgium and Luxembourg 11,300<br />
Avenue de l’Avenir, Avenue de Lézennes Retail warehouse park with 7 units and office space Villeneuve d’Ascq, France 10,500<br />
121
PROPERTY PORTFOLIO<br />
PROPERTIES MANAGED BY GROSVENOR FUND MANAGEMENT (continued)<br />
Property Description Location Area sq m<br />
<strong>Grosvenor</strong> Land Property Fund<br />
Chester Court 12 unit residential building Hong Kong 1,700<br />
15C Fairlane Tower 1 residential unit Hong Kong 100<br />
46C Tavistock II 1 residential unit Hong Kong 200<br />
<strong>Grosvenor</strong> Diamond Capital – Stable Residential Fund<br />
Chester Court, Nihonbashi 104 unit residential building Tokyo, Japan 4,900<br />
Chester Court, Sengoku 23 unit residential building Tokyo, Japan 1,500<br />
Chester House Funabori 54 unit residential building Tokyo, Japan 1,300<br />
Chester House, Mejiro 18 unit residential building Tokyo, Japan 400<br />
Chester House Yoyogi 28 unit residential building Tokyo, Japan 1,200<br />
Mayfair Court, Nishiazabu 9 unit residential building Tokyo, Japan 1,300<br />
Mayfair Court, Roppongi 11 unit residential building Tokyo, Japan 1,900<br />
KJ Maison Kishine Koen 70 unit residential building Kanagawa, Japan 1,400<br />
Vert Varie Kitasando 144 unit residential building Tokyo, Japan 5,000<br />
<strong>Grosvenor</strong> Capital Advisers Partnership<br />
Buena Vista Shimiz 33 unit residential building Osaka, Japan 2,300<br />
Chester Court, Honkomagome 36 unit residential building Tokyo, Japan 2,200<br />
Chester Court, Kasuga 68 unit residential building Tokyo, Japan 3,600<br />
Chester Court, Mitsukoshimae 36 unit residential building Tokyo, Japan 1,400<br />
Chester House, Nishimagome 52 unit residential building Tokyo, Japan 1,600<br />
Hakusan Heights 32 unit residential building Tokyo, Japan 2,700<br />
Modulor Asagaya 32 unit residential building Tokyo, Japan 1,000<br />
Modulor Shirokane 36 unit residential building Tokyo, Japan 1,000<br />
Rafine Yotsubashi 19 unit residential building Osaka, Japan 2,200<br />
Takanawa Compound 6 unit residential building Tokyo, Japan 1,400<br />
Toei Building 47 unit residential building Kanagwa, Japan 1,300<br />
Yoyogi Uehara Terrace 5 unit residential building Tokyo, Japan 1,000<br />
ISPT <strong>Grosvenor</strong> International Property Trust<br />
L’Anec Blau Covered Shopping Centre over 3 levels Barcelona, Spain 27,800<br />
4501 N. Fairfax Drive 9 floor office building Arlington,VA, USA 18,100<br />
ParkRidge Four 6 floor office building Littleton, CO, USA 17,900<br />
<strong>The</strong> River Shopping Centre with 41 units Rancho Mirage, CA, USA 21,200<br />
Shmael U.S. Real Estate Fund<br />
5505 Morehouse Drive 3 floor office building San Diego, CA, USA 6,700<br />
1350 Piccard Drive 4 floor office building Rockville, MD, USA 9,700<br />
122
PROPERTY PORTFOLIO<br />
PROPERTIES MANAGED BY GROSVENOR FUND MANAGEMENT (continued)<br />
Property Description Location Area sq m<br />
<strong>Grosvenor</strong> Investment Management US Inc. – Representative Properties Managed on Behalf of Separate Account Clients<br />
Alcoa Building 6 floor office building Pittsburgh, PA USA 21,300<br />
AtlanTech Tower 12 floor office building Ft. Lauderdale, FL, USA 48,400<br />
Benchmark Assisted Living 15 assisted living facilities with 1,181 units New England, USA 84,900<br />
1180 Church Road Office/warehouse building Lansdale, PA USA 19,000<br />
Collegeville Marriott Courtyard 130 room hotel Collegeville, PA USA 7,200<br />
Cornerstone 2 floor medical office building Warrenville, IL USA 5,900<br />
Digital Lightwave Drive 3 floor office building Clearwater, FL, USA 8,600<br />
GSW Building 3 floor office building Westerville, OH USA 9,000<br />
Heritage of Green Hills 619 unit senior housing community Reading, PA USA 58,300<br />
1500 K Street 11 floor office building Washington D.C., USA 22,600<br />
Koppers Building 31 floor office building Pittsburgh, PA USA 33,100<br />
Meadowood Apartments 296 unit residential complex San Antonio,TX USA 23,300<br />
Mifflin County Commons Retail strip center Lewistown, PA USA 18,400<br />
1200 Morris Drive 3 floor office building Wayne, PA USA 10,600<br />
79 North Industrial Industrial warehouse park with 7 buildings plus 23.4 aces Sewickley, PA USA 37,800<br />
of buildable land<br />
701 North Michigan Avenue 2 floor retail building Chicago, IL, USA 2,100<br />
Parkway 120 5 floor office building Old Bridge, NJ USA 19,000<br />
Spread Eagle Village Specialty retail center Strafford, PA USA 7,400<br />
Station Square 346 unit residential complex Lansdale, PA USA 36,100<br />
Toll Brothers Realty Trust I & II Interest in 6 projects including office, residential and retail Multiple locations, USA 209,200<br />
123
FIVE YEAR SUMMARY<br />
INCOME STATEMENT<br />
2002 2003 2004 2005 2006<br />
£m £m £m £m £m<br />
––––––––––––––––––––––––––––––––––––––—————––––––––––––––———<br />
Net rental and other income 108.0 101.1 61.7 80.8 118.1<br />
Administrative expenses (35.5) (41.5) (46.7) (53.3) (75.8)<br />
Profit/(loss) on trading and development properties 2.6 6.5 9.6 (7.3) (176.6)<br />
(Losses)/gains on other investments (17.3) 3.3 22.9 – 0.3<br />
Net gains on revaluation and sale of investment properties 24.6 37.2 198.8 246.8 518.7<br />
Impairment of goodwill – – – (3.3) (0.2)<br />
Share of profit from joint ventures 17.7 22.3 123.8 121.6 149.6<br />
Share of loss from associates – – – – (4.6)<br />
––––––––––––––––––––––––––––––––––––––—————––––––––––––––———<br />
Profit before net financing costs and tax 100.1 128.9 370.1 385.3 529.5<br />
Net financing costs (39.3) (37.2) (28.0) (17.2) (20.8)<br />
––––––––––––––––––––––––––––––––––––––—————––––––––––––––———<br />
Profit before tax 60.8 91.7 342.1 368.1 508.7<br />
––––––––––––––––––––––––––––––––––––––—————––––––––––––––———<br />
BALANCE SHEET<br />
Total property assets including share of joint ventures 2,678.0 2,728.8 3,237.3 3,727.7 4,592.4<br />
and associates<br />
––––––––––––––––––––––––––––––––––––––—————––––––––––––––———<br />
Investment property (including under development) 2,079.1 2,050.5 1,809.1 2,007.4 2,350.0<br />
Investment in joint ventures and associates 209.4 222.4 694.6 819.4 1,050.1<br />
Other financial assets 93.0 85.6 58.3 71.0 50.0<br />
Other non-current assets 28.1 23.9 100.1 132.7 113.8<br />
––––––––––––––––––––––––––––––––––––––—————––––––––––––––———<br />
2,409.6 2,382.4 2,662.1 3,030.5 3,563.9<br />
––––––––––––––––––––––––––––––––––––––—————––––––––––––––———<br />
Trading properties 81.6 94.4 44.1 34.5 48.7<br />
Cash and cash equivalents 143.9 204.0 264.2 385.5 455.4<br />
Other net current assets (21.9) 8.4 1.4 (34.2) 42.7<br />
––––––––––––––––––––––––––––––––––––––—————––––––––––––––———<br />
203.6 306.8 309.7 385.8 546.8<br />
––––––––––––––––––––––––––––––––––––––—————––––––––––––––———<br />
Borrowings (including current) (748.9) (687.6) (614.5) (575.4) (659.5)<br />
Deferred tax (30.7) (31.5) (317.9) (450.6) (555.2)<br />
Other non-current liabilities (14.0) (7.9) (130.1) (203.8) (329.2)<br />
––––––––––––––––––––––––––––––––––––––—————––––––––––––––———<br />
(793.6) (727.0) (1,062.5) (1,229.8) (1,543.9)<br />
––––––––––––––––––––––––––––––––––––––—————––––––––––––––———<br />
Net assets 1,819.6 1,962.2 1,909.3 2,186.5 2,566.8<br />
––––––––––––––––––––––––––––––––––––––—————––––––––––––––———<br />
Share capital and share premium 233.9 233.9 233.9 233.9 233.9<br />
Reserves 1,519.2 1,614.5 1,561.4 1,857.7 2,184.0<br />
––––––––––––––––––––––––––––––––––––––—————––––––––––––––———<br />
1,753.1 1,848.4 1,795.3 2,091.6 2,417.9<br />
Minority interest 66.5 113.8 114.0 94.9 148.9<br />
––––––––––––––––––––––––––––––––––––––—————––––––––––––––———<br />
Total equity 1,819.6 1,962.2 1,909.3 2,186.5 2,566.8<br />
––––––––––––––––––––––––––––––––––––––—————––––––––––––––———<br />
International Financial Reporting Standards were adopted with effect from 1 January 2004. Figures prior to 2004 are presented under UK GAAP.<br />
124
GROSVENOR OFFICES<br />
GROSVENOR GROUP<br />
London<br />
<strong>The</strong> <strong>Grosvenor</strong> Office<br />
70 <strong>Grosvenor</strong> Street<br />
London<br />
W1K 3JP<br />
England<br />
Tel: + 44 (0) 20 7408 0988<br />
Fax: + 44 (0) 20 7629 9115<br />
BRITAIN & IRELAND<br />
AMERICAS<br />
CONTINENTAL<br />
EUROPE<br />
AUSTRALIA<br />
ASIA PACIFIC<br />
GROSVENOR FUND<br />
MANAGEMENT<br />
Edinburgh<br />
22 Alva Street<br />
Edinburgh<br />
EH2 4PV<br />
Scotland<br />
Tel: + 44 (0) 131 225 5775<br />
Fax: + 44 (0) 131 225 1995<br />
Liverpool<br />
1st Floor<br />
76-78 Lord Street<br />
Liverpool<br />
L2 1TL<br />
England<br />
Tel: + 44 (0) 151 471 5020<br />
Fax: + 44 (0) 151 471 5049<br />
London<br />
70 <strong>Grosvenor</strong> Street<br />
London (as above)<br />
Philadelphia<br />
Suite 1310<br />
1600 Market Street<br />
Philadelphia PA19103<br />
USA<br />
Tel: +1 215 446 8100<br />
Fax: +1 215 446 8101<br />
San Francisco<br />
Suite 2500<br />
One California Street<br />
San Francisco<br />
California 94111<br />
USA<br />
Tel: + 1 415 434 0175<br />
Fax: + 1 415 434 2742<br />
Vancouver<br />
2000 <strong>The</strong> <strong>Grosvenor</strong> Building<br />
1040 West Georgia Street<br />
Vancouver<br />
British Columbia<br />
V6E 4HI<br />
Canada<br />
Tel: + 1 604 683 1141<br />
Fax: + 1 604 687 3235<br />
Washington, D.C.<br />
Suite 1050<br />
1701 Pennsylvania Avenue NW<br />
Washington D.C. 20006<br />
USA<br />
Tel: + 1 202 293 1235<br />
Fax: + 1 202 785 2632<br />
Luxembourg<br />
46a, avenue John F Kennedy<br />
1855 Luxembourg<br />
Luxembourg<br />
Tel: + 35 2 26005-213<br />
Fax: + 35 2 26005-803<br />
Madrid<br />
Plaza de Coló n.2,<br />
Torre 2 Planta 12B<br />
28046 Madrid<br />
Spain<br />
Tel: + 34 9 1292 0890<br />
Milan<br />
Piazzale Biancamano, 8<br />
20121 Milan<br />
Italy<br />
Tel: + 390 262 032 138<br />
Fax: + 390 262 034 000<br />
Paris<br />
5th Floor<br />
69 Boulevard Haussmann<br />
75008 Paris<br />
France<br />
Tel: + 33 (0) 1 44 51 75 00<br />
Fax: + 33 (0) 1 44 51 75 01<br />
Brisbane<br />
Level 15<br />
Waterfront Place<br />
1 Eagle Street<br />
Brisbane<br />
Queensland 4000<br />
Australia<br />
Tel: + 61 7 3220 1799<br />
Fax: + 61 7 3220 1833<br />
Hong Kong<br />
3505-09 Jardine House<br />
1 Connaught Place<br />
Central<br />
Hong Kong<br />
Tel: + 852 2956 1989<br />
Fax: + 852 2956 1889<br />
Shanghai<br />
Unit 906 Platinum,<br />
No. 233 Taicang Road<br />
Shanghai 200021<br />
China<br />
Tel: + 86 21 5306 3322<br />
Fax: + 86 21 5382 3431<br />
Sydney<br />
Level 38, Citigroup Centre<br />
2 Park Street, Sydney<br />
New South Wales 2000<br />
Australia<br />
Tel: + 61 2 8268 7333<br />
Fax: + 61 2 8268 7330<br />
Tokyo<br />
24th Floor,<br />
ARK Mori Building<br />
1-12-32 Akasaka<br />
Minato-Ku<br />
Tokyo 107-6024<br />
Japan<br />
Tel: + 813 5510 3040<br />
Fax: + 813 5510 3041<br />
Hong Kong<br />
London<br />
Paris<br />
Philadelphia<br />
Sydney<br />
Tokyo<br />
125
Inner back cover: 10 Montrose Place; architects, Hamiltons Associates Architects Ltd;<br />
Slate wall by Andrew Goldsworthy; photographer Greg Smolonski, Photovibe©.<br />
Board photography by Mike Ellis<br />
Designed and produced by MAGEE<br />
Printed by PUSH