LEFM-based simulation of fatigue crack growth under non ...
LEFM-based simulation of fatigue crack growth under non ...
LEFM-based simulation of fatigue crack growth under non ...

You also want an ePaper? Increase the reach of your titles
YUMPU automatically turns print PDFs into web optimized ePapers that Google loves.
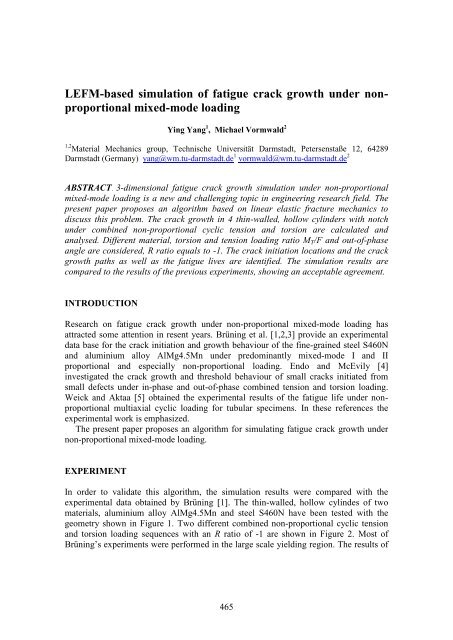
<strong>LEFM</strong>-<strong>based</strong> <strong>simulation</strong> <strong>of</strong> <strong>fatigue</strong> <strong>crack</strong> <strong>growth</strong> <strong>under</strong> <strong>non</strong>proportional<br />
mixed-mode loading<br />
Ying Yang 1 , Michael Vormwald 2<br />
1,2 Material Mechanics group, Technische Universität Darmstadt, Petersenstaße 12, 64289<br />
Darmstadt (Germany) yang@wm.tu-darmstadt.de 1 vormwald@wm.tu-darmstadt.de 2<br />
ABSTRACT. 3-dimensional <strong>fatigue</strong> <strong>crack</strong> <strong>growth</strong> <strong>simulation</strong> <strong>under</strong> <strong>non</strong>-proportional<br />
mixed-mode loading is a new and challenging topic in engineering research field. The<br />
present paper proposes an algorithm <strong>based</strong> on linear elastic fracture mechanics to<br />
discuss this problem. The <strong>crack</strong> <strong>growth</strong> in 4 thin-walled, hollow cylinders with notch<br />
<strong>under</strong> combined <strong>non</strong>-proportional cyclic tension and torsion are calculated and<br />
analysed. Different material, torsion and tension loading ratio M T /F and out-<strong>of</strong>-phase<br />
angle are considered, R ratio equals to -1. The <strong>crack</strong> initiation locations and the <strong>crack</strong><br />
<strong>growth</strong> paths as well as the <strong>fatigue</strong> lives are identified. The <strong>simulation</strong> results are<br />
compared to the results <strong>of</strong> the previous experiments, showing an acceptable agreement.<br />
INTRODUCTION<br />
Research on <strong>fatigue</strong> <strong>crack</strong> <strong>growth</strong> <strong>under</strong> <strong>non</strong>-proportional mixed-mode loading has<br />
attracted some attention in resent years. Brüning et al. [1,2,3] provide an experimental<br />
data base for the <strong>crack</strong> initiation and <strong>growth</strong> behaviour <strong>of</strong> the fine-grained steel S460N<br />
and aluminium alloy AlMg4.5Mn <strong>under</strong> predominantly mixed-mode I and II<br />
proportional and especially <strong>non</strong>-proportional loading. Endo and McEvily [4]<br />
investigated the <strong>crack</strong> <strong>growth</strong> and threshold behaviour <strong>of</strong> small <strong>crack</strong>s initiated from<br />
small defects <strong>under</strong> in-phase and out-<strong>of</strong>-phase combined tension and torsion loading.<br />
Weick and Aktaa [5] obtained the experimental results <strong>of</strong> the <strong>fatigue</strong> life <strong>under</strong> <strong>non</strong>proportional<br />
multiaxial cyclic loading for tubular specimens. In these references the<br />
experimental work is emphasized.<br />
The present paper proposes an algorithm for simulating <strong>fatigue</strong> <strong>crack</strong> <strong>growth</strong> <strong>under</strong><br />
<strong>non</strong>-proportional mixed-mode loading.<br />
EXPERIMENT<br />
In order to validate this algorithm, the <strong>simulation</strong> results were compared with the<br />
experimental data obtained by Brüning [1]. The thin-walled, hollow cylindes <strong>of</strong> two<br />
materials, aluminium alloy AlMg4.5Mn and steel S460N have been tested with the<br />
geometry shown in Figure 1. Two different combined <strong>non</strong>-proportional cyclic tension<br />
and torsion loading sequences with an R ratio <strong>of</strong> -1 are shown in Figure 2. Most <strong>of</strong><br />
Brüning’s experiments were performed in the large scale yielding region. The results <strong>of</strong><br />
465
the 4 specimens A7, A8, S7 and S13 could be used here for comparison purpose<br />
because the loading was low enough to meet small scale yielding requirements. The<br />
basic mechanical properties <strong>of</strong> the two materials are shown in Table 1.<br />
Figure 1. Specimen geometry (dimensions in millimetres)<br />
Fmax<br />
MT,max<br />
F(t)<br />
Fmax<br />
MT,max<br />
F(t)<br />
load<br />
load<br />
M T(t)<br />
M T(t)<br />
(a)<br />
(b)<br />
.<br />
Figure 2. Loading types: (a) phase angle <strong>of</strong> 45°, (b) phase angle <strong>of</strong> 90°<br />
Table 1 Mechanical properties [4]<br />
E R p0.2 R m A 5 y<br />
' C (R=-1) m<br />
Material [MPa] [-] [MPa] [MPa] [%] [MPa] da/dn in [mm/cycle]<br />
K in [MPa mm ]<br />
AlMg4.5Mn 68000 0.33 169 340 20.2 341 3.32e-16 4.25<br />
S460N 208500 0.3 500 643 26.2 410 6.46e-14 2.92<br />
SIMULATION ALGORITHM<br />
The <strong>simulation</strong> algorithm is <strong>based</strong> on linear elastic fracture mechanics (<strong>LEFM</strong>), Figure<br />
3 shows a illustration <strong>of</strong> the algorithm’s idea and the <strong>simulation</strong> procedure. The main<br />
modules <strong>of</strong> this procedure can be considered as: (a) determining <strong>of</strong> the <strong>crack</strong> initiation<br />
position; (b) calculating <strong>of</strong> the maximum equivalent stress intensity factor K eq in one<br />
load cycle, which is taken as the <strong>crack</strong> driving force parameter; (c) <strong>crack</strong> <strong>growth</strong> process.<br />
Module (b) and (c) are repeated until the <strong>crack</strong> <strong>growth</strong> path can be presented clearly.<br />
Location <strong>of</strong> <strong>crack</strong> initiation<br />
The finite element model was created using the ABAQUS s<strong>of</strong>tware [6]. The specimen<br />
was modelled with hexahedral and tetrahedral elements. The degrees <strong>of</strong> freedom were<br />
466
fixed at the clamping region <strong>of</strong> one end <strong>of</strong> the specimen. At the other end the normal<br />
force F and torsional moment M T were introduced via a reference point. The degrees <strong>of</strong><br />
freedom <strong>of</strong> the reference point are coupled with the degrees <strong>of</strong> freedom <strong>of</strong> the<br />
neighbouring clamping region in such a way that for the clamping region only rigid<br />
body translations along and rotations around the specimen axis are allowed. The middle<br />
portion <strong>of</strong> the model is considered as the <strong>crack</strong> <strong>growth</strong> region with refined mesh as<br />
shown in Fig 4 (a). Along the notch root, there are four potential <strong>crack</strong> initiation sites<br />
numbered 1, 2, 3 and 4 clockwise, shown in Fig 4 (b).<br />
<strong>crack</strong> initiation analysis<br />
specimen notch geometry<br />
one full cycle loading<br />
boundary conditions<br />
SIFs analysis<br />
F: K I K II<br />
MT: K I K II<br />
one full cycle<br />
loading<br />
<strong>crack</strong> initiation position<br />
determined ( ) ,max<br />
superposition<br />
combined K I K II<br />
<br />
a<br />
END<br />
Keq calculate<br />
*<br />
K<br />
<br />
eq<br />
<br />
yes<br />
<strong>crack</strong> <strong>growth</strong><br />
a i 1<br />
a <br />
i<br />
a<br />
i 1<br />
a<br />
en d<br />
no<br />
F(t max )<br />
K Keq,max F F t<br />
I,<br />
KII<br />
<br />
max <br />
*<br />
K <br />
t MT<br />
MT<br />
t<br />
max<br />
max <br />
M T (t max )<br />
<strong>crack</strong> propagation<br />
step<br />
Figure 3. Simulation algorithm procedure<br />
Figure 4. (a) Finite element model, (b) Crack initiation sites<br />
One full load cycle was analysed for the un<strong>crack</strong>ed specimen. Solutions for unit load<br />
cases F=1 and M T =1 are provided, <br />
F<br />
and <br />
M<br />
. The tangential stress along the notch<br />
root, location s , at each time t is<br />
s<br />
t s<br />
M t<br />
<br />
s<br />
Ft<br />
<br />
, . (1)<br />
M<br />
T<br />
F<br />
467
In Figure 5 (a) each curve describes the variation <strong>of</strong> the tangential stress<br />
corresponding to one node in the notch root during one full cycle load. The mode<br />
showing the maximum stress is taken as the <strong>crack</strong> initiation site.<br />
Equivalent stress intensity factor calculation<br />
In linear elastic fracture mechanics, stress intensity factor SIF is the most important<br />
parameter to predict <strong>crack</strong> <strong>growth</strong> direction and <strong>crack</strong> <strong>growth</strong> rate. In mixed-mode<br />
loading, the calculated mode I and mode II SIFs, K I and K II , are used to obtain the<br />
equivalent SIF, K eq , which determines the <strong>crack</strong> <strong>growth</strong> rate.<br />
Erdogan and Sih [7] proposed that the equivalent stress intensity factor according to<br />
the maximum circumferential stress criterion can be described by:<br />
* * * *<br />
<br />
1 3 3 3<br />
Keq<br />
3cos cos K<br />
sin sin K<br />
4 2 2 4 2 2 <br />
<br />
(2)<br />
*<br />
represents the direction where the circumferential stress in the vicinity <strong>of</strong> <strong>crack</strong> tip is<br />
maximum.<br />
<br />
2 <br />
* 1 1<br />
2arctan K K <br />
<br />
<br />
8 <br />
(3)<br />
<br />
<br />
<br />
4 K<br />
4 K <br />
<br />
<br />
<br />
<br />
By application <strong>of</strong> the parameter K eq the <strong>fatigue</strong> life can be calculated <strong>based</strong> on Paris law<br />
as equation (4), where C and m are material constants, see Table 1.<br />
da<br />
C K m<br />
eq<br />
dN (4)<br />
In this paper the Fracture Analysis Code 3D (FRANC3D) [8] is used to calculate<br />
stress intensity factors and simulate <strong>crack</strong> <strong>growth</strong>. It is designed to simulate <strong>crack</strong><br />
<strong>growth</strong> in engineering structures with arbitrary component or <strong>crack</strong> geometry, loading<br />
and boundary conditions. FRANC3D adaptively remeshes a finite element model<br />
created by ABAQUS.<br />
On the basis <strong>of</strong> <strong>crack</strong> initiation analysis, quarter-elliptical <strong>crack</strong>s are used for<br />
simulating the initial <strong>crack</strong>s in the notch root, which are inserted into the <strong>crack</strong> initiation<br />
positions. The stress intensity factors for mode I and mode II are calculated by<br />
FRANC3D s<strong>of</strong>tware for tension F=1 and torsion M T =1. The mixed-mode K I and K II ,<br />
shown in Figure 5 (b) are obtained from the superposition <strong>of</strong> tension and torsion K I and<br />
K II values, as equation:<br />
t <br />
F<br />
t <br />
M<br />
<br />
T t<br />
t t t<br />
K K F K M<br />
I I, I,<br />
K K F K M . (5)<br />
II II, F II, M T<br />
468
The equivalent stress intensity factors K eq are calculated by equation (2) and (3). K II<br />
is always very small compared to K I , therefore the disparity between K I curve and K eq<br />
curve are not obvious in Figure 5 (b). The time at the maximum K eq in a full cycle, t max ,<br />
is considered to be the <strong>crack</strong> propagation moment. The load for <strong>crack</strong> propagation can<br />
be determined, F(t max )and M T (t max ).<br />
(a)<br />
tengential stress (MPa)<br />
150<br />
100<br />
50<br />
0<br />
0 1 2 3 4<br />
-50<br />
-100<br />
-150<br />
time<br />
(b)<br />
K<br />
150<br />
100<br />
50<br />
0<br />
-50<br />
-100<br />
-150<br />
Keq,max<br />
KI<br />
KII<br />
Keq<br />
tmax<br />
0 0,5 1 1,5 2 2,5 3 3,5 4<br />
tim e<br />
Figure 5.<br />
(a) tangential stress curve, (b) K I K II K eq curve<br />
Crack <strong>growth</strong> process<br />
The load corresponding to the K eq,max , F(t max ) and M T (t max ) are applied to the specimen<br />
with the actual <strong>crack</strong>s. Stress analysis is carried out in ABAQUS. The SIF solutions for<br />
the <strong>crack</strong>s are again obtained from FRANC3D <strong>based</strong> on the finite element stress<br />
analysis. Although the solutions for K I , K II and K eq are already at hand for t= t max , the reevaluation<br />
<strong>of</strong> this loading case combination can now be used to let the FRANC3D<br />
s<strong>of</strong>tware create the <strong>crack</strong> propagation increment a .<br />
The ABAQUS/FRANC3D interface was implemented to complete the <strong>crack</strong> <strong>growth</strong><br />
process. The finite element modelling and the stress analysis are performed in<br />
ABAQUS, FRANC3D is used to calculate <strong>crack</strong> <strong>growth</strong> parameters and updates the<br />
<strong>crack</strong> geometry and mesh. This process is continued until the <strong>crack</strong> has grown to a<br />
certain length.<br />
RESULTS<br />
Non-proportional loading for phase angle <strong>of</strong> 45°<br />
For out <strong>of</strong> phase loading with a phase angle <strong>of</strong> 45°, specimen A8 (AlMg4.5Mn;<br />
F=6.5Kn; M T =72Nm) and S13 (S460N; F=22.5Kn; M T =272Nm) are simulated.<br />
According to the stress analysis for the un<strong>crack</strong>ed specimen, the local circumferential<br />
stress in site 1 and 3 are 1.6 times larger than the stress in site 2 and 4. The <strong>crack</strong>s<br />
should occur in site 1 and 3. Simulation results show that for these two different<br />
specimens the <strong>crack</strong> <strong>growth</strong> paths are very similar, the <strong>crack</strong> propagates along an angle<br />
<strong>of</strong> approximately 45° with the longitudinal axis. After the <strong>crack</strong> reaches a certain length,<br />
it has a tendency to turn into a plane, which is perpendicular to the longitudinal axis.<br />
469
The simulated <strong>crack</strong> <strong>growth</strong> paths have a good agreement with the experimental results,<br />
as shown in Figure 6. A small deviation between the calculated and experimental<br />
<strong>fatigue</strong> life can be observed for specimen A8, while the number <strong>of</strong> cycles are 369000<br />
and 370000, as shown in Figure 8 (a). However, a clear over estimate <strong>of</strong> <strong>fatigue</strong> life<br />
obtained from the <strong>simulation</strong> compared to the experimental data is found for model S13,<br />
shown in Figure 8 (b) The <strong>simulation</strong> showed a higher <strong>fatigue</strong> life (127000 cycles) than<br />
the actual specimen (67000 cycles).<br />
(a)<br />
(b)<br />
Figure 6. (a)A8 <strong>crack</strong> <strong>growth</strong> path, (b) S13 <strong>crack</strong> <strong>growth</strong> path<br />
(a)<br />
(b)<br />
Figure 7. (a) A7 <strong>crack</strong> <strong>growth</strong> path, (b) S7 <strong>crack</strong> <strong>growth</strong> path<br />
Non-proportional loading for phase angle <strong>of</strong> 90°<br />
For specimen A7 (AlMg4.5Mn; F=8kN; M T =96Nm) both <strong>simulation</strong> and experiment<br />
displayed that the <strong>crack</strong> propagates following a very curvilinear path. In the experiment<br />
the <strong>crack</strong> branching appeared and the <strong>crack</strong> <strong>growth</strong> path continues nearly<br />
perpendicularly to the previous propagation direction. The <strong>simulation</strong> algorithm in this<br />
paper does not contain a condition for <strong>crack</strong> branching. Therefore, only the first<br />
curvilinear paths are presented as shown in Fig 7 (a). For specimen S7 (S460N; F=27kN;<br />
M T =408Nm) 4 initial corner <strong>crack</strong>s are inserted into the notch root because the<br />
maximum local circumferential stresses are almost equal for sites 1-4.<br />
The <strong>crack</strong> <strong>growth</strong> curves are shown in Figure 8. The calculated <strong>fatigue</strong> life <strong>of</strong> model<br />
A7 gave a reasonable approximation <strong>of</strong> the cycles to the actual specimen. The <strong>fatigue</strong><br />
life from the <strong>simulation</strong> is 260000 cycles corresponding to the <strong>crack</strong> length is 14mm,<br />
and the cycle number is 190000 for the tested specimen when the <strong>crack</strong> grows to the<br />
470
same length. The calculated number <strong>of</strong> cycles for S7 is much higher than the<br />
experimental result, 61000 and 25000, respectively.<br />
<strong>crack</strong> length (mm)<br />
25<br />
20<br />
15<br />
10<br />
5<br />
0<br />
A8 experiment<br />
A8 <strong>simulation</strong><br />
A7 experiment<br />
A7 <strong>simulation</strong><br />
0 100000 200000 300000 400000<br />
<strong>crack</strong> <strong>growth</strong> cycles n<br />
(a)<br />
<strong>crack</strong> length (mm)<br />
18<br />
16<br />
14<br />
12<br />
10<br />
8<br />
6<br />
4<br />
2<br />
0<br />
0 50000 100000 150000<br />
<strong>crack</strong> <strong>growth</strong> cycles n<br />
(b)<br />
S7 experiment<br />
S7 <strong>simulation</strong><br />
S13 experiment<br />
S13 <strong>simulation</strong><br />
Figure 8. (a) A7, A8 <strong>fatigue</strong> life, (b) S7, S13 <strong>fatigue</strong> life<br />
Table 2. Crack initiation and stress ration information<br />
Phase angle 45° 45° 90° 90°<br />
Model A8 S13 A7 S7<br />
f=M T /F [mm] 11.08 12.09 12 15.11<br />
Number <strong>of</strong> <strong>crack</strong>s 2 2 2 (4) 4<br />
0.378 1.168 0.453 1.577<br />
noch , max<br />
' y<br />
DISCUSSION and CONCLUSIONS<br />
The parameter torsion and tension loading ratio f is defined as f=M T /F. It is a significant<br />
parameter for <strong>crack</strong> initiation, see table 2. Both <strong>simulation</strong> and experimental results<br />
show that when the torsion load reaches to a certain percentage <strong>of</strong> the total load, 4<br />
<strong>crack</strong>s will grow. In specimen S7, M T /F is 15.11 mm, the torsion load plays a more<br />
important role in <strong>crack</strong> <strong>growth</strong> compared to the other three specimens, the M T /F values<br />
are 11.08 mm, 12.09 mm and 12 mm respectively. However, 4 <strong>crack</strong>s also initiated in<br />
specimen A7. Crack 1 and 3 are the dominating <strong>crack</strong>s, <strong>crack</strong> 2, 4 arrested at a very<br />
small <strong>crack</strong> length. The phase angle is another factor that affects the <strong>crack</strong> initiation<br />
since the load ratio is 12 for A7 and phase angle is 90°.<br />
Table 2 shows the notch,max / ' y values for the four specimens calculated <strong>based</strong> on<br />
linear elasticity. notch,max is the maximum tangential stress along the notch root for<br />
471
un<strong>crack</strong>ed specimen, ' y is the material cyclic yield stress. It was found that for<br />
specimens A7 and A8, notch,max / ' y are 0.453 and 0.378. <strong>LEFM</strong> can be considered to<br />
be applicable. The <strong>crack</strong> <strong>growth</strong> path and <strong>fatigue</strong> life calculated from the <strong>simulation</strong><br />
show an acceptable agreement with the experimental data. For the steel specimens S7<br />
and S13, the ratio <strong>of</strong> notch,max / ' y and ' y are 1.577, 1.168, the <strong>crack</strong> <strong>growth</strong> paths are<br />
similar to the experiment, but having much higher cycles to failure than the experiment.<br />
The <strong>crack</strong> <strong>growth</strong> curves in Figure 8 (b) indicate that the number <strong>of</strong> cycles which the<br />
<strong>crack</strong> spends in the notch area are clearly higher for the <strong>simulation</strong> results than in the<br />
experiment. This means that the <strong>crack</strong>s grow much faster for the early short <strong>crack</strong> in the<br />
experiment compared to the <strong>simulation</strong>. Plasticity should be a main reason to explain<br />
the acceleration <strong>of</strong> <strong>crack</strong> propagation, in this case K eq used to estimate <strong>fatigue</strong> life is<br />
invalid.<br />
In the present paper, 3 dimensional <strong>crack</strong> <strong>growth</strong> <strong>simulation</strong> is implemented by using<br />
the <strong>LEFM</strong>-<strong>based</strong> algorithm. The <strong>simulation</strong> for two different materials AlMg4.5Mn,<br />
S460N, two phase angles 45° and 90°, different loading levels and M T /F ratio have been<br />
presented. The conclusions are summarized as:<br />
(1) The M T /F ratio has a great influence on the number <strong>of</strong> <strong>crack</strong>s, 4 <strong>crack</strong>s will occur<br />
when torsion loading M T reaches a certain percentage <strong>of</strong> the total loading.<br />
(2) The loading phase angle affects the <strong>crack</strong> <strong>growth</strong> path behaviour and also the<br />
<strong>crack</strong> initiation numbers.<br />
(3) Compared to the phase angle <strong>of</strong> 45°, specimens <strong>under</strong> out <strong>of</strong> phase loading with a<br />
phase angle <strong>of</strong> 90°, demonstrate more variations in <strong>crack</strong> initiation and <strong>crack</strong> <strong>growth</strong><br />
path, depending on different load level and M T /F ratio.<br />
(4) K eq calculated from the superposition <strong>of</strong> K I and K II <strong>under</strong> tension and torsion<br />
loading is shown to be an appropriate parameter to estimate <strong>fatigue</strong> life <strong>of</strong> specimen<br />
<strong>under</strong> lower loading level.<br />
REFERENCES<br />
1. J. Brüning. (2008). PHD Thesis, Technischen Universität Darmstadt, Germany.<br />
2. P. Zerres, J.Brüning, M. Vormwald. (2010) Eng Fract Mech. 77, 1822-1834.<br />
3. P. Zerres, J.Brüning, M. Vormwald. (2011) Material Testing. 53, 109-117.<br />
4. M. Endo, A.J. McEvily. (2011) Eng Fract Mech. 78, 1529-1541.<br />
5. M. WEICK, J. AKTAA. (2007) Fatigue Fract Eng M. 30, 311-322.<br />
6. Abaqus Analysis User’s Manual, Version 6.8-EF.<br />
7. M. A. Meggiolaro, A. C. O. Miranda. J. T. P. Castro, L. F. Martha. (2005) Eng<br />
Fract Mech. 72, 2647-2671.<br />
8. Fracture Analysis Consultants, Inc., Ithaca, NY, USA; Cornell University, Ithaca,<br />
NY, USA.<br />
9. M. Feng, F. Ding, Y. Jiang. (2006) Int J Fatigue. 28, 19-27.<br />
10. K. Tanaka, H. Takahash, Y. Akiniwa. (2006) Int J Fatigue. 28, 324-334.<br />
11. H. A. Richard, M. Fulland, M. Sander. (2005) Fatigue Fract Eng M. 28, 3-12.<br />
472