Appendices - GSA
Appendices - GSA
Appendices - GSA

Create successful ePaper yourself
Turn your PDF publications into a flip-book with our unique Google optimized e-Paper software.
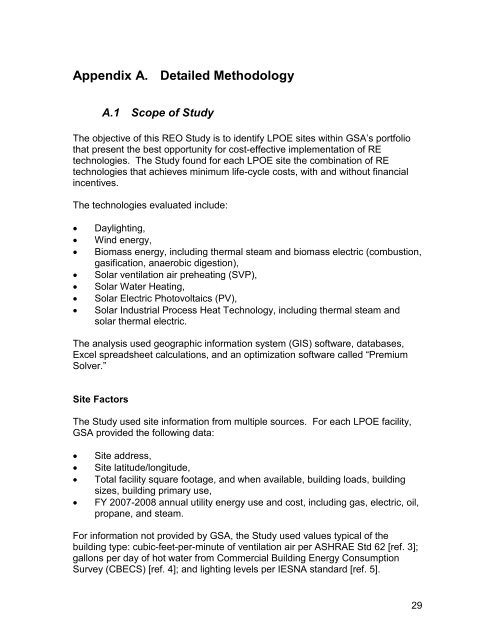
Appendix A. Detailed Methodology<br />
A.1 Scope of Study<br />
The objective of this REO Study is to identify LPOE sites within <strong>GSA</strong>’s portfolio<br />
that present the best opportunity for cost-effective implementation of RE<br />
technologies. The Study found for each LPOE site the combination of RE<br />
technologies that achieves minimum life-cycle costs, with and without financial<br />
incentives.<br />
The technologies evaluated include:<br />
• Daylighting,<br />
• Wind energy,<br />
• Biomass energy, including thermal steam and biomass electric (combustion,<br />
gasification, anaerobic digestion),<br />
• Solar ventilation air preheating (SVP),<br />
• Solar Water Heating,<br />
• Solar Electric Photovoltaics (PV),<br />
• Solar Industrial Process Heat Technology, including thermal steam and<br />
solar thermal electric.<br />
The analysis used geographic information system (GIS) software, databases,<br />
Excel spreadsheet calculations, and an optimization software called “Premium<br />
Solver.”<br />
Site Factors<br />
The Study used site information from multiple sources. For each LPOE facility,<br />
<strong>GSA</strong> provided the following data:<br />
• Site address,<br />
• Site latitude/longitude,<br />
• Total facility square footage, and when available, building loads, building<br />
sizes, building primary use,<br />
• FY 2007-2008 annual utility energy use and cost, including gas, electric, oil,<br />
propane, and steam.<br />
For information not provided by <strong>GSA</strong>, the Study used values typical of the<br />
building type: cubic-feet-per-minute of ventilation air per ASHRAE Std 62 [ref. 3];<br />
gallons per day of hot water from Commercial Building Energy Consumption<br />
Survey (CBECS) [ref. 4]; and lighting levels per IESNA standard [ref. 5].<br />
29
NREL provided site-specific resource and incentive information from its GIS<br />
database of solar, wind, weather, and biomass resources [ref. 1]. Platts, Inc.<br />
databases detailed local energy costs and wholesale power costs.<br />
The Study employed simple annual-average algorithms to calculate energy<br />
delivery as a function of RE resources based on efficiency models. It calculated<br />
associated energy cost savings based on energy use and cost information for<br />
each site. Energy performance and cost savings were also based on NREL’s<br />
experience with the technologies gained through other analyses.<br />
It used DOE’s multipliers for CO 2 emissions per kWh of electricity-use for each<br />
location, and it used a standard multiplier for CO 2 emissions per therm of natural<br />
gas consumption for all locations.<br />
The Study estimated the installed cost, including incentive timeframe and tax<br />
depreciation, by using the Database of State Incentives for Renewables &<br />
Efficiency (DSIRE) database maintained by the University of North Carolina. It<br />
incorporated the effects of incentives that may be available at each location from<br />
state governments, utilities, and others.<br />
It assumes a typical corporate tax liability structure in the 35 percent tax bracket<br />
for estimating the effects of business investment tax credit and accelerated<br />
depreciation. It makes these assumptions because <strong>GSA</strong> cannot directly utilize<br />
tax incentives but can benefit indirectly from pass-through cost savings.<br />
Economic Factors<br />
In the life-cycle cost analysis, NREL used a discount rate of 4.6 percent to<br />
represent the time-value of money, consistent with rates published by the<br />
National Institute of Standards and Technology (NIST) for federal analysis [ref.<br />
2]. It used the same publication, Energy Price Indices and Discount Factors for<br />
Life-Cycle Cost Analysis, for other parameters used in the economic analysis,<br />
such as fuel escalation rate and general inflation rate.<br />
The life-cycle analysis time period is 25 years because that is the maximum<br />
allowed by 10CFR436 for electrical and mechanical measures, and we expect<br />
these systems to last that long. In order to model costs which are not constant<br />
from year to year, such as accelerated depreciation, the Study used a 25-year<br />
cash flow analysis.<br />
The Study calculated a life-cycle cost of all RE technologies combined at a site,<br />
but also reports payback period as figures-of-merit to assess cost-effectiveness<br />
of each individual technology. Other results include ROI and RE use as<br />
percentage of total energy use for each site.<br />
30
Initial cost, efficiency, and operation and maintenance cost for each of the<br />
renewable energy technologies is characterized according to the cost and<br />
performance data reported in edition four of the Power Technologies Energy<br />
Data Book [ref. 8] and also from Renewable Energy Technology<br />
Characterizations [ref. 10]. Other sources were incorporated to establish the<br />
economic parameters for costing. The RS Means Green Building: Project<br />
Planning and Cost Estimating [ref. 7] was used for installed cost estimates with<br />
regional adjustment factors according to the City Cost Adjustments for the<br />
closest city location. However, costs vary widely for remote sites, which may<br />
introduce some error.<br />
The study estimated the size, cost, savings, and payback period for each<br />
technology at each location. For sites identified as most promising in this<br />
analysis and prior to any implementation, <strong>GSA</strong> must conduct a detailed<br />
engineering technical and economic feasibility study.<br />
A.2 Technology Characterizations<br />
Initial cost, efficiency, and operation and maintenance cost for each of the<br />
renewable energy technologies is characterized according to the cost and<br />
performance data reported in edition four of the Power Technologies Energy<br />
Data Book [ref. 8] and also from Renewable Energy Technology<br />
Characterizations [ref. 10].<br />
Daylighting<br />
The term “daylighting” refers to consciously adding natural light to reduce the<br />
need for artificial light, a big user of electricity in today’s commercial buildings. A<br />
complete daylighting system consists of apertures (skylights, light shelves, and<br />
windows) to admit and distribute sunlight and a controller to modulate artificial<br />
light as needed to maintain the desired level of light for the building space. It<br />
reduces electricity use for lighting, and it requires no scheduled maintenance.<br />
However, skylights may increase roof maintenance.<br />
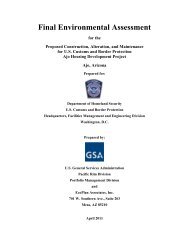
Figure 1 is a photograph of skylights in an application similar to the configuration<br />
modeled for the LPOE study. While this single-story industrial model is not<br />
accurate for LPOE buildings, we consider this configuration as proxy for savings<br />
available from an architectural treatment of the daylighting and controls.<br />
Daylighting was considered in the office, utility, and warehouse areas of each<br />
LPOE. Utilization of daylighting can enhance the quality of both light and comfort<br />
for the people working in these buildings. It can also contribute to lower overall<br />
cooling loads by reducing waste or by-product heat from electric lighting.<br />
31
Figure A-1: Daylighting applicable to LPOE sites<br />
Table A-1 lists the characteristics of daylighting technology used in the analysis.<br />
Table A-2 shows seasonal illuminance information used for daylighting<br />
calculations for each site. Table B-12 lists the details of the daylighting analysis<br />
including skylight area, cost, annual energy delivery, annual cost savings, and<br />
payback period.<br />
Note that the skylight costs used in the analysis do not include costs for special<br />
security features as described in the LPOE Design Guide.<br />
32
Table A-1: Characteristics of Daylighting Technology Used for Analysis<br />
Office<br />
Warehouse<br />
Utility<br />
Skylight Transmittance 0.7<br />
Lightwell Transmittance 0.8<br />
Coefficient of Utilization Daylight 0.55<br />
Coefficient of Utilization Elec Light 0.55<br />
Luminous Efficacy Elec Light<br />
Roof U-value<br />
Skylight U-value<br />
Cooling COP 3.5<br />
Heating Efficiency 0.8<br />
Skylight Cost<br />
Controls cost<br />
Lighting Levels<br />
30 Fc<br />
15 Fc<br />
30 Fc<br />
75 Lumens/watt<br />
0.1 btu/hr/F<br />
0.5 btu/hr/F<br />
25 $/sf<br />
$/sf floor<br />
0.25<br />
area<br />
33
Table A-2: Illuminance Information for Daylighting Calculation<br />
(Daily Profile by Season in kLux-Hour/sf)<br />
Name<br />
Spring Summer Fall Winter<br />
9am 11am 1pm 3pm 5pm 9am 11am 1pm 3pm 5pm 9am 11am 1pm 3pm 5pm 9am 11am 1pm 3pm 5pm<br />
Dalton Cache, AK 13 29 34 27 13 26 40 46 50 40 10 24 30 30 21 0 4 7 2 0<br />
Alcan, AK 10 26 35 31 16 28 46 56 57 48 7 22 32 33 24 0 0 3 0 0<br />
Skagway, AK 13 29 34 27 13 26 40 46 50 40 10 24 30 30 21 0 4 7 2 0<br />
Lukeville, AZ 31 69 83 71 36 60 94 108 95 58 42 78 91 75 35 13 42 54 40 9<br />
Nogales, AZ 35 72 84 71 35 61 95 105 89 54 45 80 89 71 33 16 46 55 41 10<br />
Sasabe, AZ 31 69 83 71 36 60 94 108 95 58 42 78 91 75 35 13 42 54 40 9<br />
Douglas, AZ 43 77 87 69 30 44 85 105 99 67 27 68 87 80 48 21 50 56 37 6<br />
San Luis, AZ 31 69 83 71 36 60 94 108 95 58 42 78 91 75 35 13 42 54 40 9<br />
Naco, AZ 35 72 84 71 35 61 95 105 89 54 45 80 89 71 33 16 46 55 41 10<br />
San Luis AZ (not built<br />
yet)<br />
31 69 83 71 36 60 94 108 95 58 42 78 91 75 35 13 42 54 40 9<br />
Nogales, AZ 35 72 84 71 35 61 95 105 89 54 45 80 89 71 33 16 46 55 41 10<br />
Calexico West, CA 31 69 83 71 36 60 94 108 95 58 42 78 91 75 35 13 42 54 40 9<br />
San Ysidro, CA 38 68 77 58 21 33 68 91 86 56 26 64 85 76 42 22 47 50 31 3<br />
Andrade, CA 31 69 83 71 36 60 94 108 95 58 42 78 91 75 35 13 42 54 40 9<br />
Otay Mesa, CA 38 68 77 58 21 33 68 91 86 56 26 64 85 76 42 22 47 50 31 3<br />
Tecate, CA 38 68 77 58 21 33 68 91 86 56 26 64 85 76 42 22 47 50 31 3<br />
Calexico, CA 31 69 83 71 36 60 94 108 95 58 42 78 91 75 35 13 42 54 40 9<br />
Eastport, ID 16 37 48 42 22 29 57 73 71 58 12 40 57 56 40 1 14 20 15 1<br />
Porthill, ID 16 37 48 42 22 29 57 73 71 58 12 40 57 56 40 1 14 20 15 1<br />
Ferry Point, ME 35 56 56 40 11 42 62 72 65 42 25 44 53 45 24 10 24 23 9 0<br />
Coburn Gore, ME 33 55 57 42 14 43 66 78 71 47 26 52 63 55 30 11 28 28 14 0<br />
Fort Fairfield, ME 35 56 56 40 11 42 62 72 65 42 25 44 53 45 24 10 24 23 9 0<br />
Houlton, ME 35 56 56 40 11 42 62 72 65 42 25 44 53 45 24 10 24 23 9 0<br />
Jackman, ME 33 55 57 42 14 43 66 78 71 47 26 52 63 55 30 11 28 28 14 0<br />
Limestone, ME 35 56 56 40 11 42 62 72 65 42 25 44 53 45 24 10 24 23 9 0<br />
Orient, ME 35 56 56 40 11 42 62 72 65 42 25 44 53 45 24 10 24 23 9 0<br />
Vanceboro, ME 35 56 56 40 11 42 62 72 65 42 25 44 53 45 24 10 24 23 9 0<br />
VanBuren, ME 35 56 56 40 11 42 62 72 65 42 25 44 53 45 24 10 24 23 9 0<br />
Milltown ME 35 56 56 40 11 42 62 72 65 42 25 44 53 45 24 10 24 23 9 0<br />
St. Francis, ME 35 56 56 40 11 42 62 72 65 42 25 44 53 45 24 10 24 23 9 0<br />
Madawaska, ME 35 56 56 40 11 42 62 72 65 42 25 44 53 45 24 10 24 23 9 0<br />
Fort Kent, ME 35 56 56 40 11 42 62 72 65 42 25 44 53 45 24 10 24 23 9 0<br />
St. Francis, ME 35 56 56 40 11 42 62 72 65 42 25 44 53 45 24 10 24 23 9 0<br />
Detroit Cargo, MI 18 43 53 46 23 29 61 78 77 59 13 42 60 59 40 3 19 26 19 3<br />
Intl Bridge, MI 19 47 59 52 28 28 55 73 74 58 10 34 50 51 37 2 17 24 17 3<br />
Amb. Bridge, MI 19 47 59 52 28 28 55 73 74 58 10 34 50 51 37 2 17 24 17 3<br />
34
Table A-2: Illuminance Information for Daylighting Calculation<br />
(Daily Profile by Season in kLux-Hour/sf)<br />
Name<br />
Spring Summer Fall Winter<br />
9am 11am 1pm 3pm 5pm 9am 11am 1pm 3pm 5pm 9am 11am 1pm 3pm 5pm 9am 11am 1pm 3pm 5pm<br />
Grand Portage, MN 23 48 56 46 20 34 58 68 67 52 15 39 50 49 31 3 18 23 14 0<br />
Noyes, MN 23 48 56 46 20 34 58 68 67 52 15 39 50 49 31 3 18 23 14 0<br />
Roseau, MN 23 48 56 46 20 34 58 68 67 52 15 39 50 49 31 3 18 23 14 0<br />
Intl Falls, MN 23 48 56 46 20 34 58 68 67 52 15 39 50 49 31 3 18 23 14 0<br />
Baudette, MN 24 49 58 47 21 36 63 77 75 55 18 45 59 57 36 6 22 28 17 0<br />
Chief Mt, MT 19 43 54 45 23 34 62 77 75 61 14 43 59 57 40 1 17 24 16 0<br />
Piegan, MT 19 43 54 45 23 34 62 77 75 61 14 43 59 57 40 1 17 24 16 0<br />
Raymond, MT 25 47 55 44 19 39 66 79 74 55 19 46 59 54 34 4 20 24 13 0<br />
Rooseville, MT 25 47 55 44 19 39 66 79 74 55 19 46 59 54 34 4 20 24 13 0<br />
Sweetgrass, MT 19 43 54 45 23 34 62 77 75 61 14 43 59 57 40 1 17 24 16 0<br />
Turner, MT 25 47 55 44 19 39 66 79 74 55 19 46 59 54 34 4 20 24 13 0<br />
Ambrose, ND 25 47 55 44 19 39 66 79 74 55 19 46 59 54 34 4 20 24 13 0<br />
Dunseith, ND 16 42 55 49 28 29 57 73 77 62 10 37 55 56 42 0 16 25 18 3<br />
Portal, ND 16 42 55 49 28 29 57 73 77 62 10 37 55 56 42 0 16 25 18 3<br />
St. John ND 16 42 55 49 28 29 57 73 77 62 10 37 55 56 42 0 16 25 18 3<br />
Pembina, ND 23 48 56 46 20 34 58 68 67 52 15 39 50 49 31 3 18 23 14 0<br />
Columbus, NM 43 77 87 69 30 44 85 105 99 67 27 68 87 80 48 21 50 56 37 6<br />
Santa Teresa, NM 43 77 87 69 30 44 85 105 99 67 27 68 87 80 48 21 50 56 37 6<br />
Alexandria Bay, NY 27 50 55 44 17 38 62 75 71 52 21 45 58 52 31 8 22 25 14 0<br />
Champlain, NY 27 50 55 44 17 38 62 75 71 52 21 45 58 52 31 8 22 25 14 0<br />
Massena, NY 27 50 55 44 17 38 62 75 71 52 21 45 58 52 31 8 22 25 14 0<br />
Fort Covington, NY 27 50 55 44 17 38 62 75 71 52 21 45 58 52 31 8 22 25 14 0<br />
Rouses Pt. NY 29 50 55 43 15 39 64 77 70 49 21 48 60 54 30 7 22 24 13 0<br />
St John Hwy, NY 29 50 55 43 15 39 64 77 70 49 21 48 60 54 30 7 22 24 13 0<br />
Trout, River, NY 27 50 55 44 17 38 62 75 71 52 21 45 58 52 31 8 22 25 14 0<br />
Chateaugay, NY 27 50 55 44 17 38 62 75 71 52 21 45 58 52 31 8 22 25 14 0<br />
Mooers, NY 29 50 55 43 15 39 64 77 70 49 21 48 60 54 30 7 22 24 13 0<br />
Jamieson, NY 29 51 55 42 15 38 64 77 71 47 23 50 62 56 30 11 26 28 15 0<br />
Niagra Falls, NY 22 45 52 43 20 33 61 77 75 56 16 42 58 55 35 5 20 25 16 2<br />
Ogdensburg NY 27 50 55 44 17 38 62 75 71 52 21 45 58 52 31 8 22 25 14 0<br />
Brownsville/Matamoros<br />
TX<br />
24 56 72 62 32 26 62 85 88 67 17 56 75 76 51 14 38 49 38 12<br />
Gateway, TX 24 56 72 62 32 26 62 85 88 67 17 56 75 76 51 14 38 49 38 12<br />
Columbia, TX 23 54 69 62 32 25 59 80 85 65 16 52 73 75 52 12 37 47 37 12<br />
Convent, TX 23 54 69 62 32 25 59 80 85 65 16 52 73 75 52 12 37 47 37 12<br />
Del Rio, TX 23 57 75 66 36 24 63 89 93 70 15 53 79 81 56 12 39 50 40 14<br />
Donna TX (not built<br />
yet)<br />
24 56 72 62 32 26 62 85 88 67 17 56 75 76 51 14 38 49 38 12<br />
35
Table A-2: Illuminance Information for Daylighting Calculation<br />
(Daily Profile by Season in kLux-Hour/sf)<br />
Name<br />
Bridge of the Americas,<br />
TX<br />
Spring Summer Fall Winter<br />
9am 11am 1pm 3pm 5pm 9am 11am 1pm 3pm 5pm 9am 11am 1pm 3pm 5pm 9am 11am 1pm 3pm 5pm<br />
43 77 87 69 30 44 85 105 99 67 27 68 87 80 48 21 50 56 37 6<br />
Eagle Pass, TX 23 57 75 66 36 24 63 89 93 70 15 53 79 81 56 12 39 50 40 14<br />
Fabens, TX 43 77 87 69 30 44 85 105 99 67 27 68 87 80 48 21 50 56 37 6<br />
Fort Hancock, TX 43 77 87 69 30 44 85 105 99 67 27 68 87 80 48 21 50 56 37 6<br />
El Paso, TX (out<br />
leased)<br />
43 77 87 69 30 44 85 105 99 67 27 68 87 80 48 21 50 56 37 6<br />
Juarez-Lincoln, TX 23 54 69 62 32 25 59 80 85 65 16 52 73 75 52 12 37 47 37 12<br />
Los Indios, TX 24 56 72 62 32 26 62 85 88 67 17 56 75 76 51 14 38 49 38 12<br />
Laredo TX 23 54 69 62 32 25 59 80 85 65 16 52 73 75 52 12 37 47 37 12<br />
Los Tomates, TX 24 56 72 62 32 26 62 85 88 67 17 56 75 76 51 14 38 49 38 12<br />
McAllen, TX 24 56 72 62 32 26 62 85 88 67 17 56 75 76 51 14 38 49 38 12<br />
McAllen TX (not built<br />
yet)<br />
24 56 72 62 32 26 62 85 88 67 17 56 75 76 51 14 38 49 38 12<br />
Marfa, TX 43 77 87 69 30 44 85 105 99 67 27 68 87 80 48 21 50 56 37 6<br />
Kika de la Garza, TX 24 56 72 62 32 26 62 85 88 67 17 56 75 76 51 14 38 49 38 12<br />
Paso Del Norte, TX 43 77 87 69 30 44 85 105 99 67 27 68 87 80 48 21 50 56 37 6<br />
Progreso, TX 24 56 72 62 32 26 62 85 88 67 17 56 75 76 51 14 38 49 38 12<br />
Roma, TX 24 56 72 62 32 26 62 85 88 67 17 56 75 76 51 14 38 49 38 12<br />
Rio Grande City, TX 24 56 72 62 32 26 62 85 88 67 17 56 75 76 51 14 38 49 38 12<br />
Ysleta, TX 43 77 87 69 30 44 85 105 99 67 27 68 87 80 48 21 50 56 37 6<br />
RR Inspection, TX 23 54 69 62 32 25 59 80 85 65 16 52 73 75 52 12 37 47 37 12<br />
Admin, TX (leased) 24 56 72 62 32 26 62 85 88 67 17 56 75 76 51 14 38 49 38 12<br />
El Paso, TX (Leased) 43 77 87 69 30 44 85 105 99 67 27 68 87 80 48 21 50 56 37 6<br />
DOT, TX (leased) 23 57 75 66 36 24 63 89 93 70 15 53 79 81 56 12 39 50 40 14<br />
Derby Line, VT 29 50 55 43 15 39 64 77 70 49 21 48 60 54 30 7 22 24 13 0<br />
Norton, VT 29 50 55 43 15 39 64 77 70 49 21 48 60 54 30 7 22 24 13 0<br />
Beebe Plain, VT 29 50 55 43 15 39 64 77 70 49 21 48 60 54 30 7 22 24 13 0<br />
Alburg Springs, VT 29 50 55 43 15 39 64 77 70 49 21 48 60 54 30 7 22 24 13 0<br />
North Troy VT 29 50 55 43 15 39 64 77 70 49 21 48 60 54 30 7 22 24 13 0<br />
West Berkshire,VT 29 50 55 43 15 39 64 77 70 49 21 48 60 54 30 7 22 24 13 0<br />
Derby Line, VT 29 50 55 43 15 39 64 77 70 49 21 48 60 54 30 7 22 24 13 0<br />
Beecher Falls, VT 29 50 55 43 15 39 64 77 70 49 21 48 60 54 30 7 22 24 13 0<br />
Canaan, VT 29 50 55 43 15 39 64 77 70 49 21 48 60 54 30 7 22 24 13 0<br />
East Richford, VT 29 50 55 43 15 39 64 77 70 49 21 48 60 54 30 7 22 24 13 0<br />
Richford, VT 29 50 55 43 15 39 64 77 70 49 21 48 60 54 30 7 22 24 13 0<br />
Alburg, VT (Joint<br />
ownership)<br />
29 50 55 43 15 39 64 77 70 49 21 48 60 54 30 7 22 24 13 0<br />
Highgate Springs 1, VT 29 50 55 43 15 39 64 77 70 49 21 48 60 54 30 7 22 24 13 0<br />
36
Table A-2: Illuminance Information for Daylighting Calculation<br />
(Daily Profile by Season in kLux-Hour/sf)<br />
Spring Summer Fall Winter<br />
Name<br />
9am 11am 1pm 3pm 5pm 9am 11am 1pm 3pm 5pm 9am 11am 1pm 3pm 5pm 9am 11am 1pm 3pm 5pm<br />
Highgate Springs 2, VT 29 50 55 43 15 39 64 77 70 49 21 48 60 54 30 7 22 24 13 0<br />
Highgate Springs 3, VT 29 50 55 43 15 39 64 77 70 49 21 48 60 54 30 7 22 24 13 0<br />
Blaine, WA 17 34 39 35 16 26 46 63 64 48 14 37 52 50 32 2 14 16 11 0<br />
Danville, WA 27 46 48 37 14 43 68 79 73 52 25 52 64 57 32 6 20 21 11 0<br />
Laurier, WA 27 46 48 37 14 43 68 79 73 52 25 52 64 57 32 6 20 21 11 0<br />
Mataline Falls. WA 27 46 48 37 14 43 68 79 73 52 25 52 64 57 32 6 20 21 11 0<br />
Oroville, WA 27 46 48 37 14 43 68 79 73 52 25 52 64 57 32 6 20 21 11 0<br />
Point Robert, WA 27 46 48 37 14 43 68 79 73 52 25 52 64 57 32 6 20 21 11 0<br />
Sumas, WA 17 34 39 35 16 26 46 63 64 48 14 37 52 50 32 2 14 16 11 0<br />
Blaine, WA 17 34 39 35 16 26 46 63 64 48 14 37 52 50 32 2 14 16 11 0<br />
Danville, WA 17 34 39 35 16 26 46 63 64 48 14 37 52 50 32 2 14 16 11 0<br />
Kenneth Ward, WA 17 34 39 35 16 26 46 63 64 48 14 37 52 50 32 2 14 16 11 0<br />
37
Wind Energy<br />
Uneven heating of the earth’s surface creates wind. Variation in heating and<br />
factors such as surface orientation or slope, rate of reflectivity, absorptivity, and<br />
transmissivity also affect the wind resource. Furthermore, the wind resource can<br />
be affected (accelerated, decelerated, made turbulent) by factors, such as<br />
terrain, bodies of water, buildings, and vegetative cover.<br />
Wind is air with high kinetic energy that can be transformed into useful work via<br />
wind turbine blades and a generator. Overall, wind is a diffuse resource that can<br />
generate electricity cost effectively and competitively in many regions.<br />
Wind Characteristics<br />
Windiness varies with the season and time of day and, of course, weather<br />
events. Collected wind data focuses on two primary considerations – average<br />
annual wind speed and a frequency distribution of the wind at various speeds.<br />
The wind speed at any given time determines the amount of power available in<br />
the wind.<br />
The power available in the wind is given by:<br />
P = A ρV 3 /2<br />
where<br />
P = power of the wind [Watts]<br />
A = windswept area of the rotor (blades) = πD 2 /4 = πr 2 [ m 2 ]<br />
ρ = density of the air [kg/m 3 ] (at sea level at 15°C)<br />
V = velocity of the wind [m/s]<br />
As shown, wind power is proportional to velocity cubed (V 3 ). If wind velocity<br />
doubles, wind power increases by a factor of eight (2 3 = 8). Consequently, small<br />
differences in average speed cause significant differences in energy production.<br />
Examining ways to increase the wind velocity at a particular site should be<br />
considered. Normally, the easiest way to accomplish this is to increase the<br />
height of the tower. The wind industry has been moving towards ever higher<br />
towers and the industry norm has increased from 30 m to 80 m over that last 15-<br />
20 years.<br />
Wind turbines are typically cost effective where the average wind speed is high,<br />
where the competing energy costs are high or a combination of both. Large wind<br />
farms of 100–500 MW have been driving the industry due to lower installed costs<br />
and lower cost of energy. Only 1 or 2 turbines would be considered for LPOE<br />
sites due to load and land constraints resulting in significantly higher installed<br />
costs than the wind farm industry norms.<br />
Wind turbines require regular maintenance. Manufacturer warranties cover the<br />
first two to five years. Professional wind turbine maintenance contractors (a.k.a.<br />
38
Table A-3: Characteristics of Wind Energy Technology Used for Analysis<br />
Tower Height 80 M<br />
Wind Shear Exponent 0.115<br />
Acres per MW 60<br />
Wind Turbine<br />
Efficiency<br />
35%<br />
Capital Cost $2,200 $/kW, maximum<br />
O&M Cost 7.9 $/year/kW<br />
Power/Area 0.46 kW/m 2<br />
Figure A-3: Map of U.S. Wind Resources<br />
40
8,000<br />
7,000<br />
Wind Project Cost ($)<br />
6,000<br />
5,000<br />
4,000<br />
3,000<br />
2,000<br />
y = 10605x -0.2182<br />
R 2 = 0.9506<br />
1,000<br />
0<br />
0 500 1000 1500 2000 2500<br />
Wind Project Size (kW)<br />
Figure A-4: Wind project cost as a function of size<br />
Land Use Requirements<br />
Land use requirements are established for solar PV, wind energy, solar thermal<br />
and solar thermal electric technologies. Land use requirements of the other<br />
technologies are not included, but many of these fit within the building or on the<br />
building shell. Many locations with cost-effective applications of solar or wind are<br />
constrained by the size of the site. Table A-4 shows land required and available<br />
for wind energy development.<br />
41
Table A-4: Land Required and Land Available for Wind Energy<br />
Table A-4: Land Required and Land Available for<br />
Wind Energy<br />
LPOE Site Name<br />
Land Required<br />
(acres)<br />
Land Available<br />
(acres)<br />
St John Hwy, NY 0 95<br />
Ysleta, TX 0 91<br />
Calexico, CA 0 87<br />
Los Tomates, TX 18 75<br />
Columbia, TX 0 70<br />
Piegan, MT 0 63<br />
Tecate, CA 0 60<br />
Del Rio, TX 0 60<br />
Alcan, AK 0 55<br />
Kika de la Garza, TX 16 55<br />
Los Indios, TX 0 50<br />
Nogales, AZ 0 40<br />
Pembina, ND 0 40<br />
Champlain, NY 0 35<br />
Otay Mesa, CA 28 31<br />
Bridge of the Americas, TX 0 27<br />
Rooseville, MT 0 25<br />
Detroit Cargo, MI 0 22<br />
Juarez-Lincoln, TX 0 20<br />
Dalton Cache, AK 0 18<br />
Massena, NY 0 18<br />
Highgate Springs 2, VT 0 16<br />
Eagle Pass, TX 0 13<br />
Blaine, WA 0 12<br />
Paso Del Norte, TX 0 11<br />
Columbus, NM 0 10<br />
Brownsville/Matamoros,TX 6 10<br />
Laredo TX 0 10<br />
McAllen, TX 0 10<br />
San Luis, AZ (not built) 0 9<br />
Raymond, MT 0 9<br />
Skagway, AK 0 8<br />
Nogales, AZ 0 8<br />
Dunseith, ND 0 8<br />
Fabens, TX 0 8<br />
Marfa, TX 2 8<br />
42
Table A-4: Land Required and Land Available for<br />
Wind Energy<br />
LPOE Site Name<br />
Land Required<br />
(acres)<br />
Land Available<br />
(acres)<br />
Rio Grande City, TX 0 8<br />
Oroville, WA 0 8<br />
Ambrose, ND 0 7<br />
Derby Line, VT 0 7<br />
Blaine, WA 0 7<br />
Lukeville, AZ 0 6<br />
Houlton, ME 0 6<br />
Santa Teresa, NM 0 6<br />
Mataline Falls. WA 0 6<br />
Calexico West, CA 0 5<br />
St. John ND 0 5<br />
Alexandria Bay, NY 8 5<br />
Fort Covington, NY 0 5<br />
Convent, TX 0 5<br />
Fort Hancock, TX 0 5<br />
Kenneth Ward, WA 0 5<br />
San Ysidro, CA 47 4<br />
Andrade, CA 2 4<br />
Coburn Gore, ME 0 4<br />
Jackman, ME 0 4<br />
Grand Portage, MN 0 4<br />
Mooers, NY 0 4<br />
Sumas, WA 0 4<br />
Douglas, AZ 0 3<br />
Derby Line, VT 0 3<br />
Blaine, WA 0 3<br />
Point Robert, WA 0 3<br />
Sasabe, AZ 0 2<br />
San Luis, AZ 0 2<br />
Eastport, ID 0 2<br />
Vanceboro, ME 0 2<br />
Noyes, MN 0 2<br />
Intl Falls, MN 0 2<br />
Trout, River, NY 0 2<br />
West Berkshire,VT 0 2<br />
Laurier, WA 0 2<br />
Naco, AZ 0 1<br />
Porthill, ID 0 1<br />
43
Table A-4: Land Required and Land Available for<br />
Wind Energy<br />
LPOE Site Name<br />
Land Required<br />
(acres)<br />
Land Available<br />
(acres)<br />
Ferry Point, ME 0 1<br />
Fort Fairfield, ME 0 1<br />
Limestone, ME 0 1<br />
Orient, ME 0 1<br />
VanBuren, ME 0 1<br />
Madawaska, ME 0 1<br />
Fort Kent, ME 0 1<br />
Chief Mt, MT 0 1<br />
Portal, ND 0 1<br />
Rouses Pt. NY 0 1<br />
Chateaugay, NY 0 1<br />
RR Inspection, TX 0 1<br />
Norton, VT 0 1<br />
Alburg Springs, VT 0 1<br />
North Troy VT 0 1<br />
Beecher Falls, VT 0 1<br />
Canaan, VT 0 1<br />
East Richford, VT 0 1<br />
Richford, VT 0 1<br />
Alburg, VT (Joint<br />
ownership)<br />
0 1<br />
Highgate Springs 3, VT 0 1<br />
Danville, WA 0 1<br />
Milltown ME 0 0<br />
St. Francis, ME 0 0<br />
St. Francis, ME 0 0<br />
Intl Bridge, MI 0 0<br />
Amb. Bridge, MI 0 0<br />
Roseau, MN 0 0<br />
Baudette, MN 0 0<br />
Sweetgrass, MT 0 0<br />
Turner, MT 0 0<br />
Jamieson, NY 0 0<br />
Niagra Falls, NY 9 0<br />
Ogdensburg NY 0 0<br />
Gateway, TX 13 0<br />
Donna TX (not built) 0 0<br />
El Paso, TX (out leased) 0 0<br />
44
Table A-4: Land Required and Land Available for<br />
Wind Energy<br />
LPOE Site Name<br />
Land Required<br />
(acres)<br />
Land Available<br />
(acres)<br />
McAllen TX (not built) 0 0<br />
Progreso, TX 0 0<br />
Roma, TX 0 0<br />
Admin, TX (leased) 0 0<br />
El Paso, TX (Leased) 0 0<br />
DOT, TX (leased) 0 0<br />
Beebe Plain, VT 0 0<br />
Highgate Springs 1, VT 0 0<br />
45
Biomass Energy<br />
Biomass energy is fuel, heat, or electricity produced from organic materials such<br />
as plants, agricultural residues, forestry by-products, and municipal or industrial<br />
wastes. Biomass has its energy stored within the chemical structure of the<br />
organic substance itself. Solid or liquid biomass feedstocks from surrounding<br />
areas can be acquired (at low cost) and converted to heat or electricity for<br />
buildings. Much of the plant-based biomass resource is already in a form that is<br />
readily transportable and dispatchable, with no energy transformation necessary,<br />
though ensuring the fuel has the required moisture content if often critical. There<br />
are costs associated with moisture removal/regulation, storage and transport.<br />
And, maintaining the energy quality (i.e., moisture content) of the fuel may<br />
require some environmental controls and consideration for a shelf life that is not<br />
indefinite.<br />
This analysis considered 10 configurations of systems for LPOE sites using<br />
biomass, such as wood mill waste from surrounding areas. Sources from the<br />
LPOE site activity itself such as waste pallets or tree trimmings could also be<br />
used. Combustion of solid biomass can be used to generate steam and topping<br />
cycle for steam co-generation of heat and power at a facility. Some of the heat<br />
output of the boiler may be converted to electricity by a steam turbine in a<br />
cogeneration topping cycle. Boiler fuel may be wood chips or bio-oil. Bio-oil<br />
could also be used by existing boilers and storage tanks with minimal<br />
modifications. Gasification of solid biomass produces a fuel gas by heating the<br />
feed material in a vessel, sometimes with the addition oxygen and or water<br />
(Figure A-5). Decomposition reactions take place that produce a mixture of<br />
hydrogen and CO, along with water, methane, and CO 2 . Anaerobic digestion of<br />
wet feedstocks to produce methane gas was considered, but no cost-effective<br />
systems were identified for LPOE sites.<br />
Unlike the other renewable energy technologies considered in this report, on-site<br />
use of biomass resources involves atmospheric emissions, solid waste residues<br />
(ash), and possible water-borne wastes. It may be expected, however, that<br />
emissions from a gasification operation could be no worse than those of a directburn<br />
operation.<br />
46
Figure A-5: Biomass-fueled gasifier and boiler<br />
Several technologies are available to convert biomass feedstocks into heat and<br />
electricity. These include direct combustion, gasification, and liquefaction of solid<br />
biomass and anaerobic digestion of liquid biomass. In this study, we considered<br />
combustion or gasification and combustion of dry biomass feedstocks such as<br />
wood mill waste available in the area. Dry sources of waste from the LPOE site<br />
itself may also be considered if the site were to include an inventory of waste<br />
streams, such as waste pallets or tree trimmings. Anaerobic digestion of wet<br />
feedstocks is considered in this analysis to produce methane gas. Wet waste<br />
streams include confined animal waste from surrounding areas.<br />
A.2.3.1<br />
Biomass Resource Data<br />
Biomass fuel resources available at each LPOE site were not provided by <strong>GSA</strong>.<br />
Biomass resources considered from surrounding areas include:<br />
Crop Residues (Dry Tonnes/Year)<br />
The following crops were included in this analysis: corn, wheat, soybeans, cotton,<br />
sorghum, barley, oats, rice, rye, canola, dry edible beans, dry edible peas,<br />
peanuts, potatoes, safflower, sunflower, sugarcane, and flaxseed. The quantities<br />
of crop residues that can be available in each county are estimated using total<br />
grain production, crop to residue ratio, moisture content, and taking into<br />
consideration the amount of residue left on the field for soil protection, grazing,<br />
and other agricultural activities from USDA, National Agricultural Statistics<br />
Service, 2002 data. [ref. 1]<br />
47
Orchard and Grape (Dry Tonnes/Year)<br />
Pruning from orchards and vineyards were estimated for California only from<br />
USDA, 2002 data. [ref. 1]<br />
Forest Residues (Dry Tonnes/Year)<br />
Forest residues are logging residues and other removable material left after<br />
carrying out silviculture operations and site conversions. Logging residue<br />
comprises unused portions of trees, cut or killed by logging and left in the woods.<br />
Other removable materials are the unutilized volume of trees cut or killed during<br />
logging operations from USDA, Forest Service's Timber Product Output<br />
database, 2002. [ref. 1]<br />
Primary Mill Residues (Dry Tonnes/Year)<br />
Primary mill residues include wood materials (coarse and fine) and bark<br />
generated at manufacturing plants (primary wood-using mills) when round wood<br />
products are processed into primary wood products, like slabs, edgings,<br />
trimmings, sawdust, veneer clippings and cores, and pulp screenings from<br />
USDA, Forest Service's Timber Product Output database, 2002. [ref. 1]<br />
Secondary Mill Residues (Dry Tonnes/Year)<br />
Secondary mill residues include wood scraps and sawdust from woodworking<br />
shops — furniture factories, wood container and pallet mills, and wholesale<br />
lumberyards.<br />
Urban Wood Waste (Dry Tonnes/Year)<br />
This analysis includes wood residues from municipal solid waste (MSW) (wood<br />
chips and pallets), utility tree trimming and/or private tree companies, and<br />
construction and demolition sites from U.S. Census Bureau, 2000 Population<br />
data, BioCycle Journal, State of Garbage in America, January 2004; County<br />
Business Patterns 2002. [ref. 1]<br />
Methane Emissions from Landfills (Tonnes/Year)<br />
Three key factors were considered for this study: total waste in place, landfill<br />
size, and geographic location (arid or non-arid climate) from EPA, Landfill<br />
Methane Outreach Program (LMOP), 2003. [ref. 1]<br />
48
Methane Emissions from Manure Management (Tonnes/Year)<br />
The following animal types were included in this analysis: dairy cows, beef cows,<br />
hogs and pigs, sheep, chickens and layers, broilers, and turkey. The methane<br />
emissions were calculated by animal type and manure management system from<br />
USDA, National Agricultural Statistics Service, 2002 data. [ref. 1]<br />
Methane Emissions from Domestic Wastewater Treatment (Tonnes/Year)<br />
The methane generation is estimated using the methodology from the EPA<br />
Inventory of U.S. Greenhouse Gas Emissions and Sinks: 1990-2003 and from<br />
U.S. Census Bureau, 2000 Population data<br />
http://www.nrel.gov/docs/fy06osti/39181.pdf. [ref. 1]<br />
Figure A-6: Biomass resources in the U.S. by tonnage<br />
49
A.2.3.2<br />
Technology Characteristics of Biomass Energy Conversion<br />
Configurations<br />
The emerging biomass energy sector is focusing on increasing the conversion<br />
efficiency of solid biomass-based fuels compared to the standard boiler and<br />
steam-cycle configuration. The technology platforms considered in this analysis<br />
are:<br />
1. Thermochemical means of converting biomass via gasification;<br />
2. Pyrolysis; and<br />
3. Anaerobic digestion (AD).<br />
These technologies convert solid fuel into liquid and gaseous intermediaries<br />
suitable for conventional and advanced power generation systems. While further<br />
R&D is needed to increase reliability, reduce maintenance costs, and reduce<br />
capital costs, they are already penetrating the biomass energy sector in a<br />
number of countries. Within these technology platforms, several different prime<br />
movers have been considered for conversion of the intermediate fuels to heat<br />
and power. While any combination of these configurations may be possible,<br />
gasification and anaerobic digestion with conventional steam cycle are selected<br />
to be included in the optimization. Ten configurations in four platforms in all have<br />
been considered and are described as follows:<br />
Combustion Platform<br />
Combustion of biomass to generate steam, and topping cycle for steam cogeneration<br />
of heat and power<br />
Biomass heat is provided by a boiler of a capacity determined as a result of the<br />
optimization. Cost and combustion efficiency of the boiler are specified. Some<br />
of the heat output of the boiler may be converted to electricity by a steam turbine<br />
in a cogeneration topping cycle. Boiler fuel may be wood chips or bio-oil. Bio-oil<br />
use could be used by existing boilers and storage tanks with minimal<br />
modifications.<br />
Gasification Platform<br />
Gasification is a high-temperature process that is optimized to produce a fuel gas<br />
with a minimum of liquids and solids. Gasification consists of heating the feed<br />
material in a vessel with or without the addition of oxygen. Water may or may not<br />
be added. Decomposition reactions take place, and a mixture of hydrogen and<br />
CO are the predominant gas products, along with water, methane, and CO 2 .<br />
• Configuration 1A Biomass Gasification /Steam Cycle: This configuration<br />
is a biomass gasification system fueling a steam cycle. The system<br />
gasifies biomass and immediately burns the syngas in a heat-recovery<br />
50
steam generator (HRSG) to produce steam for the steam turbine. The<br />
combined gasification and boiler efficiency is about 64 percent. The<br />
steam-to-electricity conversion efficiency of a standard steam cycle is<br />
taken as 50 percent while heat can be recovered at about 80 percent<br />
effectiveness. O&M costs should be very similar to a conventional<br />
biomass fired boiler.<br />
• Configuration 1B Biomass Gasification / Spark Ignition Reciprocating<br />
Engine: This configuration considers a slightly more advanced biomass<br />
gasification process called pyrolytic gasification whereby a high-Btu<br />
content syngas is produced by externally heating biomass. The syngas<br />
generated in this process then has sufficient energy content to run sparkignition<br />
reciprocating engines. Typically these engines are de-rated to<br />
account for the reduced energy content of the syngas when compared<br />
with natural gas. Hence the engine combined heat and power (CHP)<br />
costs on a $/kW basis are higher than for a natural gas system. The fuelto-electricity<br />
conversion efficiency of a gas engine operating on syngas is<br />
roughly 37 percent based on Lower Heating Value, and heat recovery<br />
effectiveness is typically around 80 percent. The O&M cost reflected here<br />
represents the O&M cost for the gasification plant and the gas engines;<br />
roughly $18/MWh.<br />
Figure A-7: Platform 1B biomass gasification with syngas utilization via<br />
spark-ignition reciprocating engines<br />
• Configuration 1C Biomass Gasification / Combustion Turbine Combined<br />
Cycle: The last configuration considered for gasification systems is the<br />
combined cycle. This is the least commercialized configuration of the<br />
51
three systems and costs are, therefore, less certain. The gasification<br />
system cost has been assumed to be equal to Configuration 1B; however<br />
it may actually require more gas-cleanup systems and could likely be<br />
higher in reality. The combined-cycle cost is indicative of natural gas<br />
combined-cycle costs with a slight power output de-rating for the syngas.<br />
The same gasification efficiency has been assumed as for Configuration<br />
1B and the combined cycle will see a decreased efficiency relative to the<br />
natural gas baseline. However, future improvements in process design<br />
should be able to bring the efficiency up considerably. Heat recovery has<br />
been assumed at zero because the system would likely be at utility-scale<br />
and would use a condensing steam turbine for maximum electrical<br />
generation. The system has a lower O&M cost compared to the gas<br />
engine configuration but higher O&M cost than the steam cycle. Future<br />
integrated gasification and combined cycle (IGCC) configurations utilizing<br />
pressurized oxygen-blown gasification would have higher plant efficiencies<br />
than what is shown here.<br />
Pyrolysis Platform<br />
• Configuration 2A Pyrolysis / Steam Cycle: Configuration 2A is fast<br />
pyrolysis followed by a conventional steam cycle. The efficiency of<br />
biomass pyrolysis-to-bio-oil is about 77 percent while the boiler efficiency<br />
would be roughly 80 percent, resulting in a total efficiency of 61 percent.<br />
The cost for the pyrolysis plant is given in $ per hourly million Btu of bio-oil<br />
production. The steam-to-electricity conversion efficiency of a standard<br />
steam cycle is taken as 50 percent and heat recovery around 70 percent.<br />
O&M cost includes the O&M for the steam cycle and the pyrolysis plant in<br />
terms of hourly million Btu of bio-oil utilization.<br />
• Configuration 2B Pyrolysis / Compression Ignition Engine: The second<br />
pyrolysis configuration considers a fast-pyrolysis plant fueling modified<br />
compression ignition engines. This system has an advantage over 1B<br />
because liquid-fueled compression-ignition engines have higher<br />
efficiencies. Published literature indicates that diesel engines burning biooil<br />
achieve comparable efficiencies to those using diesel fuels, although<br />
modifications to the fuel handling system for preheating the bio-oil are<br />
required. Heat recovery effectiveness is assumed to be 80 percent.<br />
• Configuration 2C Pyrolysis / Combustion Turbine Combined Cycle: The<br />
final configuration for a fast-pyrolysis plant is to fire the bio-oil in a<br />
combustion turbine combined cycle. Research on the subject indicates<br />
that modified simple-cycle combustion turbines can easily reach 28<br />
percent fuel-to-electricity conversion efficiency with an expected<br />
combined-cycle efficiency of 35 percent. However, they have been shown<br />
to operate at or above rated turbine power output; thus the combined<br />
cycle is not de-rated and the cost is shown for a conventional natural gas<br />
52
combined cycle. It is likely that the first commercial system using this<br />
configuration will have much higher combined-cycle efficiencies but this<br />
probably represents the current state-of-the-art. As in Configuration 1C, it<br />
is assumed that a bio-oil-fired combined cycle will not have heat recovery<br />
for district heating applications.<br />
Anaerobic Digestion Platform<br />
• Configuration 3A Anaerobic Digestion / Spark Ignition Engine: This<br />
configuration involves anaerobic digestion of mixed energy crops and<br />
manure which would be typical for farm-based applications in the 100 kW<br />
to 500 kW scale. These smaller-scale gas engines operating on digester<br />
gas are typically not de-rated as much as for syngas and have lower<br />
installed costs. The digester efficiency has been assumed to be 57<br />
percent which is an average efficiency for different types of energy crop<br />
and manure feedstocks. The efficiency for AD systems is lower because<br />
they can only utilize the volatile solids content while the lignocellulosic<br />
material is removed and sold as fiber. The efficiency of smaller-scale gas<br />
engines is slightly lower at 35 percent, compared to larger engines, while<br />
heat recovery is also less efficient. Plant capacity factors are dependant<br />
mainly on the AD systems and 92 percent is the goal for many<br />
applications.<br />
Figure A-8: Platform 3A anaerobic digester and spark-ignition engine with<br />
heat recovery<br />
• Configuration 3B Anaerobic Digestion / Microturbine: Microturbines can<br />
also be used with digester gas and offer a good fit at these small scales.<br />
53
These systems offer lower electrical efficiency but higher heat recovery<br />
because of the higher-temperature flue gases.<br />
• Configuration 3C Anaerobic Digestion / Molten Caronate Fuel Cell: The<br />
final configuration considers an anaerobic digester supplying by a molten<br />
carbonate fuel cell (MCFC). The MCFC is the only commercialized CHP<br />
fuel cell and has been proven on biogas. This configuration has the<br />
highest electrical efficiency but lower heat recovery efficiency because<br />
heat is consumed by the internal-reforming process of the fuel cell.<br />
Capacity factor for MCFC running on biogas has been observed at around<br />
85 percent but can be expected to increase as their commercial use<br />
increases. This system is also the most expensive of the 3 platforms<br />
considered here but could qualify for incentives for both the AD system<br />
and the fuel cell.<br />
Energy savings consist of savings in natural gas and electricity. Natural gas<br />
savings are limited to the minimum of:<br />
1. Base case natural gas use; or<br />
2. Renewable energy heat generating capacity.<br />
Electric savings are limited to the minimum of electric peak, then renewable<br />
energy generation above that is treated as wholesale power to the utility. Electric<br />
savings are limited to:<br />
1. The minimum of cogeneration size (kW) or<br />
2. Heat generating capacity of the plant times heat-to-electric cogeneration<br />
efficiency.<br />
Thermal energy as a by-product of electric generation is added back into the gas<br />
savings but multiplied by a heat exchanger effectiveness.<br />
E s, gas = C boiler * η biomass boiler *8760 * CFboiler (1-η cogeneration +(1- η cogeneration )*e hx /<br />
η gas boiler<br />
E s, electric = Cboiler * η biomass boiler *8760 * CFboiler *η cogeneration<br />
where<br />
• C boiler = biomass boiler size (M Btu/h)= variable determined by the<br />
optimization<br />
• CF boiler = capacity factor (% of time operational)<br />
• η cogeneration is the efficiency of the electric generator<br />
• e hx is the effectiveness of the heat recovery heat exchanger<br />
• η boiler = auxiliary heater efficiency.<br />
Boiler heat delivery (therms)=boiler size * capacity factor<br />
54
Biomass initial cost ($)=boiler size * cost per MBH + electric cogen size * kW of<br />
cogen * city cost adjustment factor from RS Means cost estimating manuals<br />
Biomass cogeneration size (kW)=variable determined by optimization<br />
Biomass gas savings (therms/year)=minimum of site gas use and thermal energy<br />
provided by boiler minus that converted to electricity divided by heat recovery<br />
steam generator effectiveness<br />
Biomass electric delivery (kWh/year)=minimum of electric energy generation as<br />
calculated by cogen capacity times capacity factor or as limited by boiler<br />
capacity, boiler efficiency, and boiler capacity factor<br />
Biomass capacity factor=electric delivery divided by cogen capacity and 8760 h/y<br />
Biomass annual utility cost savings ($/year)=minimum of cogen capacity or<br />
demand (kW) credited at retail rate plus any generation in excess of that credited<br />
at avoided cost plus federal production incentive times electric generation plus<br />
gas savings times gas rate<br />
Tons of fuel used=boiler heat delivered for both process heat and cogen divided<br />
by boiler efficiency and divided by heating value of fuel<br />
Radius to collect fuel (miles)=radius calculated from area quotient of fuel required<br />
(tons) and density (tons/square mile)<br />
per ton fuel cost ($/ton)=fixed cost ($/ton) plus trucking cost ($/ton/mile)<br />
Fuel cost ($) =fuel used minus fuel available onsite times fuel cost ($/ton)<br />
State tax credit (%)=variable to be input by user<br />
Federal tax credit (%)=variable to be input by user<br />
Rebate ($)=variable to be input by user<br />
Biomass cost w/incentives ($)=boiler cost above minus any rebates or tax credits<br />
Biomass O&M cost ($/year)=$ per MBH of boiler capacity per year<br />
Biomass payback period (years)=cost with incentives subtracted divided by cost<br />
savings minus O&M costs and minus fuel costs.<br />
NREL’s consultant, Econergy International, has assembled indicative metrics for<br />
energy efficiency, equipment capital costs, and plant operation and maintenance<br />
costs. [ref. 13]. While some of these numbers have come from specific projects<br />
that Econergy has been involved with, others are representative estimates<br />
provided to Econergy by technology providers active in the space. Other costs<br />
55
not accounted for in this analysis include development cost, land, enclosure<br />
buildings, and balance-of-plant. [ref. 17]<br />
Table A-5: Characteristics of Biomass Heat and Power Technologies Used<br />
for Analysis<br />
C ombus tion with s team topping<br />
cycle cogeneration<br />
B iomas s gas ification with<br />
s yngas utilization via conventional<br />
s team cycle<br />
B iomas s gas ification with<br />
s yngas utilization via s parkignition<br />
reciprocating engines<br />
1C B iomass gas ifica-tion with<br />
syngas utiliza-tion via combus -<br />
tion turbine combined cycle<br />
B iomas s fas t pyrolys is with biooil<br />
utilization via conventional<br />
steam cycle<br />
B iomas s fas t pyrolys is with biooil<br />
utilization via compres s ionignition<br />
reciprocating<br />
engines<br />
B iomas s fas t pyrolys is with biooil<br />
utilization via combus tion<br />
turbine combined cycle<br />
Anae-robic Diges -tion of<br />
biomass with biogas utilization<br />
via s parkignition reciprocating<br />
engines<br />
AD of biomas s with biogas<br />
utilization via micro-turbine<br />
AD of biomas s with biogas<br />
utilization via molten carbonate<br />
fuel cell<br />
Gasifier/Boiler /Digester<br />
Cost ($/MBH)<br />
500,000 195,802 195,802 195,802 223,590 223,590 223,590 419,918 419,918 419,918<br />
Cogen Cost ($/Kw) 1,650 700 1,300 815 700 1,300 747 1,000 1,225 4,500<br />
Fuel Storage and<br />
Handling ($/MBH)<br />
250,000 250,000 250,000 250,000 250,000 250,000 250,000 250,000 250,000 250,000<br />
Boiler Efficiency 0.75 0.64 0.75 0.75 0.61 0.77 0.9 0.57 0.57 0.57<br />
Cogen Efficiency 0.3 0.5 0.37 0.47 0.33 0.45 0.35 0.35 0.3 0.45<br />
Boiler Capacity Factor 0.85 0.85 0.85 0.85 0.85 0.85 0.85 0.92 0.92 0.85<br />
Hx effectiveness 0.7 0.8 0.8 0 0.8 0.8 0 0.6 0.66 0.38<br />
Fixed Cost Per Ton 20 20 20 20 20 20 20 20 20 20<br />
Trucking Cost<br />
($/sqmi/ton)<br />
Federal Production Tax<br />
Credit ($/kWh)<br />
Biomass O&M Cost<br />
($/yr-MBH)<br />
1 1 1 1 1 1 1 1 1 1<br />
0.01 0.019 0.019 0.019 0.019 0.019 0.019 0.019 0.019 0.019<br />
15,000 25,079 57,518 43,139 25,079 31,452 24,913 43,377 44,372 42,669<br />
A.2.3.3<br />
Air Quality Concerns<br />
Unlike the other renewable energy technologies considered in this report, on-site<br />
use of biomass resources involves atmospheric emissions, solid waste residues<br />
(ash) and possibly water-borne wastes. While the decomposition of waste into<br />
simpler compounds by gasification should reduce emissions, detailed data for<br />
gasification could not be found in the literature (except for coal and clean wood).<br />
It may be expected, however, that emissions from a gasification operation could<br />
be no worse than those of a direct-burn operation which may be found in the<br />
56
literature. The following values of lbs/ton for direct combustion of refuse-derivedfuel<br />
are from Emissions From Integrated MSW Strategies [ref. 13]:<br />
• Particulates 0.05;<br />
• CO 2.06;<br />
• Hydrocarbons 0.08;<br />
• NO x 2.64;<br />
• Methane 2.29;<br />
• CO 2 1460;<br />
• Water 970;<br />
• NMOC 0.12;<br />
• Dioxin/furan 0.0038;<br />
• Sulfur 1.1;<br />
• Hydrogen 0.26.<br />
Also, the following values are for the same publication for anaerobic digestion:<br />
• Particulates 0.02;<br />
• CO 0.79;<br />
• Hydrocarbons 0.08;<br />
• NO x 0.32;<br />
• Methane 14.34;<br />
• CO 2 437;<br />
• Water 188;<br />
• NMOC 0.75;<br />
• Dioxin/furan NA;<br />
• Sulfur NA;<br />
• Hydrogen NA.<br />
In addition to these air emissions, ash from a gasifier using waste as fuel may<br />
contain metals which could leach out in a landfill, depending on the nature of the<br />
waste. Office paper, cardboard, and waste from convenience food operations<br />
have been found to be very uniform and free of metals, PVC, and other materials<br />
which may be of special concern (according to a phone conversation with Robb<br />
Walt of Community Power Systems).<br />
Table A-6: Selected Emissions Data for Each Biomass Conversion<br />
Considered<br />
Fuel<br />
CO 2 emissions<br />
(kg/TJ)<br />
N 2 O emissions<br />
(kg/TJ)<br />
Natural Gas 56,100 0.1<br />
Wood 112,000 4.0<br />
Bio-diesel 70,800 0.6<br />
Bio-gas 54,600 0.1<br />
57
Table A-7: Additional Information for Biomass Energy Resources<br />
Table A-7: Additional Information for Biomass Energy Resources by<br />
(in tons per 50 mile radius of site)<br />
LPOE Site Name Crops Manure Forest<br />
Prim-<br />
Mill<br />
SecMill<br />
Urban Landfill DWWT<br />
Energy<br />
crops<br />
on CRP<br />
land<br />
Dalton Cache, AK 0 0 0 0 8 644 0 9 0 662<br />
Alcan, AK 0 0 0 0 0 235 0 3 0 238<br />
Skagway, AK 0 0 0 0 8 644 0 9 0 662<br />
Lukeville, AZ 10,839 166 0 0 1,840 40,094 11,753 650 0 65,343<br />
Nogales, AZ 18,478 125 0 0 311 9,101 3,211 140 0 31,369<br />
Sasabe, AZ 5,187 70 0 0 1,458 30,734 9,355 496 0 47,302<br />
Douglas, AZ 19,333 122 0 0 11 7,024 2,313 107 0 28,912<br />
San Luis, AZ 42,987 45 0 0 776 11,511 2,649 174 0 58,144<br />
Naco, AZ 18,478 125 0 0 311 9,101 3,211 140 0 31,369<br />
San Luis AZ (not built<br />
yet)<br />
Total<br />
42,987 45 0 0 776 11,511 2,649 174 0 58,144<br />
Nogales, AZ 7,490 86 0 0 1,473 26,678 8,481 428 0 44,637<br />
Calexico West, CA 44,208 346 0 0 3,499 58,405 14,892 841 0 122,194<br />
San Ysidro, CA 1 0 0 0 0 0 0 0 0 0<br />
Andrade, CA 64,727 3,249 0 0 2,766 49,500 15,931 715 0 136,890<br />
Otay Mesa, CA 285 1,177 0 0 12,032 200,957 57,099 2,901 0 274,453<br />
Tecate, CA 285 1,177 0 0 12,032 200,957 57,099 2,901 0 274,453<br />
Calexico, CA 50,090 167 0 0 1,699 28,173 6,195 406 0 86,732<br />
Eastport, ID 18,539 27 138,394 0 503 4,398 0 62 0 161,925<br />
Porthill, ID 18,620 32 127,789 5,044 479 4,604 0 66 0 156,636<br />
Ferry Point, ME 1 0 350,172 7,368 393 5,153 454 81 0 363,624<br />
Coburn Gore, ME 1 10 653,116 279,746 862 10,903 4,546 167 0 949,353<br />
Fort Fairfield, ME 1 5 159,679 15,386 794 4,617 1,432 67 0 181,984<br />
Houlton, ME 1 4 326,377 36,170 1,099 8,799 3,590 136 0 376,179<br />
Jackman, ME 1 11 518,031 97,495 470 6,347 5,320 96 0 627,773<br />
Limestone, ME 1 4 133,923 12,394 687 3,849 1,124 55 0 152,040<br />
Orient, ME 1 3 412,738 43,305 1,152 10,703 4,552 168 0 472,623<br />
Vanceboro, ME 1 1 346,071 18,865 670 6,819 1,797 107 0 374,333<br />
VanBuren, ME 1 3 113,408 10,470 583 3,258 948 47 0 128,720<br />
Milltown ME 1 0 350,172 7,368 393 5,153 454 81 0 363,624<br />
St. Francis, ME 1 6 206,653 21,745 930 5,220 1,483 75 0 236,116<br />
Madawaska, ME 1 4 117,956 10,890 606 3,389 986 49 0 133,883<br />
Fort Kent, ME 1 5 152,688 14,097 785 4,386 1,276 63 0 173,304<br />
St. Francis, ME 1 5 152,688 14,097 785 4,386 1,276 63 0 173,304<br />
Detroit Cargo, MI 318,256 719 20,936 4,296 29,694 570,671 222,425 7,934 49,513 1,224,448<br />
Intl Bridge, MI 1 0 0 0 0 0 0 0 0 0<br />
58
Table A-7: Additional Information for Biomass Energy Resources by<br />
(in tons per 50 mile radius of site)<br />
LPOE Site Name Crops Manure Forest<br />
Prim-<br />
Mill<br />
SecMill<br />
Urban Landfill DWWT<br />
Energy<br />
crops<br />
on CRP<br />
land<br />
Amb. Bridge, MI 1 0 0 0 0 0 0 0 0 0<br />
Grand Portage, MN 1 0 38,311 13,536 1 507 0 7 32 52,397<br />
Total<br />
Noyes, MN 500,070 226 35,204 44 76 2,930 1,359 45 1,199,69 9<br />
Roseau, MN 229,076 217 177,475 54,870 1,098 6,726 5,401 105 1,449,77 3<br />
1,739,657<br />
1,924,744<br />
Intl Falls, MN 1,048 14 269,852 128,794 330 4,370 0 69 905 405,385<br />
Baudette, MN<br />
1,311,91<br />
8<br />
5,392 86,651 12,945 36,953 300,613 107,005 4,984 504,133 2,370,597<br />
Chief Mt, MT 66,556 222 36,882 646,384 453 4,385 630 60 0 755,575<br />
Piegan, MT 88,032 269 50,559 890,254 625 5,663 868 78 0 1,036,352<br />
Raymond, MT 209,297 98 0 0 23 1,323 0 19 0 210,761<br />
Rooseville, MT 209,297 98 0 0 23 1,323 0 19 0 210,761<br />
Sweetgrass, MT 144,351 288 357 0 2 1,750 0 20 0 146,770<br />
Turner, MT 42,720 68 712 0 0 757 0 9 0 44,267<br />
Ambrose, ND 276,612 125 0 0 174 2,034 0 31 118,177 397,155<br />
Dunseith, ND 528,104 92 1,464 0 153 3,105 0 49 1,393,48 0<br />
1,926,450<br />
Portal, ND 333,750 90 1,704 0 129 2,139 0 33 334,545 672,393<br />
St. John ND 475,296 64 1,434 0 120 2,705 0 42 1,133,94 5<br />
Pembina, ND 508,960 216 30,362 25 49 2,738 785 42 1,094,21 9<br />
1,613,610<br />
1,637,400<br />
Columbus, NM 7,122 3,487 0 0 89 7,917 0 124 0 18,740<br />
Santa Teresa, NM 13,704 9,564 2,657 10,079 6,766 87,290 20,094 1,328 0 151,484<br />
Alexandria Bay, NY 9,909 982 74,346 229,213 2,219 22,439 11,394 338 11,356 362,200<br />
Champlain, NY 9,909 982 74,346 229,213 2,219 22,439 11,394 338 11,356 362,200<br />
Massena, NY 2,910 627 78,415 8,150 510 14,896 946 226 2,886 109,570<br />
Fort Covington, NY 4,797 698 82,863 7,995 846 17,886 4,848 270 2,300 122,505<br />
Rouses Pt. NY 4,295 1,391 115,712 17,478 3,281 32,784 10,935 519 483 186,883<br />
St John Hwy, NY 4,295 1,391 115,712 17,478 3,281 32,784 10,935 519 483 186,883<br />
Trout, River, NY 5,631 733 85,629 8,786 1,043 19,376 6,612 292 2,068 130,174<br />
Chateaugay, NY 1 0 0 0 0 0 0 0 0 0<br />
Mooers, NY 4,711 1,302 103,458 16,168 3,040 31,305 8,659 494 475 169,616<br />
Jamieson, NY 13,557 392 116,429 95,781 23,417 362,000 88,491 5,498 5,636 711,206<br />
Niagra Falls, NY 90,845 1,040 36,964 25,654 9,249 139,058 64,351 2,139 27,983 397,286<br />
Ogdensburg NY 1 0 0 0 0 0 0 0 0 0<br />
Brownsville/Matamoros<br />
TX<br />
318,924 19 0 0 2,377 59,237 3,284 897 0 384,739<br />
59
Table A-7: Additional Information for Biomass Energy Resources by<br />
(in tons per 50 mile radius of site)<br />
LPOE Site Name Crops Manure Forest<br />
Prim-<br />
Mill<br />
SecMill<br />
Urban Landfill DWWT<br />
Energy<br />
crops<br />
on CRP<br />
land<br />
Gateway, TX 1 0 0 0 0 0 0 0 0 0<br />
Columbia, TX 433 126 0 0 1,200 21,920 6,748 324 0 30,754<br />
Convent, TX 433 126 0 0 1,200 21,920 6,748 324 0 30,754<br />
Del Rio, TX 176 124 0 0 0 5,259 0 75 0 5,637<br />
Donna TX (not built yet) 461,937 63 0 0 3,492 101,686 9,927 1,540 0 578,647<br />
Bridge of the Americas,<br />
TX<br />
Total<br />
12,926 7,598 3,335 12,655 6,732 84,556 20,140 1,284 0 149,230<br />
Eagle Pass, TX 10,155 78 0 0 50 7,794 115 112 0 18,308<br />
Fabens, TX 11,946 2,774 1,806 6,852 6,612 77,110 20,140 1,166 0 128,410<br />
Fort Hancock, TX 12,137 1,236 2,779 10,545 5,516 63,683 16,884 960 0 113,744<br />
El Paso, TX (out leased) 12,848 7,570 2,956 11,216 6,731 84,400 20,140 1,282 0 147,146<br />
Juarez-Lincoln, TX 433 126 0 0 1,200 21,920 6,748 324 0 30,754<br />
Los Indios, TX 428,516 38 0 0 3,234 88,741 7,972 1,345 0 529,847<br />
Laredo TX 433 126 0 0 1,200 21,920 6,748 324 0 30,754<br />
Los Tomates, TX 292,937 17 0 0 2,214 53,500 2,398 810 0 351,878<br />
McAllen, TX 392,098 68 0 0 2,907 90,877 9,927 1,376 0 497,254<br />
McAllen TX (not built<br />
yet)<br />
392,283 74 0 0 2,886 90,829 9,927 1,375 0 497,377<br />
Marfa, TX 1 59 0 0 0 1,439 0 15 0 1,515<br />
Kika de la Garza, TX 410,588 62 0 0 3,062 93,524 9,927 1,417 0 518,581<br />
Paso Del Norte, TX 12,852 7,627 2,883 10,938 6,732 84,465 20,140 1,283 0 146,924<br />
Progreso, TX 467,013 48 0 0 3,556 101,139 9,837 1,532 0 583,127<br />
Roma, TX 90,235 111 0 0 738 32,561 3,970 488 0 128,105<br />
Rio Grande City, TX 201,640 120 0 0 1,591 62,374 8,631 941 0 275,298<br />
Ysleta, TX 1 0 0 0 0 0 0 0 0 0<br />
RR Inspection, TX 326 123 0 0 1,191 21,689 6,698 321 0 30,350<br />
Admin, TX (leased) 377,598 54 0 0 2,855 88,856 9,927 1,346 0 480,638<br />
El Paso, TX (Leased) 12,896 7,687 3,031 11,499 6,734 84,595 20,140 1,285 0 147,869<br />
DOT, TX (leased) 9,866 77 0 0 51 7,795 127 112 0 18,030<br />
Derby Line, VT 1 1,260 378,065 297,948 1,704 17,215 11,673 271 4 708,143<br />
Norton, VT 1 886 445,498 422,762 1,445 15,018 10,868 235 0 896,715<br />
Beebe Plain, VT 1 1,310 362,100 255,794 1,739 17,320 11,575 274 6 650,122<br />
Alburg Springs, VT 4,167 1,495 133,093 19,508 3,517 34,727 13,325 551 567 210,955<br />
North Troy VT 276 1,572 314,146 77,379 3,152 26,878 14,750 431 76 438,665<br />
West Berkshire,VT 2,807 1,683 185,553 21,079 3,710 34,972 19,363 558 421 270,150<br />
Derby Line, VT 1 1,276 374,885 287,784 1,724 17,356 11,701 274 5 695,009<br />
Beecher Falls, VT 1 523 486,527 448,182 1,273 11,666 8,980 182 0 957,337<br />
60
Table A-7: Additional Information for Biomass Energy Resources by<br />
(in tons per 50 mile radius of site)<br />
LPOE Site Name Crops Manure Forest<br />
Prim-<br />
Mill<br />
SecMill<br />
Urban Landfill DWWT<br />
Energy<br />
crops<br />
on CRP<br />
land<br />
Canaan, VT 1 552 491,613 454,474 1,318 12,063 9,470 188 0 969,680<br />
East Richford, VT 1,202 1,632 258,410 33,475 3,564 31,299 16,972 501 195 347,254<br />
Richford, VT 1,202 1,632 258,410 33,475 3,564 31,299 16,972 501 195 347,254<br />
Alburg, VT (Joint<br />
ownership)<br />
Total<br />
4,167 1,495 133,093 19,508 3,517 34,727 13,325 551 567 210,955<br />
Highgate Springs 1, VT 3,770 1,600 151,290 18,655 3,613 35,077 17,219 558 527 232,311<br />
Highgate Springs 2, VT 3,770 1,600 151,290 18,655 3,613 35,077 17,219 558 527 232,311<br />
Highgate Springs 3, VT 3,770 1,600 151,290 18,655 3,613 35,077 17,219 558 527 232,311<br />
Blaine, WA 11,507 6,326 5,157 58,802 2,176 19,757 373 281 0 104,384<br />
Danville, WA 3,326 143 61,789 230,098 287 4,798 0 54 0 300,499<br />
Laurier, WA 3,206 167 66,047 257,850 306 5,041 0 57 0 332,676<br />
Mataline Falls. WA 3,206 167 66,047 257,850 306 5,041 0 57 0 332,676<br />
Oroville, WA 3,018 29 31,011 58,813 157 4,029 0 46 0 97,106<br />
Point Robert, WA 3,018 29 31,011 58,813 157 4,029 0 46 0 97,106<br />
Sumas, WA 11,507 6,326 5,157 58,802 2,176 19,757 373 281 0 104,384<br />
Blaine, WA 11,507 6,326 5,157 58,802 2,176 19,757 373 281 0 104,384<br />
Blaine, WA 11,507 6,326 5,157 58,802 2,176 19,757 373 281 0 104,384<br />
Kenneth Ward, WA 11,507 6,326 5,157 58,802 2,176 19,757 373 281 0 104,384<br />
61
Solar Resources<br />
The solar resource available outside the Earth’s atmosphere is immense and<br />
always available. The solar radiation that gets filtered through the atmosphere<br />
with its accompanying clouds, moisture, pollution, etc. is still enormous, though<br />
availability follows daily and seasonal patterns occasionally interrupted by<br />
weather events. The challenge in working with the solar resource for electricity<br />
generating applications is that the resource is relatively diffuse and<br />
unconcentrated.<br />
For making electricity, only bands of the solar spectrum within the visible light<br />
wavelengths are utilized and the objective for PV manufacturers is to utilize as<br />
much of that available energy as possible. For heating applications, whether for<br />
space (air) or materials (mass), the light energy is transformed into heat energy<br />
as it strikes a surface and is absorbed.<br />
In the continental U.S., the intensity of solar radiation during the middle 6-8 hours<br />
of the day is usually in the 500-1000 W/m 2 range. A daily pattern of insolation<br />
intensity can be seen in the graph below.<br />
Figure A-9: Daily insolation pattern integrated into a yearly average of 5.5<br />
sun-hours/day<br />
Source: http://www.solarexpert.com/grid-tie/system-performance-factors.html<br />
To facilitate climate comparison and predict system performance, the amount of<br />
solar radiation that falls on a collector throughout the day has been integrated to<br />
determine the area under the curve. The conventional level of intensity is 1,000<br />
W/m2 (1kW/m2) termed peak sun-hours. The solar resource at a site is often<br />
reported in sun-hours/day which equates to kWh/ m 2 /day. There have been<br />
extensive weather data collection efforts throughout the U.S. for number of years<br />
and with a wide variety of data collectors, end users and end uses in mind.<br />
62
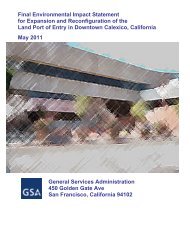
The solar radiation resource data that was selected for resource analysis for<br />
USCG with particular solar technology applications in mind were chosen for three<br />
primary application purposes:<br />
• Solar hot water or photovoltaic (PV) systems that are most commonly<br />
operated at a fixed tilt angle that corresponds to the local latitude<br />
• Transpired solar collectors that mostly commonly are added on to or<br />
affixed in front of vertical south-facing exterior walls<br />
• Horizontal roof-mounted PV systems that have gained popularity due to<br />
relative installation simplicity<br />
An important point to note, and an advantage of solar compared to other<br />
renewable resources, is the fact that the variation of the solar resource from bestto-worst<br />
locations varies by roughly a factor of 2.5. This means that a solar<br />
project can be done essentially anywhere, though 2.5 times as many square feet<br />
of PV or solar collector might be needed for a location with a low solar resource<br />
vs. a location with a high solar resource. The key parameters for determining<br />
cost effective applications will be highly influenced by other site specific factors<br />
beyond solar resource alone.<br />
A.2.4.1<br />
Solar Ventilation Air Preheat<br />
Solar ventilation air preheating (SVP) systems use the sun’s heat to warm air<br />
before it is brought into the building’s HVAC system. Adding inexpensive hot air<br />
generated on cold sunny days to the supply air of an HVAC system can lower<br />
heating bills.<br />
The system consists of metal siding perforated with small holes. The sun heats<br />
the special metal siding (a metal sheathing perforated with small holes) that<br />
covers a portion of the south-facing exterior wall of a building. The sheathing<br />
leaves an 8 to 10 cm plenum into which heat is drawn through the holes. Solar<br />
radiation heats the plate, which loses heat to the air, but the air is drawn into a<br />
small hole before the thin “boundary layer” can mix with the ambient air. The<br />
warm air is added to ventilation air by means of a fan.<br />
SVP systems use a “transpired collector” with holes about 1 mm in diameter and<br />
about 9 mm apart in a metal absorber sheet painted black or other dark, lightabsorbing<br />
color. At this small scale, heat transfer is by conduction rather than<br />
convection and air flow is by viscosity rather than momentum.<br />
The transpired collector plate is held about six inches away from the south wall<br />
by supports to create a plenum. Air is drawn through the wall by power of a fan.<br />
The perimeter is sealed with flashing. It is only for preheating ventilation air;<br />
there is no recirculation to the inlet for reheating. A by-pass damper on the face<br />
63
of the wall admits fresh air without heating in summer. Figure A-11 illustrates<br />
how an SVP system works.<br />
Figure A-10: Solar ventilation air preheating system schematic<br />
SVP are very low maintenance systems as there is only one moving part, the fan.<br />
Due to the low cost of this simple technology (about $20/sf installed) and its high<br />
efficiency, over 2 million sf have been installed, mostly in manufacturing plants in<br />
the Northeast and in Canada.<br />
Savings at each site depend on both the solar resource and the heating degree<br />
days for that site. Solar ventilation preheat is generally cost effective at the<br />
northern sites that can use the heat through much of the year. A site with a<br />
heating season of 4 months or longer could consider this technology. The SVP<br />
system on a US Bureau of Reclamation water treatment plant in Leadville,<br />
Colorado cost $28,000 and saves $4,000 per year. Figure 15 shows the<br />
distribution of the solar resource.<br />
64
Figure A-11: Solar ventilation air preheating system in Leadville, Colorado<br />
Figure A-12: Map of energy savings from solar ventilation preheating<br />
technology<br />
65
The size of a solar ventilation air preheating system is determined by the<br />
optimization, but there are some constraints. For a given amount of ventilation<br />
air the suggested size is given by the equation<br />
Ac = Vbldg / v wall<br />
where<br />
• A C = solar collector area (ft 2 or m 2 ), might be limited by available wall<br />
area.<br />
• V bldg = building outside air flow rate (CFM or l/min)<br />
• v wall = per-unit-area airflow through wall (CFM/ft 2 or l/min/m 2 , typically 4 to<br />
8 CFM/ft 2 . If wall area is sufficient, use the lower value of 4 CFM/ft 2 .<br />
The size of the south-facing wall is a constraint. CFM/ft 2 is also a constraint, so<br />
that the boundary-layer effect that leads to the high efficiency is valid.<br />
Energy delivered by the solar ventilation air preheating system and fuel energy<br />
saved are calculated by the equations<br />
Q solar<br />
= A<br />
c q useful * (#days/week/7)/ η heating<br />
and<br />
Q saved<br />
= Q solar<br />
/η heating<br />
where<br />
• Q solar = annual heat delivery of solar system (kWh/yr or Mbtu/yr)<br />
• Q saved<br />
= annual fuel energy saved (kWh/yr)η heating = heating system<br />
efficiency<br />
Additional fan power required to pull the ventilation air through the solar<br />
ventilation preheat system is calculated by the equation<br />
Q fan<br />
= A c<br />
q fan<br />
* (#hours/day * #days/week* #weeks/year)<br />
where<br />
• q fan<br />
= fan energy required to pull air through collector (taken to be 1 W/ft 2<br />
for this analysis).<br />
Solar ventilation air preheating system cost is estimated as per the total installed<br />
cost in Table A-8.<br />
Table A-8: Characteristics of Solar Ventilation Preheat Technology Used for<br />
Analysis<br />
66
Material Cost $14.00/ft 2<br />
Installation Cost $14.00/ft 2<br />
Ductwork $4.00/ft 2<br />
Other $4.00/ft 2<br />
Initial Cost $36.00/ft 2<br />
O&M Cost $0<br />
Table A-9 lists the ventilation rates required for each type of space at each<br />
LPOE. Often the size is limited by the south wall area which was estimated from<br />
the LPOE site layouts provided. The GIS resource data of Table A-17 lists the<br />
resource information for the SVP technology (which combines both solar<br />
resource and heating degree day information) used in the estimation of annual<br />
energy delivery. Table B-16 lists the details of the solar ventilation preheating<br />
analysis including size of the transpired collector, cost, annual energy delivery,<br />
annual cost savings, and payback period.<br />
Table A-9: Ventilation Rates Used for Analysis<br />
Warehouse Office Lab Residence Other<br />
Ventilation Rate (cfm//ft 2 ) 0.02 0.14 1.00 0.00 0.34<br />
A.2.4.2<br />
Solar Water Heating<br />
Solar water heating systems use the sun to heat water that is stored in tanks for<br />
later use. Operation is similar to a hydronic heating system, with the solar<br />
collectors as heat sources, heat exchangers to heat potable water, pumps to<br />
circulate the fluid, expansion tanks, pressure relief valves, flush and fill valves,<br />
and controls. The conventional hot water heating system is used as a back-up to<br />
the solar system. Buildings at LPOE sites that use expensive electricity or<br />
propane to heat water will benefit from adding solar water heating systems when<br />
expanding or remodeling.<br />
There are three types of solar water heating collectors:<br />
1. Unglazed plastic collectors for low temperatures such as swimming pool<br />
heating;<br />
2. Glazed, insulated flat plate collectors for mid-temperature service hot<br />
water; and<br />
3. Evacuated tube collectors with reflectors for high temperature<br />
applications.<br />
67
Figure A-13: Typical solar water heating system schematic<br />
Typical solar water-heating systems are sized to provide 40 percent to 70<br />
percent of water-heating requirements. Typical solar pool-heating systems use<br />
unglazed polymer collectors to provide 50 percent to 100 percent of swimming<br />
pool heating requirements. Typical systems generate 1,600 therms or 46,000<br />
kWh of energy per year and cost $0.30 to $0.50/Watt (of peak capacity). Typical<br />
flat plate collectors deliver about 900 kWh/m 2 /year and cost $1/Watt to $2/Watt,<br />
or 8¢/kWh. The energy costs of solar thermal systems have declined by more<br />
than 50 percent due to technology improvements. Parabolic trough collectors<br />
with evacuated tubes cost about $1/Watt and deliver about 900 kWh/m 2 /year.<br />
Key companies developing or selling solar water heaters include: Alternative<br />
Energy Technologies; Harter Industries; Aquatherm; Duke Solar; FAFCO;<br />
Heliodyne, Inc.; Radco Products; Sun Earth; Sun Systems; ThermoTechnologies;<br />
Industrial Solar Technology and Thermal Conversion Technologies. [ref. 5]<br />
About 1.2 million solar water-heating systems have been installed in the United<br />
States, mostly from 1981 to 1986 when federal and state tax credits were in<br />
effect. Many of these buildings use expensive electricity or propane to heat<br />
water and sites should consider solar hot water when ports are expanding or<br />
remodeling.<br />
68
Figure A-14: Solar water heating system at Chickasaw National Recreation<br />
Area, Oklahoma<br />
Water heating load (gallons per day) is estimated according to the statistics<br />
available in reference [ref. 9] and listed in Table A-10.<br />
Table A-10: Information for Water Heating Load Used for Analysis<br />
Hot Water as Fraction of Total Building Energy<br />
Office 0.089506<br />
Education 0.21942<br />
Health Care 0.262063<br />
lodging 0.403771<br />
public assembly 0.153914<br />
food service 0.112016<br />
food sales 0.042623<br />
warehouse 0.052219<br />
other 15.3 0.08885<br />
all 0.152486<br />
source: DOE/OBT Energy Databook<br />
SDHW Efficiency 0.4<br />
Cost<br />
73 $/sf<br />
O&M Cost<br />
0.005 % of initial cost<br />
Aux efficiency 0.8<br />
69
Suggested size for the solar water heating system is estimated using the<br />
equation<br />
A c =<br />
L .<br />
(η solar I max )<br />
where<br />
• A c = collector area (m 2 )<br />
• L = daily load (kWh/day)<br />
• η solar = efficiency of solar system (typically 0.429 for all locations from<br />
reference [ref. 12])<br />
• I max = maximum daily solar radiation (kWh/m 2 /day)<br />
Using I max in the above equation means the system is designed to meet the load<br />
on the sunniest days of the year. This sizing strategy optimizes economic<br />
performance since there is no excess capacity. Annual Energy Savings<br />
(kWh/year) is estimated by the equation<br />
E s = A c I ave η solar 365<br />
η boiler<br />
where<br />
• I ave = average solar radiation (kWh/m 2 /day)<br />
• η boiler = auxiliary heater efficiency.<br />
Auxiliary water heater efficiency is taken from reference [ref. 16] for different<br />
types of water heaters:<br />
• gas 0.43 to 0.86, assume 0.57;<br />
• electric 0.77 to 0.97, assume 0.88;<br />
• heat pump assume 2.0;<br />
• propane 0.42 to 0.86, assume 0.57;<br />
• oil 0.51 to 0.66, assume 0.52.<br />
• If fuel use was not provided electricity was assumed to be used for water<br />
heating.<br />
Solar system cost is estimated according to the formula<br />
C = (c solar<br />
Ac-rebate)*(1-federal tax credit)*(1-state tax credit)<br />
where<br />
• C = installed cost of solar system ($)<br />
• c solar = per-unit-area cost of installed solar system ($/m2), typically $400/<br />
m2 for large systems up to $1200/m2 for small systems. $73/sf ($800/m 2 )<br />
70
is the value used in this analysis. Any incentives, in terms of %-of-cost<br />
rebate or $ per m 2 rebate are subtracted from the installed cost.<br />
Annual cost savings is estimated by the equation<br />
S = Es Ce-C O&M + Es*C production incentive<br />
where<br />
• S = annual cost savings ($/year)<br />
• Ce = cost of auxiliary energy ($/kWh).<br />
• Cproduction incentive = payments or credits for delivered energy ($/kWh).<br />
The cost of energy is calculated for the water heating fuel type from use<br />
and cost data provided for each center.<br />
Any other annual costs or revenues, such as O&M costs or production<br />
incentives, are added or subtracted from the annual cost savings.<br />
A.2.4.3<br />
Solar Electric Photovoltaics (PV)<br />
Figure A-15: PV System of the type considered in report<br />
PV modules convert sunlight directly into electricity with no moving parts, no<br />
noise, no pollution, and very little maintenance. They are highly reliable and last<br />
20 years or longer. Solar cells are fabricated from thin semi-conductor wafers<br />
with an electric field applied to the cell to make one side positive and one side<br />
negative. When the sun’s light strikes the solar cell, electrons are knocked loose<br />
from one side of the wafer and conducted from one side of the solar cell to the<br />
71
other with an embedded conductor wire. This movement of electrons along the<br />
conductor wire is an electric current or electricity, which is collected and used to<br />
power any electrical device.<br />
Figure A-16: Photovotaic system schematic<br />
Over the past two decades, significant improvements have been made in the<br />
efficiency of PV materials and manufacturing costs have been driven down, yet<br />
PV is still more expensive than conventional grid electricity in the U.S. The cost<br />
of PV-generated electricity has dropped 15- to 20-fold in the last 40 years; and<br />
grid-connected PV systems currently sell for about $5/Wp to $8/Wp (20¢/kWh to<br />
32¢/kWh), including support structures, and power conditioning. Complete<br />
system cost is reported at $8,500/kW in reference [ref. 7.]<br />
In this analysis we represent cost as a function of size as $9.8065 multiplied by<br />
the system size in kW raised to an exponent of -0.0576. Operation and<br />
maintenance (O&M) costs are reported at 0.008 $/kWh produced in Factors<br />
Associated with Photovoltaic System Costs. [ref. 11]<br />
PV’s cost effectiveness is dependent to a large degree on the local, state or utility<br />
incentive programs coupled with tax-based incentives. Since the incentives are<br />
included in the model, the results point directly to locations <strong>GSA</strong> should consider<br />
PV.<br />
72
About 288 MW of PV were sold in 2000, and 2,521 MW of PV were sold in 2006,<br />
indicating the growth of this industry. Annual market growth for PV has been<br />
about 25 percent as a result of reduced prices, government incentives and<br />
successful global marketing. Hundreds of applications are cost-effective for offgrid<br />
needs. Almost two-thirds of U.S.-manufactured PV is exported. However,<br />
the fastest growing segment of the market is grid-connected PV, such as roofmounted<br />
arrays on homes and commercial buildings in the United States.<br />
California is subsidizing PV systems because it is considered cost-effective to<br />
reduce their dependence on natural gas, especially for peak daytime loads for<br />
air-conditioning, which matches PV output. [ref. 6]<br />
Current leading PV companies in the U.S. include: Shell Solar; BP Solar; RWE<br />
(ASE); AstroPower (now GE); USSC; Global Solar; First Solar; Evergreen Solar;<br />
and others totaling 104 MW of rated power production manufactured per year.<br />
[ref. 15]<br />
Figure A-17: Solar Resource across the U.S.<br />
The size of the PV system in kW of rated output is determined by the<br />
optimization. In the analysis below, note that units of I, solar radiation, are<br />
(sunhours/day). This unit has the same value as (kWh/m 2 /day) in the data<br />
because photovoltaic devices are rated at 1 kW/m 2 radiation. Solar System Size<br />
is:<br />
P rated = rated PV power (kW)<br />
73
System efficiency is taken to be 77 percent to represent mismatch losses in the<br />
array, losses in the inverter and transformer. Annual Electric Energy Savings are<br />
estimated as<br />
E s = 0.77*P rated I ave 365<br />
where<br />
I ave = average solar radiation (sun hours/day or kWh/m 2 /day)<br />
PV system cost is estimated by the equation<br />
C = (c solar P rated -rebate)*(1-federal tax credit)*(1-state tax credit)<br />
where<br />
• C = installed cost of solar system ($)<br />
• c solar = per-unit cost of installed solar system typically $5.1 to $9.1/watt.<br />
For this analysis we use the value $7.10/watt DC installed cost.<br />
Annual cost savings are estimated by the equation<br />
S = E s C e – C O&M<br />
where<br />
• S = annual cost savings ($/year)<br />
• C e = cost of utility energy ($/kWh)<br />
• C O&M = annual cost of operation and maintenance, taken as 0.143 percent<br />
of installed cost.<br />
Table A-11: Characteristics of PV Technology Used for Analysis<br />
Initial Cost $8,500.00 $/kW RS Means Green Building Project Planning and Cost Estimating, 2006<br />
O&M 0.006 $/kWh<br />
Renewable Energy Technology Characterizations, EPRI TR-109496,<br />
1997.C185<br />
BOS Efficiency 0.77 PVWatts documentation www.nrel.gov<br />
Acres per MW 6.5<br />
A.2.4.4<br />
Solar Industrial Process Heat and Solar Thermal Electric<br />
Solar industrial process heat systems achieve higher temperatures at a faster<br />
speed than do other solar heat collectors. This intensity and speed make solar<br />
industrial process heat systems more suitable for various industrial applications.<br />
74
The application modeled in this study is hot water heating. It is not cost effective<br />
for several reasons.<br />
Solar industrial process heat systems use parabolic trough solar collectors to<br />
focus the sun’s rays onto a receiver pipe running down the focal line of the<br />
trough. The receiver pipe is surrounded by a glass cover pipe to prevent heat<br />
loss. Motors and controls track the azimuth of the sun from east-to-west in a<br />
north-south oriented trough for maximum gain. The concentrating collectors<br />
require direct sun with minimal clouds, moisture or dust. The desert southwest,<br />
which has many clear sunny days every year, is considered the most viable<br />
region for these concentrating systems.<br />
Figure A-18: Illustration of a parabolic trough solar collector<br />
Figure A-19: Illustration of a receiver pipe<br />
75
Since the system has moving parts, it requires preventative and unscheduled<br />
maintenance. In order to displace natural gas (to get to net zero), on-site thermal<br />
storage is required. Thermal storage may consist of fluid tank, tubes in sand, or<br />
tubes in concrete.<br />
An advantage of these systems over PV is that energy storage is part of the<br />
system. The industrial process heat system, depending upon design parameters<br />
and intent, can typically perform well for several hours after sunset adding a<br />
degree of ‘dispatchability’ not normally associated with solar systems.<br />
Energy savings consist of savings in natural gas and electricity. Natural gas<br />
savings are limited to the minimum of:<br />
1. Base Case natural gas use; or<br />
2. Renewable energy heat generating capacity.<br />
Electric savings are limited to the minimum of electric peak, then renewable<br />
energy generation above that is treated as wholesale power to the utility. Electric<br />
savings are limited to:<br />
1. The minimum of cogeneration size (kW); or<br />
2. Heat generating capacity of the plant times heat-to-electric cogeneration<br />
efficiency.<br />
Thermal energy as a by-product of electric generation is added back into the gas<br />
savings but multiplied by a heat exchanger effectiveness.<br />
E s, gas = A c I ave η solar 365 *(1- η cogeneration )*e hx / η boiler<br />
E s, electric = A c I ave η solar 365 *η cogeneration<br />
where<br />
• I ave = average solar radiation (kWh/m 2 /day)<br />
• η cogeneration is the efficiency of the electric generator<br />
• e hx is the effectiveness of the heat recovery heat exchanger<br />
• η boiler = auxiliary heater efficiency.<br />
Solar thermal or solar thermal electric was not found to be cost effective at any of<br />
the LPOE sites. <strong>GSA</strong>’s LPOE sites have limited hot water loads and do not<br />
require the intensity and speed offered by solar industrial process heat systems.<br />
76
Table A-12: Characteristics of Solar Industrial Process Heat Technology<br />
Used for Analysis<br />
Solar Thermal Cost 60 $/sf<br />
O&M Cost $0.127 $/therm/yr<br />
Efficiency 0.33<br />
Cost of Thermal Storage $1,465 $/therm<br />
Hours Per Day of Solar Collection 6<br />
Cogen Cost 1650 $/kW<br />
Cogen Efficiency 0.2<br />
Boiler Capacity Factor 0.85<br />
Hx Effectiveness 0.7<br />
Federal Production tax Credit 0.01 $/kwh<br />
A.3 Site-Specific Information<br />
<strong>GSA</strong> staff provided utility use and cost information for each LPOE. <strong>GSA</strong> also<br />
provided details regarding the square footages of different types of space in each<br />
LPOE. <strong>GSA</strong> did not provide an inventory of waste streams for use in the<br />
biomass fuel assessment, so only feedstocks from the surrounding area were<br />
considered. Table A-13 presents a summary of data provided for each site.<br />
Sites considered in San Luis AZ, Donna TX, and McAllen TX had not been built<br />
yet at the time of the analysis. In these cases a 10,000 square foot building was<br />
considered and energy use and cost were estimated by the square-footage<br />
average of other sites in that state. The titles for these sites in the following<br />
tables have “not built” in the name.<br />
Table A-14, A-15, and A-16 provide the base case consumption and cost<br />
information for electricity, oil, and natural gas, respectively.<br />
77
Table A-13: Location and Size of the 119 LPOE Sites<br />
Table A-13: Location and Size of the 119 LPOE Sites<br />
Address City State<br />
Bldg<br />
Size<br />
(ft 2 )<br />
Warehouse<br />
Area (ft 2 )<br />
Office<br />
Area<br />
(ft 2 )<br />
Laboratory<br />
Area (ft 2 )<br />
Residential<br />
Area (ft 2 )<br />
All<br />
Other<br />
Area<br />
(ft 2 )<br />
Dalton Cache, AK AK 14,942 300 0 0 5,820 8,822 18<br />
Alcan, AK M 1221 8<br />
Tenths Ak<br />
Highway<br />
Skagway, AK<br />
Lukeville, AZ<br />
Nogales, AZ<br />
Sasabe, AZ<br />
Douglas, AZ<br />
San Luis, AZ<br />
Naco, AZ<br />
San Luis AZ, not built<br />
Klondike<br />
Highway<br />
190 North<br />
Highway<br />
International<br />
and Grand<br />
International<br />
Boundary<br />
FMCSA<br />
Modular<br />
Inspection<br />
Facility<br />
FMCSA<br />
Inspection<br />
Facility<br />
FMCSA<br />
Vehicle<br />
Inspection<br />
Facility<br />
County 25th<br />
Street and<br />
Land<br />
Size<br />
(acres)<br />
Tok AK 54,972 894 0 18,420 26,072 9,586 55<br />
Skagway AK 6,565 0 0 0 0 6,565 8<br />
Lukeville AZ 35,775 0 17,157 7,118 11,500 0 6<br />
Nogales AZ 107,344 0 106,182 442 0 720 40<br />
Sasabe AZ 15,502 0 7,764 639 0 7,099 2<br />
Douglas AZ 67,317 0 66,311 1,006 0 0 3<br />
San Luis AZ 54,773 0 38,443 0 0 16,330 2<br />
Naco AZ 23,181 0 22,701 0 0 480 1<br />
San Luis AZ 10,000 0 0 0 0 10,000 9<br />
Nogales, AZ<br />
New Site Nogales AZ 99,955 0 99,955 0 0 0 8<br />
Border<br />
Station<br />
Calexico West, CA Calexico CA 138,180 0 137,549 631 0 0 5<br />
San Ysidro, CA San Ysidro CA 223,847 0 223,847 0 0 0 4<br />
Andrade, CA Adrnade CA 9,397 0 4,617 0 4,780 0 4<br />
Otay Mesa, CA Otay Mesa CA 326,899 2,384 321,462 3,053 0 0 31<br />
Tecate, CA<br />
US Border Tecate CA 53,684 0 48,848 0 4,836 0 60<br />
Station<br />
Calexico, CA CA 209,197 0 202,977 6,220 0 0 87<br />
Eastport, ID<br />
US Highway Eastport ID 12,335 570 1,200 1,310 0 9,255 2<br />
95<br />
Porthill, ID<br />
US Border Porthill ID 4,750 505 0 0 0 4,245 1<br />
Station<br />
Ferry Point, ME Ferry Point Calais ME 14,710 0 12,910 1,800 0 0 1<br />
Coburn Gore, ME<br />
State Route<br />
27<br />
Coburn<br />
Gore<br />
ME 14,291 0 5,897 0 8,394 0 4<br />
78
Table A-13: Location and Size of the 119 LPOE Sites<br />
Fort Fairfield, ME<br />
Address City State<br />
Boundaryline<br />
Road<br />
Fort<br />
Fairfield<br />
Bldg<br />
Size<br />
(ft 2 )<br />
Warehouse<br />
Area (ft 2 )<br />
Office<br />
Area<br />
(ft 2 )<br />
Laboratory<br />
Area (ft 2 )<br />
Residential<br />
Area (ft 2 )<br />
All<br />
Other<br />
Area<br />
(ft 2 )<br />
Land<br />
Size<br />
(acres)<br />
ME 6,133 0 6,133 0 0 0 1<br />
Houlton, ME Interstate 95 Houlton ME 31,844 0 29,534 2,310 0 0 6<br />
Jackman, ME<br />
Interboundary<br />
Line<br />
Jackman ME 10,881 0 9,386 1,495 0 0 4<br />
Limestone, ME Route 229 Limestone ME 4,662 0 4,662 0 0 0 1<br />
Orient, ME US Route 1 Orient ME 4,857 414 4,443 0 0 0 1<br />
Vanceboro, ME State Route 6<br />
Water Street<br />
Vanceboro ME 7,364 0 6,620 744 0 0 2<br />
VanBuren, ME Bridge Street Van Buren ME 8,117 0 7,373 744 0 0 1<br />
Milltown ME Milltown Calais ME 1,136 0 1,136 0 0 0 0<br />
St. Francis, ME<br />
St. Francis,<br />
ME Township<br />
Saint<br />
Francis<br />
ME 2,098 0 2,098 0 0 0 0<br />
Madawaska, ME Bridge Road Madawaska ME 9,250 0 9,250 0 0 0 1<br />
Fort Kent, ME U.S. Route 1 Fort Kent ME 9,829 0 9,829 0 0 0 1<br />
St. Francis, ME<br />
Detroit Cargo, MI<br />
Intl Bridge, MI<br />
Usbs, Street<br />
Pamphile<br />
2810 W Fort<br />
Street<br />
International<br />
Bridge Plaza<br />
St. Francis ME 940 0 940 0 0 0<br />
Detroit MI 78,664 0 78,664 0 0 0 22<br />
Sault Ste<br />
Marie<br />
MI 73,557 0 0 0 0 73,557<br />
Amb. Bridge, MI MI 387,677 0 0 0 0 387,677<br />
Grand Portage, MN Highway 61<br />
North<br />
Noyes, MN<br />
Roseau, MN<br />
Route 1, Box<br />
112<br />
State<br />
Highway 310<br />
Grand<br />
Portage<br />
Intl Falls, MN 2nd Avenue International<br />
Falls<br />
Baudette, MN<br />
Chief Mt, MT<br />
Piegan, MT<br />
Raymond, MT<br />
Rooseville, MT<br />
Sweetgrass, MT<br />
International<br />
Bridge,<br />
Highway 72<br />
Main Port<br />
Building<br />
Apartments<br />
House<br />
Main Port<br />
Building<br />
Main Port<br />
Building<br />
Main Port<br />
Building<br />
MN 15,852 0 13,266 1,994 0 592 4<br />
Noyes MN 17,032 0 17,032 0 0 0 2<br />
Roseau MN 25,927 0 0 0 0 25,927<br />
MN 11,954 0 11,954 0 0 0 2<br />
Baudette MN 8,758 0 8,758 0 0 0 0<br />
Babb MT 9,409 0 7,682 237 0 1,490 1<br />
Babb MT 95,638 3,779 17,894 0 69,643 4,322 63<br />
Raymond MT 35,409 0 35,409 0 0 0 9<br />
Eureka MT 28,131 9,513 12,220 0 0 6,398 25<br />
Sweetgrass MT 42,147 0 0 0 0 42,147<br />
79
Table A-13: Location and Size of the 119 LPOE Sites<br />
Turner, MT<br />
Ambrose, ND<br />
Dunseith, ND<br />
Portal, ND<br />
St. John ND<br />
Pembina, ND<br />
Columbus, NM<br />
Santa Teresa, NM<br />
Address City State<br />
Main Port<br />
Building<br />
Main Port<br />
Building<br />
Main Port<br />
Building<br />
Main Port<br />
Building<br />
Main Port<br />
Building<br />
Import<br />
Broker's<br />
Pads<br />
Palomas &<br />
2nd Street<br />
104 Santa<br />
Teresa<br />
Bldg<br />
Size<br />
(ft 2 )<br />
Warehouse<br />
Area (ft 2 )<br />
Office<br />
Area<br />
(ft 2 )<br />
Laboratory<br />
Area (ft 2 )<br />
Residential<br />
Area (ft 2 )<br />
All<br />
Other<br />
Area<br />
(ft 2 )<br />
Land<br />
Size<br />
(acres)<br />
Turner MT 7,695 243 6,564 0 0 888 0<br />
Ambrose ND 6,705 0 6,705 0 0 0 7<br />
Dunseith ND 11,606 0 11,606 0 0 0 8<br />
Portal ND 14,710 0 13,680 0 0 1,030 1<br />
St John ND 5,801 0 5,801 0 0 0 5<br />
Pembina ND 45,302 0 19,841 0 0 25,461 40<br />
Columbus NM 21,370 0 963 0 0 20,407 10<br />
Santa<br />
Teresa<br />
Alexandria Bay, NY Int-81 Alexandria<br />
Bay<br />
Champlain, NY<br />
Massena, NY<br />
Fort Covington, NY<br />
Rouses Pt. NY<br />
198 West<br />
Service Road<br />
Cornwall<br />
Bridge<br />
NYS Route<br />
37<br />
Nys Route<br />
276<br />
NM 57,418 1,252 11,510 0 0 44,656 6<br />
NY 54,800 0 51,722 0 0 3,078 5<br />
Champlain NY 140,167 0 93,247 6,782 0 40,138 35<br />
Massena NY 10,000 0 0 0 0 10,000 18<br />
Fort<br />
Covington<br />
Rouses<br />
Point<br />
St John Hwy, NY Nys Route 9b Rouses<br />
Point<br />
NY 5,978 0 5,978 0 0 0 5<br />
NY 10,571 0 10,571 0 0 0 1<br />
NY 18,948 0 18,948 0 0 0 95<br />
Trout, River, NY Nys Route 30 Trout River NY 11,427 0 11,427 0 0 0 2<br />
Chateaugay, NY<br />
Nys Route<br />
374<br />
Chateaugay NY 6,340 0 6,340 0 0 0 1<br />
Mooers, NY Nys Route 22 Mooers NY 5,504 0 5,504 0 0 0 4<br />
Jamieson, NY NY 1,044 0 0 0 0 1,044<br />
Niagra Falls, NY NY 220,074 0 0 0 0 220,074<br />
Ogdensburg NY NY 97,278 0 0 0 0 97,278<br />
Brownsville/Matamoros<br />
TX<br />
1300 Mexico<br />
Blvd.<br />
Brownsville TX 44,348 0 415 0 0 43,933 10<br />
Gateway, TX TX 79,138 1,313 23,359 0 0 54,466<br />
Columbia, TX TX 163,863 2,350 2,069 0 0 159,444 70<br />
Convent, TX<br />
100 Zaragoza<br />
Street<br />
Laredo TX 59,599 0 59,599 0 0 0 5<br />
Del Rio, TX Rio Grande Del Rio TX 91,914 1,102 27,170 0 0 63,642 60<br />
80
Table A-13: Location and Size of the 119 LPOE Sites<br />
Donna TX (not built<br />
yet)<br />
Bridge of the Americas,<br />
TX<br />
Eagle Pass, TX<br />
Fabens, TX<br />
Fort Hancock, TX<br />
El Paso, TX (out<br />
leased)<br />
Juarez-Lincoln, TX<br />
Los Indios, TX<br />
Address City State<br />
Road<br />
Us Hwy 281<br />
And Fm 493<br />
3600 Paisano<br />
Drive<br />
160 Garrison<br />
Street<br />
Term of<br />
Fm1109 Po<br />
728<br />
Termination<br />
of Fm1088<br />
1009 Stanton<br />
Street<br />
Termination<br />
I-35<br />
100 Los<br />
Indios Blvd.<br />
Bldg<br />
Size<br />
(ft 2 )<br />
Warehouse<br />
Area (ft 2 )<br />
Office<br />
Area<br />
(ft 2 )<br />
Laboratory<br />
Area (ft 2 )<br />
Residential<br />
Area (ft 2 )<br />
All<br />
Other<br />
Area<br />
(ft 2 )<br />
Donna TX 10,000 0 0 0 0 10,000<br />
Land<br />
Size<br />
(acres)<br />
El Paso TX 155,333 0 61,870 0 0 93,463 27<br />
Eagle Pass TX 84,140 0 15,850 0 0 68,290 13<br />
Fabens TX 10,891 0 3,665 0 0 7,226 8<br />
Ft Hancock TX 5,197 0 2,329 0 0 2,868 5<br />
El Paso TX 10,000 0 0 0 0 10,000<br />
Laredo TX 214,917 0 49,697 0 0 165,220 20<br />
Los Indios TX 106,145 935 21,377 0 0 83,833 50<br />
Laredo TX Del Mar Blvd. Laredo TX 27,989 0 9,730 18,259 0 0 10<br />
Los Tomates, TX 3300 S.<br />
Expressway<br />
77/83<br />
Brownsville TX 123,720 7,054 22,743 0 0 93,923 75<br />
McAllen, TX 2301 S. Main McAllen TX 30,260 0 8,756 21,504 0 0 10<br />
McAllen TX, not built<br />
Marfa, TX<br />
Kika de la Garza, TX<br />
Paso Del Norte, TX<br />
Progreso, TX<br />
Roma, TX<br />
Rio Grande City, TX<br />
Ysleta, TX<br />
RR Inspection, TX<br />
New US Port<br />
of Entry<br />
300 Madrid<br />
Street<br />
9901 S Cage<br />
Street<br />
1000 S El<br />
Paso Street<br />
American<br />
End Intl Bridg<br />
405 N<br />
Estrella, Suite<br />
B<br />
313 Pete<br />
Diaz Jr.<br />
797 S<br />
Zaragoza<br />
Road<br />
2119 W<br />
Zaragosa<br />
Street<br />
McAllen TX 10,000 0 0 0 0 10,000<br />
Marfa TX 26,740 0 8,969 13,991 0 3,780 8<br />
Pharr TX 132,076 1,347 20,217 0 0 110,512 55<br />
El Paso TX 88,179 0 50,063 0 0 38,116 11<br />
Progreso TX 31,291 0 31,291 0 0 0<br />
Roma TX 41,259 0 41,259 0 0 0<br />
Rio Grande<br />
City<br />
TX 49,654 0 49,654 0 0 0 8<br />
El Paso TX 165,955 11,226 39,185 0 0 115,544 91<br />
Laredo TX 2,016 0 2,016 0 0 0 1<br />
81
Table A-13: Location and Size of the 119 LPOE Sites<br />
Admin, TX, leased<br />
Address City State<br />
Term of Intl<br />
Toll Bridge<br />
Bldg<br />
Size<br />
(ft 2 )<br />
Warehouse<br />
Area (ft 2 )<br />
Office<br />
Area<br />
(ft 2 )<br />
Laboratory<br />
Area (ft 2 )<br />
Residential<br />
Area (ft 2 )<br />
All<br />
Other<br />
Area<br />
(ft 2 )<br />
Hidalgo TX 74,401 0 74,401 0 0 0<br />
El Paso, TX, leased 1090 Mesa El Paso TX 8,698 0 8,698 0 0 0<br />
DOT, TX, leased<br />
Derby Line, VT<br />
Norton, VT<br />
500 Adams<br />
Street<br />
Interstate<br />
Route 91<br />
State Route<br />
114<br />
Eagle Pass TX 73,000 0 73,000 0 0 0<br />
Land<br />
Size<br />
(acres)<br />
Derby Line VT 11,778 0 11,778 0 0 0 7<br />
Norton VT 8,031 0 8,031 0 0 0 1<br />
Beebe Plain, VT Main Street Beebe Plain VT 3,522 0 3,522 0 0 0 0<br />
Alburg Springs, VT US Highway Alburg<br />
Springs<br />
VT 3,679 440 3,239 0 0 0 1<br />
North Troy VT VT 6,136 0 6,136 0 0 0 1<br />
West Berkshire,VT<br />
State Route<br />
118<br />
West<br />
Berkshire<br />
VT 7,679 0 7,679 0 0 0 2<br />
Derby Line, VT US Route 5 Derby Line VT 21,135 926 17,737 2,472 0 0 3<br />
Beecher Falls, VT<br />
Canaan, VT<br />
East Richford, VT<br />
Richford, VT<br />
Alburg, VT, joint<br />
ownership<br />
State Route<br />
102<br />
State Route<br />
102<br />
357 Glen<br />
Sutton Road<br />
705 Province<br />
Street<br />
US Border<br />
Station<br />
Highgate Springs 1, VT 517 Welcome<br />
Center Road<br />
Highgate Springs 2, VT 482 Welcome<br />
Center Road<br />
Highgate Springs 3, VT 525 Welcome<br />
Center Road<br />
Blaine, WA<br />
Danville, WA<br />
Laurier, WA<br />
Peace Arch<br />
Border<br />
Station<br />
Rural Route<br />
21<br />
US Border<br />
Station<br />
Beecher<br />
Falls<br />
VT 9,730 0 9,730 0 0 0 1<br />
Canaan VT 5,005 0 5,005 0 0 0 1<br />
Richford VT 8,751 0 8,751 0 0 0 1<br />
Richford VT 8,148 0 8,148 0 0 0 1<br />
Alburg VT 3,671 0 0 0 0 3,671 1<br />
Highgate<br />
Springs<br />
Highgate<br />
Springs<br />
VT 2,306 0 2,306 0 0 0 0<br />
VT 33,776 0 33,776 0 0 0 16<br />
Highgate VT 4,568 0 4,568 0 0 0 1<br />
Springs<br />
Blaine WA 33,941 0 0 0 0 33,941 3<br />
Danville WA 8,205 750 0 0 0 7,455 1<br />
Laurier WA 9,718 0 0 0 4,780 4,938 2<br />
Mataline Falls. WA WA 5,830 0 0 0 1,280 4,550 6<br />
Oroville, WA<br />
33643 Hwy Oroville WA 63,665 0 0 3,999 0 59,666 8<br />
97 N<br />
Point Robert, WA WA 32,555 0 0 0 0 32,555 3<br />
82
Table A-13: Location and Size of the 119 LPOE Sites<br />
Sumas, WA<br />
Blaine, WA<br />
Blaine, WA<br />
Kenneth Ward, WA<br />
Address City State<br />
Cherry and<br />
Boundary<br />
Peace Arch<br />
Border<br />
Station<br />
Pacific<br />
Highway<br />
Border Street<br />
Lynden<br />
Border<br />
Station<br />
Bldg<br />
Size<br />
(ft 2 )<br />
Warehouse<br />
Area (ft 2 )<br />
Office<br />
Area<br />
(ft 2 )<br />
Laboratory<br />
Area (ft 2 )<br />
Residential<br />
Area (ft 2 )<br />
All<br />
Other<br />
Area<br />
(ft 2 )<br />
Land<br />
Size<br />
(acres)<br />
Sumas WA 23,251 2,065 15,922 0 0 5,264 4<br />
WA 33,941 0 0 0 0 33,941 7<br />
Blaine WA 96,444 0 0 0 0 96,444 12<br />
Lynden WA 17,362 0 0 0 0 17,362 5<br />
83
Table A-14: Base Case Electricity Consumption and Cost<br />
Table A-14: Base Case Electricity Consumption and Cost<br />
LPOE Site Name<br />
Annual Electric<br />
Consumption (kWh)<br />
Annual Electric Cost<br />
($)<br />
Champlain, NY 5,196,517 $575,518<br />
San Ysidro, CA 4,455,623 $571,987<br />
Otay Mesa, CA 3,396,801 $464,896<br />
Calexico, CA 3,788,400 $459,637<br />
Calexico West, CA 3,429,170 $415,762<br />
Juarez-Lincoln, TX 3,930,912 $357,506<br />
Nogales, AZ 2,888,787 $259,075<br />
Kika de la Garza, TX 2,426,988 $255,192<br />
Bridge of the Americas,<br />
TX<br />
2,561,849 $253,723<br />
Niagra Falls, NY 1,948,130 $243,753<br />
Los Tomates, TX 2,469,400 $230,768<br />
Blaine, WA 2,877,160 $223,828<br />
Columbia, TX 2,132,128 $215,937<br />
Ysleta, TX 2,114,686 $212,465<br />
Nogales, AZ 1,862,437 $202,955<br />
Admin, TX (leased) 2,137,357 $200,931<br />
Los Indios, TX 2,049,130 $181,178<br />
Gateway, TX 1,830,160 $180,637<br />
Alexandria Bay, NY 1,152,072 $172,539<br />
Detroit Cargo, MI 1,916,640 $165,242<br />
San Luis, AZ 1,785,280 $159,603<br />
Del Rio, TX 1,607,224 $156,124<br />
Tecate, CA 1,151,457 $154,040<br />
Paso Del Norte, TX 1,423,360 $153,678<br />
Santa Teresa, NM 1,431,100 $153,091<br />
Convent, TX 1,495,840 $133,657<br />
Ogdensburg NY 861,120 $128,638<br />
DOT, TX (leased) 1,267,873 $122,248<br />
Pembina, ND 1,638,840 $112,108<br />
Douglas, AZ 1,153,684 $111,917<br />
Rio Grande City, TX 936,746 $94,218<br />
Highgate Springs 2, VT 986,304 $94,129<br />
Roma, TX 1,045,534 $93,707<br />
Eagle Pass, TX 990,240 $89,082<br />
Alcan, AK 609,740 $84,767<br />
Brownsville/Matamoros<br />
TX<br />
893,247 $84,724<br />
84
Table A-14: Base Case Electricity Consumption and Cost<br />
LPOE Site Name<br />
Annual Electric<br />
Consumption (kWh)<br />
Annual Electric Cost<br />
($)<br />
McAllen, TX 797,990 $77,871<br />
Lukeville, AZ 738,760 $75,140<br />
Sweetgrass, MT 729,244 $73,605<br />
Oroville, WA 1,394,664 $73,310<br />
Amb. Bridge, MI 654,160 $69,616<br />
Blaine, WA 912,240 $67,712<br />
Columbus, NM 540,691 $63,556<br />
Laredo TX 681,250 $63,345<br />
Dalton Cache, AK 165,440 $62,672<br />
Houlton, ME 568,192 $58,709<br />
Intl Bridge, MI 1,872,966 $58,425<br />
Progreso, TX 616,320 $53,784<br />
Fabens, TX 293,220 $50,598<br />
Andrade, CA 340,940 $45,404<br />
Blaine, WA 728,673 $45,285<br />
Chief Mt, MT 740,893 $45,252<br />
Point Robert, WA 698,917 $43,436<br />
Ferry Point, ME 309,360 $42,895<br />
Piegan, MT 546,320 $42,286<br />
Sumas, WA 610,920 $41,519<br />
El Paso, TX (Leased) 411,700 $41,272<br />
Raymond, MT 824,080 $41,166<br />
Naco, AZ 388,880 $38,150<br />
Eastport, ID 555,761 $35,007<br />
Skagway, AK 169,640 $34,092<br />
Roseau, MN 479,760 $32,618<br />
Rooseville, MT 571,200 $31,546<br />
Derby Line, VT 269,760 $31,284<br />
Fort Hancock, TX 259,760 $29,846<br />
Sasabe, AZ 227,120 $29,673<br />
Marfa, TX 320,920 $29,257<br />
Massena, NY 443,440 $26,804<br />
Kenneth Ward, WA 324,160 $26,165<br />
Grand Portage, MN 265,600 $26,130<br />
Madawaska, ME 144,158 $23,025<br />
Fort Kent, ME 143,810 $22,591<br />
Portal, ND 308,435 $20,460<br />
Norton, VT 126,700 $18,329<br />
85
Table A-14: Base Case Electricity Consumption and Cost<br />
LPOE Site Name<br />
Annual Electric<br />
Consumption (kWh)<br />
Annual Electric Cost<br />
($)<br />
Derby Line, VT 133,120 $17,842<br />
Trout, River, NY 129,392 $17,797<br />
San Luis AZ (not built yet) 173,025 $17,464<br />
Donna TX (not built yet) 173,025 $17,464<br />
El Paso, TX (out leased) 173,025 $17,464<br />
McAllen TX (not built yet) 173,025 $17,464<br />
Beecher Falls, VT 118,794 $17,348<br />
Jackman, ME 206,520 $16,512<br />
Vanceboro, ME 105,591 $15,998<br />
Rouses Pt. NY 130,276 $15,865<br />
Coburn Gore, ME 123,802 $15,739<br />
Noyes, MN 190,041 $15,246<br />
Fort Covington, NY 101,040 $14,343<br />
Richford, VT 97,268 $14,312<br />
Intl Falls, MN 171,760 $13,193<br />
Fort Fairfield, ME 67,164 $12,888<br />
VanBuren, ME 111,215 $12,718<br />
Canaan, VT 82,488 $11,820<br />
East Richford, VT 80,263 $11,591<br />
Chateaugay, NY 104,797 $11,382<br />
Dunseith, ND 163,357 $10,854<br />
Danville, WA 141,720 $10,513<br />
Mooers, NY 86,960 $10,273<br />
West Berkshire,VT 73,002 $9,883<br />
Porthill, ID 142,712 $9,854<br />
Baudette, MN 77,572 $9,583<br />
Milltown ME 67,260 $9,576<br />
St John Hwy, NY 191,440 $8,715<br />
Limestone, ME 46,288 $8,546<br />
Laurier, WA 71,210 $7,494<br />
Highgate Springs 3, VT 48,400 $6,722<br />
St. John ND 76,221 $6,029<br />
Alburg, VT (Joint<br />
ownership)<br />
41,549.40 $5,663<br />
Beebe Plain, VT 36,354 $5,546<br />
Alburg Springs, VT 37,186 $5,463<br />
Ambrose, ND 58,875 $4,723<br />
Orient, ME 26,953 $4,528<br />
Turner, MT 15,400 $3,879<br />
86
Table A-14: Base Case Electricity Consumption and Cost<br />
LPOE Site Name<br />
Annual Electric<br />
Consumption (kWh)<br />
Annual Electric Cost<br />
($)<br />
St. Francis, ME 42,040 $3,838<br />
St. Francis, ME 36,715 $3,279<br />
Mataline Falls. WA 85,600 $2,893<br />
Jamieson, NY 9,241 $1,549<br />
North Troy VT 4,388 $957<br />
RR Inspection, TX 8,143 $938<br />
Highgate Springs 1, VT 2,887 $403<br />
87
Table A-15: Base Case Oil Consumption and Cost<br />
Table A-15: Base Case Oil Consumption and Cost<br />
#2 Oil Annual #2 Oil Annual Cost<br />
LPOE Site Name<br />
Consumption (therms)<br />
($/year)<br />
Alcan, AK 115,330 $289,188<br />
Highgate Springs 2,<br />
VT<br />
58,789 $118,441<br />
Pembina, ND 71,317 $110,407<br />
Champlain, NY 41,277 $102,259<br />
Raymond, MT 50,542 $97,873<br />
Piegan, MT 34,569 $64,107<br />
Dalton Cache, AK 14,399 $37,042<br />
Houlton, ME 15,767 $32,300<br />
Skagway, AK 10,717 $29,184<br />
Coburn Gore, ME 11,088 $27,354<br />
Derby Line, VT 13,208 $27,118<br />
Grand Portage, MN 14,591 $22,260<br />
Fort Kent, ME 11,180 $20,835<br />
Derby Line, VT 8,418 $18,074<br />
St John Hwy, NY 7,064 $17,819<br />
Vanceboro, ME 6,252 $13,640<br />
Rouses Pt. NY 5,557 $13,536<br />
Noyes, MN 7,475 $13,510<br />
Massena, NY 5,326 $13,269<br />
Madawaska, ME 5,574 $12,116<br />
Ferry Point, ME 5,185 $11,295<br />
Alexandria Bay, NY 7,720 $11,017<br />
Norton, VT 5,432 $10,819<br />
VanBuren, ME 5,129 $10,775<br />
Fort Hancock, TX 3,774 $9,735<br />
Fort Fairfield, ME 4,146 $9,210<br />
Chateaugay, NY 3,449 $9,023<br />
Trout, River, NY 3,404 $8,227<br />
Beecher Falls, VT 3,119 $7,125<br />
Limestone, ME 2,884 $7,102<br />
Richford, VT 3,239 $7,102<br />
North Troy VT 3,379 $6,990<br />
Fort Covington, NY 2,370 $6,073<br />
Highgate Springs 3,<br />
VT<br />
2,830 $5,679<br />
Ambrose, ND 3,273 $5,628<br />
Mooers, NY 1,999 $5,128<br />
Jackman, ME 2,720 $5,108<br />
88
Table A-15: Base Case Oil Consumption and Cost<br />
LPOE Site Name<br />
#2 Oil Annual<br />
Consumption (therms)<br />
#2 Oil Annual Cost<br />
($/year)<br />
Canaan, VT 2,274 $5,079<br />
East Richford, VT 2,463 $5,067<br />
St. John ND 2,677 $4,344<br />
West Berkshire,VT 1,877 $4,171<br />
Dunseith, ND 3,083 $4,079<br />
Alburg Springs, VT 1,733 $3,979<br />
Beebe Plain, VT 1,836 $3,487<br />
Jamieson, NY 624 $1,547<br />
Orient, ME 670 $1,537<br />
Milltown ME 651 $1,348<br />
89
Table A-16: Base Case Natural Gas Consumption and Cost<br />
Table A-16: Base Case Natural Gas Consumption and Cost<br />
LPOE Site Name<br />
Annual Natural Gas<br />
Consumption (therms)<br />
Annual Natural Gas<br />
Cost ($)<br />
Champlain, NY 137,957 $163,698<br />
San Ysidro, CA 145,016 $152,424<br />
Bridge of the Americas, TX 110,012 $97,904<br />
Detroit Cargo, MI 83,084 $84,977<br />
Otay Mesa, CA 60,035 $71,399<br />
Del Rio, TX 26,297 $48,259<br />
Intl Bridge, MI 46,127 $46,947<br />
Ysleta, TX 52,230 $46,891<br />
Ogdensburg NY 25,392 $35,303<br />
Chief Mt, MT 33,570 $29,852<br />
Eagle Pass, TX 21,161 $28,561<br />
Juarez-Lincoln, TX 21,080 $24,763<br />
Nogales, AZ 19,476 $23,835<br />
Roseau, MN 17,603 $21,192<br />
Nogales, AZ 16,846 $20,639<br />
Calexico West, CA 18,667 $18,861<br />
Sumas, WA 15,779 $16,633<br />
Paso Del Norte, TX 17,385 $15,795<br />
Douglas, AZ 8,989 $15,779<br />
Marfa, TX 10,028 $14,357<br />
Kika de la Garza, TX 9,165 $10,526<br />
Admin, TX (leased) 8,038 $9,553<br />
Blaine, WA 7,749 $8,639<br />
Santa Teresa, NM 7,386 $7,790<br />
Kenneth Ward, WA 7,237 $7,646<br />
Los Indios, TX 6,737 $7,463<br />
Convent, TX 6,274 $6,867<br />
Intl Falls, MN 5,578 $6,710<br />
Portal, ND 6,722 $6,587<br />
Naco, AZ 2,997 $5,669<br />
Roma, TX 1,716 $4,715<br />
Oroville, WA 592 $4,668<br />
Amb. Bridge, MI 3,828 $3,970<br />
Brownsville/Matamoros TX 3,289 $3,823<br />
Gateway, TX 2,936 $3,553<br />
Danville, WA 2,263 $3,336<br />
Los Tomates, TX 2,480 $3,033<br />
El Paso, TX (Leased) 2,305 $2,382<br />
90
Table A-16: Base Case Natural Gas Consumption and Cost<br />
LPOE Site Name<br />
Annual Natural Gas<br />
Consumption (therms)<br />
Annual Natural Gas<br />
Cost ($)<br />
Rio Grande City, TX 1,497 $2,283<br />
McAllen, TX 869 $1,806<br />
San Luis AZ (not built yet) 1,748 $1,748<br />
Donna TX (not built yet) 1,748 $1,748<br />
El Paso, TX (out leased) 1,748 $1,748<br />
McAllen TX (not built yet) 1,748 $1,748<br />
Laredo TX 1,449 $1,738<br />
91
Geographical Information System (GIS) Data on Renewable Energy Resources<br />
NREL evaluated renewable energy technologies using GIS database of<br />
renewable energy resource information (www.nrel.gov/GIS) [ref. 1], to represent<br />
the magnitude of a renewable energy resource in the area.<br />
NREL Datasets used in the analysis include:<br />
• Solar radiation 40x40 km grid<br />
• Horizontal, south-facing vertical, tilt=latitude<br />
• Wind energy 200mx1000m grid<br />
• Biomass resources<br />
• Illuminance for daylighting<br />
• Temperature and heating degree days<br />
• State and utility incentives and utility policy [ref. 6]<br />
• Temperature and heating degree day [ref. 1]<br />
• City cost adjustments [ref. 7]<br />
• Installed hardware costs [ref. 9]<br />
• Economic parameters (discount rate, inflation rate) [ref. 2]<br />
Information on the renewable energy resources available at each site is listed in<br />
Table A-17.<br />
92
Table A-17: RE Resource Information from NREL's GIS System<br />
Table A-17: RE Resource Information from NREL’s GIS System<br />
LPOE Site Name<br />
Heating<br />
Degree<br />
Days<br />
(65F)<br />
Cooling<br />
Degree<br />
Days<br />
(65F)<br />
Annual<br />
Average<br />
Solar tilt=lat<br />
(kWh/m 2 /day)<br />
Wind<br />
Power<br />
Density<br />
50 m<br />
(W/m 2 )<br />
Annual<br />
Solar Vent<br />
Preheat<br />
Delivery<br />
(kWh/m 2 /yr)<br />
Annual<br />
Direct Solar<br />
on E/W 1-<br />
axis tracker<br />
(kWh/m 2 /day)<br />
Biomass<br />
total<br />
residues<br />
within 50<br />
miles<br />
(tons/yr)<br />
Dalton Cache, AK 8,953 0 3.5 155 575 0.0 662<br />
Alcan, AK 12,890 34 3.9 64 728 0.0 238<br />
Skagway, AK 8,953 0 3.5 55 670 0.0 662<br />
Lukeville, AZ 938 4,522 6.6 95 273 5.5 65,343<br />
Nogales, AZ 1,456 3,247 6.5 144 370 5.4 31,369<br />
Sasabe, AZ 938 4,522 6.5 132 332 5.5 47,302<br />
Douglas, AZ 2,380 2,462 6.5 152 411 5.3 28,912<br />
San Luis, AZ 938 4,522 6.5 102 165 5.3 58,144<br />
Naco, AZ 1,456 3,247 6.5 144 370 5.4 31,369<br />
San Luis AZ (not built<br />
yet)<br />
938 4,522 6.5 102 165 5.3 58,144<br />
Nogales, AZ 1,456 3,247 6.5 101 357 5.4 44,637<br />
Calexico West, CA 938 4,522 6.5 117 186 5.3 122,194<br />
San Ysidro, CA 1,186 657 5.9 132 145 4.3 0<br />
Andrade, CA 938 4,522 6.5 374 171 5.4 136,890<br />
Otay Mesa, CA 1,186 657 5.9 117 145 4.3 274,453<br />
Tecate, CA 1,186 657 5.9 117 145 4.3 274,453<br />
Calexico, CA 938 4,522 6.5 136 177 5.4 86,732<br />
Eastport, ID 8,068 142 4.4 31 640 3.2 161,925<br />
Porthill, ID 8,068 142 4.3 87 640 3.0 156,636<br />
Ferry Point, ME 9,436 180 4.1 140 588 2.7 363,624<br />
Coburn Gore, ME 7,141 362 4.3 137 597 2.8 949,353<br />
Fort Fairfield, ME 9,436 180 3.9 244 585 2.5 181,984<br />
Houlton, ME 9,436 180 4.2 227 585 2.9 376,179<br />
Jackman, ME 7,141 362 4.1 177 597 2.6 627,773<br />
Limestone, ME 9,436 180 3.8 285 587 2.4 152,040<br />
Orient, ME 9,436 180 4.2 164 585 2.9 472,623<br />
Vanceboro, ME 9,436 180 4.1 174 586 2.7 374,333<br />
VanBuren, ME 9,436 180 4.0 100 587 2.7 128,720<br />
Milltown ME 9,436 180 4.1 140 588 2.7 363,624<br />
St. Francis, ME 9,436 180 4.2 271 649 2.9 236,116<br />
Madawaska, ME 9,436 180 3.9 100 608 2.6 133,883<br />
Fort Kent, ME 9,436 180 4.0 100 608 2.7 173,304<br />
St. Francis, ME 9,436 180 4.0 100 608 2.7 173,304<br />
Detroit Cargo, MI 6,160 792 4.1 192 414 2.4 1,224,450<br />
93
Table A-17: RE Resource Information from NREL’s GIS System<br />
LPOE Site Name<br />
Heating<br />
Degree<br />
Days<br />
(65F)<br />
Cooling<br />
Degree<br />
Days<br />
(65F)<br />
Annual<br />
Average<br />
Solar tilt=lat<br />
(kWh/m 2 /day)<br />
Wind<br />
Power<br />
Density<br />
50 m<br />
(W/m 2 )<br />
Annual<br />
Solar Vent<br />
Preheat<br />
Delivery<br />
(kWh/m 2 /yr)<br />
Annual<br />
Direct Solar<br />
on E/W 1-<br />
axis tracker<br />
(kWh/m 2 /day)<br />
Biomass<br />
total<br />
residues<br />
within 50<br />
miles<br />
(tons/yr)<br />
Intl Bridge, MI 8,842 173 4.0 0 508 2.6 0<br />
Amb. Bridge, MI 8,842 173 4.0 0 508 2.6 0<br />
Grand Portage, MN 10,019 209 4.4 350 718 3.1 52,397<br />
Noyes, MN 10,019 209 4.2 450 722 2.8 1,739,660<br />
Roseau, MN 10,019 209 4.3 350 671 3.0 1,924,740<br />
Intl Falls, MN 10,019 209 3.9 250 593 2.5 405,385<br />
Baudette, MN 7,580 700 4.4 250 526 3.0 2,370,600<br />
Chief Mt, MT 8,631 140 4.6 378 729 3.4 755,575<br />
Piegan, MT 8,631 140 4.6 312 729 3.3 1,036,350<br />
Raymond, MT 8,494 481 4.5 355 738 3.3 210,761<br />
Rooseville, MT 8,494 481 4.5 355 738 3.3 210,761<br />
Sweetgrass, MT 8,631 140 4.7 440 729 3.5 146,770<br />
Turner, MT 8,494 481 4.7 412 725 3.5 44,267<br />
Ambrose, ND 8,494 481 4.4 467 766 3.1 397,155<br />
Dunseith, ND 8,816 418 4.5 283 726 3.2 1,926,450<br />
Portal, ND 8,816 418 4.4 425 755 3.1 672,393<br />
St. John ND 8,816 418 4.5 532 726 3.2 1,613,610<br />
Pembina, ND 10,019 209 4.1 315 722 2.8 1,637,400<br />
Columbus, NM 2,380 2,462 6.5 215 521 5.4 18,740<br />
Santa Teresa, NM 2,380 2,462 6.6 191 511 5.3 151,484<br />
Alexandria Bay, NY 8,044 427 4.1 250 499 2.7 362,200<br />
Champlain, NY 8,044 427 4.1 250 499 2.7 362,200<br />
Massena, NY 8,044 427 4.2 250 458 2.8 109,570<br />
Fort Covington, NY 8,044 427 4.1 250 458 2.7 122,505<br />
Rouses Pt. NY 7,452 500 4.0 100 460 2.5 186,883<br />
St John Hwy, NY 7,452 500 4.0 100 460 2.5 186,883<br />
Trout, River, NY 8,044 427 4.1 250 474 2.7 130,174<br />
Chateaugay, NY 8,044 427 4.0 0 488 2.6 0<br />
Mooers, NY 7,452 500 4.1 100 460 2.7 169,616<br />
Jamieson, NY 6,021 742 4.3 250 403 2.7 711,206<br />
Niagra Falls, NY 6,602 547 4.0 250 391 2.4 397,286<br />
Ogdensburg, NY 8,044 427 4.0 0 488 2.6 0<br />
Brownsville/<br />
Matamoros, TX<br />
526 4,000 5.1 350 29 3.2 384,739<br />
Gateway, TX 526 4,000 5.1 350 29 3.2 0<br />
Columbia, TX 848 3,505 5.3 250 95 3.8 30,754<br />
94
Table A-17: RE Resource Information from NREL’s GIS System<br />
LPOE Site Name<br />
Heating<br />
Degree<br />
Days<br />
(65F)<br />
Cooling<br />
Degree<br />
Days<br />
(65F)<br />
Annual<br />
Average<br />
Solar tilt=lat<br />
(kWh/m 2 /day)<br />
Wind<br />
Power<br />
Density<br />
50 m<br />
(W/m 2 )<br />
Annual<br />
Solar Vent<br />
Preheat<br />
Delivery<br />
(kWh/m 2 /yr)<br />
Annual<br />
Direct Solar<br />
on E/W 1-<br />
axis tracker<br />
(kWh/m 2 /day)<br />
Biomass<br />
total<br />
residues<br />
within 50<br />
miles<br />
(tons/yr)<br />
Convent, TX 848 3,505 5.3 250 95 3.8 30,754<br />
Del Rio, TX 1,445 3,094 5.3 250 238 3.7 5,637<br />
Donna TX (not built yet) 526 4,000 5.2 250 34 3.5 578,647<br />
Bridge of the Americas,<br />
TX<br />
2,380 2,462 6.5 250 511 5.2 149,230<br />
Eagle Pass, TX 1,445 3,094 5.3 250 213 3.7 18,308<br />
Fabens, TX 2,380 2,462 6.4 100 512 5.0 128,410<br />
Fort Hancock, TX 2,380 2,462 6.5 100 515 5.3 113,744<br />
El Paso, TX (out leased) 2,380 2,462 6.5 250 511 5.2 147,146<br />
Juarez-Lincoln, TX 848 3,505 5.3 250 95 3.8 30,754<br />
Los Indios, TX 526 4,000 5.1 250 34 3.3 529,847<br />
Laredo TX 848 3,505 5.3 250 95 3.8 30,754<br />
Los Tomates, TX 526 4,000 5.0 350 29 3.2 351,878<br />
McAllen, TX 526 4,000 5.2 250 48 3.5 497,254<br />
McAllen TX (not built<br />
yet)<br />
526 4,000 5.2 250 48 3.5 497,377<br />
Marfa, TX 2,380 2,462 6.4 550 457 5.2 1,515<br />
Kika de la Garza, TX 526 4,000 5.2 250 48 3.5 518,581<br />
Paso Del Norte, TX 2,380 2,462 6.5 250 511 5.2 146,924<br />
Progreso, TX 526 4,000 5.2 250 34 3.4 583,127<br />
Roma, TX 526 4,000 5.4 250 73 3.8 128,105<br />
Rio Grande City, TX 526 4,000 5.3 250 73 3.7 275,298<br />
Ysleta, TX 2,380 2,462 6.5 100 512 5.2 0<br />
RR Inspection, TX 848 3,505 5.3 250 95 3.8 30,350<br />
Admin, TX (leased) 526 4,000 5.2 250 48 3.5 480,638<br />
El Paso, TX (Leased) 2,380 2,462 6.5 250 511 5.2 147,869<br />
DOT, TX (leased) 1,445 3,094 5.3 250 213 3.8 18,030<br />
Derby Line, VT 7,452 500 3.9 135 582 2.5 708,143<br />
Norton, VT 7,452 500 3.9 235 582 2.4 896,715<br />
Beebe Plain, VT 7,452 500 3.8 122 582 2.3 650,122<br />
Alburg Springs, VT 7,452 500 4.0 225 460 2.5 210,955<br />
North Troy VT 7,452 500 3.9 154 527 2.5 438,665<br />
West Berkshire,VT 7,452 500 4.0 198 454 2.6 270,150<br />
Derby Line, VT 7,452 500 3.9 135 582 2.5 695,009<br />
Beecher Falls, VT 7,452 500 4.0 59 571 2.4 957,337<br />
Canaan, VT 7,452 500 4.0 86 571 2.5 969,680<br />
95
Table A-17: RE Resource Information from NREL’s GIS System<br />
LPOE Site Name<br />
Heating<br />
Degree<br />
Days<br />
(65F)<br />
Cooling<br />
Degree<br />
Days<br />
(65F)<br />
Annual<br />
Average<br />
Solar tilt=lat<br />
(kWh/m 2 /day)<br />
Wind<br />
Power<br />
Density<br />
50 m<br />
(W/m 2 )<br />
Annual<br />
Solar Vent<br />
Preheat<br />
Delivery<br />
(kWh/m 2 /yr)<br />
Annual<br />
Direct Solar<br />
on E/W 1-<br />
axis tracker<br />
(kWh/m 2 /day)<br />
Biomass<br />
total<br />
residues<br />
within 50<br />
miles<br />
(tons/yr)<br />
East Richford, VT 7,452 500 3.9 184 527 2.5 347,254<br />
Richford, VT 7,452 500 3.9 184 527 2.5 347,254<br />
Alburg, VT (Joint<br />
ownership)<br />
7,452 500 4.0 225 460 2.5 210,955<br />
Highgate Springs 1, VT 7,452 500 4.0 182 460 2.5 232,311<br />
Highgate Springs 2, VT 7,452 500 4.0 182 460 2.5 232,311<br />
Highgate Springs 3, VT 7,452 500 4.0 182 460 2.5 232,311<br />
Blaine, WA 5,659 18 3.9 156 460 2.5 104,384<br />
Danville, WA 6,664 416 4.4 33 552 3.1 300,499<br />
Laurier, WA 6,664 416 4.3 30 552 3.0 332,676<br />
Mataline Falls. WA 6,664 416 4.3 30 552 3.0 332,676<br />
Oroville, WA 6,664 416 4.6 37 516 3.2 97,106<br />
Point Robert, WA 6,664 416 4.6 37 516 3.2 97,106<br />
Sumas, WA 5,659 18 3.9 156 460 2.5 104,384<br />
Blaine, WA 5,659 18 3.9 156 460 2.5 104,384<br />
Blaine, WA 5,659 18 3.9 156 460 2.5 104,384<br />
Kenneth Ward, WA 5,659 18 3.9 156 460 2.5 104,384<br />
96
Cost Adjustment Factors<br />
The initial cost of each technology is estimated from the technology<br />
characterizations adjusted for the city cost adjustment factors for each location<br />
from RS Means and Co. The city cost adjustments are for composite project cost<br />
including both materials and labor and are listed in Table A-18.<br />
Table A-18: City Cost Adjustments for Composite Project Cost<br />
Table A-18: City Cost Adjustments for<br />
Composite Project Cost – Materials and Labor<br />
LPOE Site Name<br />
Nearest City for<br />
Which Cost<br />
Adjustment<br />
Factor is<br />
Published<br />
RS Means<br />
& Co. City<br />
Cost<br />
Adjustme<br />
nt Factor<br />
Dalton Cache, AK Juneau AK 1.192<br />
Alcan, AK Juneau AK 1.192<br />
Skagway, AK Juneau AK 1.192<br />
Lukeville, AZ Tucson AZ 0.865<br />
Nogales, AZ Tucson AZ 0.865<br />
Sasabe, AZ Tucson AZ 0.865<br />
Douglas, AZ Tucson AZ 0.865<br />
San Luis, AZ Tucson AZ 0.865<br />
Naco, AZ Tucson AZ 0.865<br />
San Luis AZ (not built) Tucson AZ 0.865<br />
Nogales, AZ Tucson AZ 0.865<br />
Calexico West, CA San Diego CA 1.051<br />
San Ysidro, CA San Diego CA 1.051<br />
Andrade, CA San Diego CA 1.051<br />
Otay Mesa, CA San Diego CA 1.051<br />
Tecate, CA San Diego CA 1.051<br />
Calexico, CA San Diego CA 1.051<br />
Eastport, ID Couer D/Alene ID 0.97<br />
Porthill, ID Couer D/Alene ID 0.97<br />
Ferry Point, ME Machias ME 0.865<br />
Coburn Gore, ME Machias ME 0.865<br />
Fort Fairfield, ME Machias ME 0.865<br />
Houlton, ME Machias ME 0.865<br />
Jackman, ME Machias ME 0.865<br />
Limestone, ME Machias ME 0.865<br />
Orient, ME Machias ME 0.865<br />
Vanceboro, ME Machias ME 0.865<br />
VanBuren, ME Machias ME 0.865<br />
Milltown ME Machias ME 0.865<br />
97
Table A-18: City Cost Adjustments for<br />
Composite Project Cost – Materials and Labor<br />
LPOE Site Name<br />
Nearest City for<br />
Which Cost<br />
Adjustment<br />
Factor is<br />
Published<br />
RS Means<br />
& Co. City<br />
Cost<br />
Adjustme<br />
nt Factor<br />
St. Francis, ME Machias ME 0.865<br />
Madawaska, ME Machias ME 0.865<br />
Fort Kent, ME Machias ME 0.865<br />
St. Francis, ME Machias ME 0.865<br />
Detroit Cargo, MI Detroit MI 0.982<br />
Intl Bridge, MI Detroit MI 0.982<br />
Amb. Bridge, MI Detroit MI 0.982<br />
Grand Portage, MN Duluth MN 1.049<br />
Noyes, MN Duluth MN 1.049<br />
Roseau, MN Duluth MN 1.049<br />
Intl Falls, MN Duluth MN 1.049<br />
Baudette, MN Duluth MN 1.049<br />
Chief Mt, MT Havre MT 0.904<br />
Piegan, MT Havre MT 0.904<br />
Raymond, MT Havre MT 0.904<br />
Rooseville, MT Havre MT 0.904<br />
Sweetgrass, MT Havre MT 0.904<br />
Turner, MT Havre MT 0.904<br />
Ambrose, ND Minot ND 0.868<br />
Dunseith, ND Minot ND 0.868<br />
Portal, ND Minot ND 0.868<br />
St. John ND Minot ND 0.868<br />
Pembina, ND Minot ND 0.868<br />
Columbus, NM Las Cruces NM 0.893<br />
Santa Teresa, NM Las Cruces NM 0.893<br />
Alexandria Bay, NY Niagara Falls NY 1.015<br />
Champlain, NY Niagara Falls NY 1.015<br />
Massena, NY Niagara Falls NY 1.015<br />
Fort Covington, NY Niagara Falls NY 1.015<br />
Rouses Pt. NY Niagara Falls NY 1.015<br />
St John Hwy, NY Niagara Falls NY 1.015<br />
Trout, River, NY Niagara Falls NY 1.015<br />
Chateaugay, NY Niagara Falls NY 1.015<br />
Mooers, NY Niagara Falls NY 1.015<br />
Jamieson, NY Niagara Falls NY 1.015<br />
Niagra Falls, NY Niagara Falls NY 1.015<br />
98
Table A-18: City Cost Adjustments for<br />
Composite Project Cost – Materials and Labor<br />
LPOE Site Name<br />
Nearest City for<br />
Which Cost<br />
Adjustment<br />
Factor is<br />
Published<br />
RS Means<br />
& Co. City<br />
Cost<br />
Adjustme<br />
nt Factor<br />
Ogdensburg, NY Niagara Falls NY 1.015<br />
Brownsville/ Matamoros, TX McAllen TX 0.833<br />
Gateway, TX McAllen TX 0.833<br />
Columbia, TX McAllen TX 0.833<br />
Convent, TX McAllen TX 0.833<br />
Del Rio, TX McAllen TX 0.833<br />
Donna TX (not built) McAllen TX 0.833<br />
Bridge of the Americas, TX McAllen TX 0.833<br />
Eagle Pass, TX McAllen TX 0.833<br />
Fabens, TX McAllen TX 0.833<br />
Fort Hancock, TX McAllen TX 0.833<br />
El Paso, TX (out leased) McAllen TX 0.833<br />
Juarez-Lincoln, TX McAllen TX 0.833<br />
Los Indios, TX McAllen TX 0.833<br />
Laredo TX McAllen TX 0.833<br />
Los Tomates, TX McAllen TX 0.833<br />
McAllen, TX McAllen TX 0.833<br />
McAllen TX (not built) McAllen TX 0.833<br />
Marfa, TX McAllen TX 0.833<br />
Kika de la Garza, TX McAllen TX 0.833<br />
Paso Del Norte, TX McAllen TX 0.833<br />
Progreso, TX McAllen TX 0.833<br />
Roma, TX McAllen TX 0.833<br />
Rio Grande City, TX McAllen TX 0.833<br />
Ysleta, TX McAllen TX 0.833<br />
RR Inspection, TX McAllen TX 0.833<br />
Admin, TX (leased) McAllen TX 0.833<br />
El Paso, TX (Leased) McAllen TX 0.833<br />
DOT, TX (leased) McAllen TX 0.833<br />
Derby Line, VT Burlington VT 0.861<br />
Norton, VT Burlington VT 0.861<br />
Beebe Plain, VT Burlington VT 0.861<br />
Alburg Springs, VT Burlington VT 0.861<br />
North Troy VT Burlington VT 0.861<br />
West Berkshire,VT Burlington VT 0.861<br />
Derby Line, VT Burlington VT 0.861<br />
99
Table A-18: City Cost Adjustments for<br />
Composite Project Cost – Materials and Labor<br />
LPOE Site Name<br />
Nearest City for<br />
Which Cost<br />
Adjustment<br />
Factor is<br />
Published<br />
RS Means<br />
& Co. City<br />
Cost<br />
Adjustme<br />
nt Factor<br />
Beecher Falls, VT Burlington VT 0.861<br />
Canaan, VT Burlington VT 0.861<br />
East Richford, VT Burlington VT 0.861<br />
Richford, VT Burlington VT 0.861<br />
Alburg, VT (Joint ownership) Burlington VT 0.861<br />
Highgate Springs 1, VT Burlington VT 0.861<br />
Highgate Springs 2, VT Burlington VT 0.861<br />
Highgate Springs 3, VT Burlington VT 0.861<br />
Blaine, WA Everett WA 1.011<br />
Danville, WA Everett WA 1.011<br />
Laurier, WA Everett WA 1.011<br />
Mataline Falls. WA Everett WA 1.011<br />
Oroville, WA Everett WA 1.011<br />
Point Robert, WA Everett WA 1.011<br />
Sumas, WA Everett WA 1.011<br />
Blaine, WA Everett WA 1.011<br />
Blaine, WA Everett WA 1.011<br />
A.4 Optimization Technique<br />
The objective of the optimization problem is to minimize life-cycle cost. An excel<br />
spreadsheet was prepared to estimate the cost and savings associated with each<br />
renewable energy measure and the life-cycle cost for energy use at each LPOE.<br />
A computer program named “Premium Solver” from Frontline Systems was then<br />
used to adjust each of the following variables to minimize life-cycle cost:<br />
• kW of PV<br />
• kW of wind power<br />
• Square feet of Solar ventilation air preheating<br />
• Square feet of solar water heating<br />
• Square feet of solar thermal (parabolic troughs) and kW of solar thermal<br />
electric<br />
• BTU/hour of biomass boiler capacity and kW of biomass electric using:<br />
- Combustion<br />
100
- Gasification<br />
- Anaerobic Digestion<br />
• Percentage of office, packaging and warehouse roofs to be occupied by<br />
daylighting skylights.<br />
Life-cycle cost was calculated for the RE Solutions Case and for the Base Case<br />
by adding initial cost to any annual costs inflated over time and discounted to<br />
their present value. Initial cost used for the Base Case was zero. Initial costs for<br />
the RE Solutions Case were taken from NREL assessments and data of each RE<br />
industry. Annual costs for both the RE Solutions Case and the Base Case<br />
include maintenance, fuel, standby charges from the utility, payments to the utility<br />
associated with the difference between retail and delivered power, any<br />
production incentives, or other cash flows.<br />
The discount rate (4.6 percent) and energy cost escalation rates were used<br />
according to regulation 10CFR436. [2] The regulation specifies a maximum<br />
analysis period of 25 years for mechanical and electrical equipment, and the<br />
renewable energy measures considered here may be expected to last that long.<br />
In order to model costs which are not constant from year to year, such as<br />
accelerated depreciation, a 25-year cash flow analysis was prepared.<br />
The life-cycle cost analysis discounted all costs over a 25-year analysis period to<br />
their present worth. RE projects with life-cycle costs lower than the Base Case<br />
are good options. Life-cycle cost results were used to calculate return on<br />
investment. Cost-effective RE projects have rates of return higher than the<br />
discount rate used in the life-cycle analysis (4.6 percent).<br />
The solver routine calculates the change in life-cycle cost associated with a<br />
change in the size of each of the renewable energy technologies and then moves<br />
in the direction of LCC by an amount determined by a quadratic approximation<br />
(Figure A-20).<br />
The solver routine finds the minimum life-cycle cost in 13 variables, but only two<br />
variables can be illustrated in this two-dimensional figure. An increase and<br />
decrease in the size of each RE component is used to indicate direction of<br />
reducing life-cycle cost. The solver routine involved the following parameters—<br />
precision: value of energy use 0.0 +/- 0.0001; convergence: change in life-cycle<br />
cost less than $0.0001 for five iterations; quadratic extrapolation to obtain initial<br />
estimates of the variables in one-dimensional search; central derivatives used to<br />
estimate partial derivatives of the objective and constraint functions; and<br />
Newtonian Search Algorithm used at each iteration to determine the direction to<br />
search.<br />
101
Figure A-20: Illustration of the solver routine<br />
To further illustrate the cost effectiveness of each RE solution, simple payback<br />
period (initial cost divided by first full year of savings) was calculated and<br />
reported. Other results reported for decision makers include the percentage<br />
contribution of cost-effective RE solutions to energy use. This percentage is<br />
reported for each LPOE site and is aggregated across regions. These same cost<br />
analyses were run for the Base Case where no RE solutions are applied and for<br />
the RE Solutions Case where optimal RE technologies are used. The Base<br />
Case analyses are compared with the RE Solutions Case in several results<br />
tables.<br />
102
Appendix B. Results of Life-Cycle Cost Optimization<br />
(No Tax Incentives)<br />
The key result of the analysis is the size of each renewable-energy measure that<br />
minimizes life-cycle cost at each LPOE. Results indicate that daylighting has<br />
application at LPOE sites without excessive heat loss through skylights and solar<br />
ventilation air preheating is cost-effective at every cold-weather location that can<br />
use the heat. Other measures such as solar water heating depend on the solar<br />
resource and utility rates at a site. PV depends on local incentives to be cost<br />
effective. It is difficult to compare the sizes because they are in different units<br />
(kW, sf, Mbtu/hr, etc.) so in order to compare equal units, the annual energy<br />
delivery of each technology (Mbtu/year) is illustrated in Figure B-2.<br />
Note that each technology is recommended as part of the optimized solution for a<br />
site, and these sizes minimize life-cycle costs. In other words, it is possible for<br />
an LPOE site to cost effectively generate more RE than the optimized solution<br />
indicates, but the life cycle costs would be higher.<br />
Figure B-1: Annual energy delivery of each cost-effectvie RE technology<br />
summed over all <strong>GSA</strong> LPOE<br />
103
Kenneth Ward, WA<br />
Blaine, WA<br />
Blaine, WA<br />
Sumas, WA<br />
Point Robert, WA<br />
Oroville, WA<br />
Mataline Falls. WA<br />
Laurier, WA<br />
Danville, WA<br />
Blaine, WA<br />
Highgate Springs 3, VT<br />
Highgate Springs 2, VT<br />
Highgate Springs 1, VT<br />
Alburg, VT, joint owner<br />
Richford, VT<br />
East Richford, VT<br />
Canaan, VT<br />
Beecher Falls, VT<br />
Derby Line, VT<br />
West Berkshire,VT<br />
North Troy VT<br />
Alburg Springs, VT<br />
Beebe Plain, VT<br />
Norton, VT<br />
Derby Line, VT<br />
DOT, TX, leased<br />
El Paso, TX, Leased<br />
(Admin, TX (leased<br />
RR Inspection, TX<br />
Ysleta, TX<br />
Rio Grande City, TX<br />
Roma, TX<br />
Progreso, TX<br />
Paso Del Norte, TX<br />
Kika de la Garza, TX<br />
Marfa, TX<br />
McAllen TX, not built yet<br />
McAllen, TX<br />
Los Tomates, TX<br />
Laredo TX<br />
Los Indios, TX<br />
Juarez-Lincoln, TX<br />
El Paso, TX, leased<br />
Fort Hancock, TX<br />
Fabens, TX<br />
Eagle Pass, TX<br />
Bridge of the Americas, TX<br />
Donna TX, not built yet<br />
Del Rio, TX<br />
Convent, TX<br />
Columbia, TX<br />
Gateway, TX<br />
Brownsville TX<br />
Ogdensburg BS<br />
Niagra Falls, NY<br />
Jamieson, NY<br />
Mooers, NY<br />
Chateaugay, NY<br />
Trout, River, NY<br />
St John Hwy, NY<br />
Rouses Pt. NY<br />
Fort Covington, NY<br />
Massena, NY<br />
Champlain, NY<br />
Alexandria Bay, NY<br />
Santa Teresa, NM<br />
Columbus, NM<br />
Pembina, ND<br />
St. John ND<br />
Portal, ND<br />
Dunseith, ND<br />
Ambrose, ND<br />
Turner, MT<br />
Sweetgrass, MT<br />
Rooseville, MT<br />
Raymond, MT<br />
Piegan, MT<br />
Chief Mt, MT<br />
Baudette, MN<br />
Intl Falls, MN<br />
Roseau, MN<br />
Noyes, MN<br />
Grand Portage, MN<br />
Amb. Bridge, MI<br />
Intl Bridge, MI<br />
Detroit Cargo, MI<br />
St. Francis, ME<br />
Fort Kent, ME<br />
Madawaska, ME<br />
St. Francis, ME<br />
Milltown ME<br />
VanBuren, ME<br />
Vanceboro, ME<br />
Orient, ME<br />
Limestone, ME<br />
Jackman, ME<br />
Houlton, ME<br />
Fort Fairfield, ME<br />
Coburn Gore, ME<br />
Ferry Point, ME<br />
Porthill, ID<br />
Eastport, ID<br />
Calexico, CA<br />
Tecate, CA<br />
Otay Mesa, CA<br />
Andrade, CA<br />
San Ysidro, CA<br />
Calexico West, CA<br />
Nogales, AZ<br />
(San Luis AZ (not built yet<br />
Naco, AZ<br />
San Luis, AZ<br />
Douglas, AZ<br />
Sasabe, AZ<br />
Nogales, AZ<br />
Lukeville, AZ<br />
Skagway, AK<br />
Alcan, AK<br />
Dalton Cache, AK<br />
0 1000 2000 3000 4000 5000<br />
Wind<br />
Solar Vent<br />
Preheat<br />
Solar Water<br />
Heating<br />
Solar Thermal<br />
Biomass Gasifier<br />
Anaerobic<br />
Digester (Mbtu)<br />
Daylighting<br />
Photovoltaics<br />
Annual Renewable Energy Delivery (Mbtu)<br />
Figure B-2: Annual energy from cost-effective RE technologies at each<br />
LPOE (without tax incentives)<br />
104
B.1 Renewable Energy Use v. Total Energy Use<br />
While some LPOEs may get a large fraction of their power from cost-effective<br />
renewable energy projects on-site, and some even generate more than they use<br />
(selling excess to the utility at avoided cost), the total percentage of renewable<br />
energy use for all of the LPOEs combined would be more than 15 percent<br />
without financial incentives and 22 percent with financial incentives. Table B-2<br />
shows results for each site without financial incentives.<br />
Table B-1: RE Use as Percentage of Total Energy Use by <strong>GSA</strong> Region<br />
(without incentives)<br />
<strong>GSA</strong> Region<br />
Data 1 2 5 7 8 9 10 Grand Total<br />
Sum of Base Case<br />
Energy Use 32,101 59,543 37,033 162,773 39,936 115,340 49,782 496,508<br />
(Mbtu/year)<br />
Sum of RE Case<br />
Energy Use 26,117 49,027 33,118 130,308 35,467 95,059 43,607 412,703<br />
(Mbtu/year)<br />
Percent Renewable<br />
Energy Use (%)<br />
18.6% 17.6% 10.6% 19.9% 11.2% 17.6% 12.4% 16.8%<br />
Table B-2: RE Use as Percentage of Total Energy Use by LPOE Site (without incentives)<br />
Table B-2: RE Use as Percentage of Total Energy Use by LPOE Site<br />
(without incentives)<br />
LPOE Site Name<br />
Base Case Energy<br />
Use (Mbtu/yr)<br />
RE Solutions Case<br />
Energy Use (Mbtu/yr)<br />
Renewable<br />
Energy Use (%)<br />
Turner, MT 53 -21 140.8%<br />
Niagra Falls, NY 6,647 2,093 68.5%<br />
Laurier, WA 243 98 59.8%<br />
Marfa, TX 2,098 845 59.7%<br />
Coburn Gore, ME 1,531 620 59.5%<br />
Sweetgrass, MT 2,488 1,081 56.6%<br />
Fort Kent, ME 1,609 712 55.7%<br />
Alburg, VT (Joint ownership) 142 71 50.2%<br />
Orient, ME 159 83 47.6%<br />
Columbia, TX 7,275 3,811 47.6%<br />
Los Tomates, TX 8,674 4,820 44.4%<br />
Brownsville/Matamoros TX 3,377 2,042 39.5%<br />
Gateway, TX 6,538 3,998 38.9%<br />
Houlton, ME 3,515 2,171 38.2%<br />
105
Table B-2: RE Use as Percentage of Total Energy Use by LPOE Site<br />
(without incentives)<br />
LPOE Site Name<br />
Base Case Energy<br />
Use (Mbtu/yr)<br />
RE Solutions Case<br />
Energy Use (Mbtu/yr)<br />
Renewable<br />
Energy Use (%)<br />
Derby Line, VT 1,296 804 38.0%<br />
Andrade, CA 1,163 726 37.6%<br />
Point Robert, WA 2,385 1,518 36.4%<br />
RR Inspection, TX 28 18 35.8%<br />
Tecate, CA 3,929 2,525 35.7%<br />
Alexandria Bay, NY 4,703 3,044 35.3%<br />
San Luis, AZ 6,091 4,072 33.1%<br />
Baudette, MN 265 177 33.0%<br />
Kika de la Garza, TX 9,197 6,309 31.4%<br />
Jamieson, NY 94 65 31.2%<br />
Porthill, ID 487 338 30.6%<br />
Danville, WA 710 493 30.6%<br />
Calexico, CA 12,926 9,052 30.0%<br />
St. Francis, ME 125 88 30.0%<br />
Columbus, NM 1,845 1,305 29.3%<br />
North Troy VT 353 257 27.1%<br />
Ogdensburg NY 5,477 3,998 27.0%<br />
Ferry Point, ME 1,574 1,153 26.7%<br />
Blaine, WA 3,113 2,309 25.8%<br />
Trout, River, NY 782 583 25.5%<br />
Fabens, TX 1,000 751 25.0%<br />
Sasabe, AZ 775 584 24.7%<br />
West Berkshire,VT 437 329 24.6%<br />
Blaine, WA 2,486 1,882 24.3%<br />
VanBuren, ME 892 684 23.3%<br />
Roseau, MN 3,397 2,626 22.7%<br />
Massena, NY 2,046 1,580 22.7%<br />
Beecher Falls, VT 717 555 22.6%<br />
St John Hwy, NY 1,360 1,056 22.3%<br />
Jackman, ME 977 760 22.2%<br />
Vanceboro, ME 985 772 21.6%<br />
Eastport, ID 1,896 1,492 21.3%<br />
East Richford, VT 520 409 21.3%<br />
Douglas, AZ 4,835 3,821 21.0%<br />
Richford, VT 656 520 20.7%<br />
Limestone, ME 446 355 20.4%<br />
Lukeville, AZ 2,521 2,028 19.5%<br />
Naco, AZ 1,627 1,309 19.5%<br />
106
Table B-2: RE Use as Percentage of Total Energy Use by LPOE Site<br />
(without incentives)<br />
LPOE Site Name<br />
Base Case Energy<br />
Use (Mbtu/yr)<br />
RE Solutions Case<br />
Energy Use (Mbtu/yr)<br />
Renewable<br />
Energy Use (%)<br />
Rouses Pt. NY 1,000 808 19.3%<br />
Grand Portage, MN 2,365 1,916 19.0%<br />
Mooers, NY 497 402 19.0%<br />
Noyes, MN 1,396 1,138 18.5%<br />
Fort Covington, NY 582 476 18.2%<br />
Otay Mesa, CA 17,593 14,455 17.8%<br />
DOT, TX (leased) 4,326 3,557 17.8%<br />
Fort Fairfield, ME 644 530 17.7%<br />
Dunseith, ND 866 714 17.6%<br />
Canaan, VT 509 419 17.6%<br />
Chateaugay, NY 702 580 17.5%<br />
Dalton Cache, AK 2,004 1,668 16.8%<br />
Skagway, AK 1,651 1,373 16.8%<br />
Del Rio, TX 8,114 6,766 16.6%<br />
Ambrose, ND 528 442 16.3%<br />
Alburg Springs, VT 300 251 16.3%<br />
Progreso, TX 2,103 1,761 16.2%<br />
Madawaska, ME 1,049 884 15.7%<br />
St. John ND 528 450 14.7%<br />
Alcan, AK 13,613 11,626 14.6%<br />
Fort Hancock, TX 1,264 1,081 14.4%<br />
Beebe Plain, VT 308 266 13.6%<br />
San Ysidro, CA 29,704 25,820 13.1%<br />
Portal, ND 1,725 1,511 12.4%<br />
Eagle Pass, TX 5,495 4,811 12.4%<br />
St. Francis, ME 143 127 11.4%<br />
Ysleta, TX 12,438 11,017 11.4%<br />
Los Indios, TX 7,665 6,798 11.3%<br />
Donna TX (not built yet) 765 679 11.2%<br />
Juarez-Lincoln, TX 15,520 13,830 10.9%<br />
Piegan, MT 5,321 4,751 10.7%<br />
Intl Falls, MN 1,144 1,029 10.0%<br />
Roma, TX 3,739 3,368 9.9%<br />
Norton, VT 976 879 9.9%<br />
Highgate Springs 3, VT 448 406 9.5%<br />
Milltown ME 295 268 9.1%<br />
Paso Del Norte, TX 6,595 5,995 9.1%<br />
Santa Teresa, NM 5,621 5,130 8.7%<br />
107
Table B-2: RE Use as Percentage of Total Energy Use by LPOE Site<br />
(without incentives)<br />
LPOE Site Name<br />
Base Case Energy<br />
Use (Mbtu/yr)<br />
RE Solutions Case<br />
Energy Use (Mbtu/yr)<br />
Renewable<br />
Energy Use (%)<br />
Pembina, ND 12,723 11,627 8.6%<br />
Laredo TX 2,469 2,264 8.3%<br />
McAllen, TX 2,810 2,576 8.3%<br />
Rio Grande City, TX 3,346 3,108 7.1%<br />
Nogales, AZ 8,039 7,485 6.9%<br />
Derby Line, VT 2,241 2,091 6.7%<br />
Bridge of the Americas, TX 19,742 18,554 6.0%<br />
Raymond, MT 7,866 7,401 5.9%<br />
Calexico West, CA 13,567 12,868 5.2%<br />
Convent, TX 5,731 5,454 4.8%<br />
Champlain, NY 35,654 33,994 4.7%<br />
Highgate Springs 2, VT 9,244 8,808 4.7%<br />
Nogales, AZ 11,804 11,310 4.2%<br />
Blaine, WA 10,592 10,151 4.2%<br />
Kenneth Ward, WA 1,830 1,756 4.0%<br />
Chief Mt, MT 5,885 5,750 2.3%<br />
Oroville, WA 4,818 4,759 1.2%<br />
Detroit Cargo, MI 14,848 14,688 1.1%<br />
TOTAL FOR ALL SITES<br />
(including ones with no RE<br />
Solutions)<br />
496,508 420,694 15.3%<br />
The following LPOE sites had no cost-effective RE solutions:<br />
• San Luis AZ (not built );<br />
• El Paso, TX (Leased);<br />
• Amb. Bridge, MI;<br />
• McAllen TX (not built);<br />
• Intl Bridge, MI;<br />
• Highgate Springs 1, VT;<br />
• Rooseville, MT;<br />
• Mataline Falls. WA;<br />
• Admin, TX (leased);<br />
• Sumas, WA.<br />
108
B.2 CO 2 Emissions Avoided<br />
For each LPOE site, electricity saved from daylighting, wind power, solar<br />
ventilation preheat, and biomass in kWh was totaled. This total was multiplied by<br />
the appropriate CO 2 offset factor for the zip code of the LPOE site. The<br />
multipliers were taken from the US EPA on-line application<br />
http://www.epa.gov/cleanenergy/energy-and-you/how-clean.html.<br />
For each LPOE site, therms saved/produced for daylighting (negative), solar<br />
ventilation preheating, biomass, and solar water heating were multiplied by the<br />
CO 2 offset factor for natural gas of 11.64 lb/therm.<br />
CO 2 emissions avoided from electricity saved and natural gas saved at each site<br />
were totaled and reported by region (Table B-3) and by individual sites (Table B-<br />
4).<br />
Table B-3: CO 2 Avoided by <strong>GSA</strong> Region<br />
(without incentives)<br />
<strong>GSA</strong> Region<br />
1 2 5 7 8 9 10 Overall<br />
CO 2 Emissions<br />
Avoided: electricity 0.53 1.61 0.24 9.73 0.50 7.11 1.31 21.03<br />
(million lbs/yr)<br />
CO 2 Emissions<br />
Avoided: natural gas<br />
(million lbs/yr) 0.58 0.63 0.17 0.44 0.38 0.57 0.58 3.35<br />
Total CO 2 Emissions<br />
Avoided (million lbs/yr) 1.11 2.24 0.41 10.17 0.88 7.68 1.89 24.38<br />
109
Table B-4: CO 2 Avoided with RE Solutions by Site<br />
Table B-4: CO 2 Avoided by Site (without incentives)<br />
LPOE Site Name<br />
CO 2 prevented from natural<br />
gas savings (lbs/yr)<br />
CO 2 prevented from<br />
electricity saved (lbs)<br />
Total CO 2 prevented<br />
(lbs/yr)<br />
Dalton Cache, AK 32,618 8,185 40,803<br />
Alcan, AK 231,311 1 231,312<br />
Skagway, AK 29,321 3,750 33,071<br />
Lukeville, AZ 26,576 421,003 447,579<br />
Nogales, AZ -5,834 232,278 226,444<br />
Sasabe, AZ 9,164 141,536 150,700<br />
Douglas, AZ 73,202 148,080 221,282<br />
San Luis, AZ 141,619 1,080,617 1,222,237<br />
Naco, AZ 21,177 52,044 73,221<br />
San Luis AZ (not built) 0 1 1<br />
Nogales, AZ -6,764 212,093 205,329<br />
Calexico West, CA -6,679 290,802 284,124<br />
San Ysidro, CA -14,227 850,222 835,994<br />
Andrade, CA 12,614 274,056 286,670<br />
Otay Mesa, CA -21,011 704,265 683,254<br />
Tecate, CA 91,322 406,479 497,800<br />
Calexico, CA 252,662 2,293,549 2,546,211<br />
Eastport, ID 47,021 165,428 212,449<br />
Porthill, ID 17,331 42,480 59,810<br />
Ferry Point, ME 49,004 1 49,005<br />
Coburn Gore, ME 63,591 99,351 162,941<br />
Fort Fairfield, ME 9,608 8,561 18,169<br />
Houlton, ME 124,147 75,525 199,672<br />
Jackman, ME 25,217 0 25,217<br />
Limestone, ME 7,816 6,524 14,340<br />
Orient, ME 5,836 6,937 12,773<br />
Vanceboro, ME 20,294 10,544 30,838<br />
VanBuren, ME 24,227 0 24,227<br />
Milltown ME 2,430 1,596 4,026<br />
St. Francis, ME 4,380 11,244 15,624<br />
Madawaska, ME 13,694 12,872 26,566<br />
Fort Kent, ME 63,199 96,113 159,312<br />
St. Francis, ME 1,909 12,874 14,783<br />
Detroit Cargo, MI -20,031 152,131 132,099<br />
Intl Bridge, MI 0 0 0<br />
Amb. Bridge, MI 0 0 0<br />
Grand Portage, MN 43,379 41,034 84,413<br />
Noyes, MN 30,033 0 30,033<br />
110
Table B-4: CO 2 Avoided by Site (without incentives)<br />
LPOE Site Name<br />
CO 2 prevented from natural<br />
gas savings (lbs/yr)<br />
CO 2 prevented from<br />
electricity saved (lbs)<br />
Total CO 2 prevented<br />
(lbs/yr)<br />
Roseau, MN 89,728 0 89,728<br />
Intl Falls, MN 13,370 0 13,370<br />
Baudette, MN 10,163 46,641 56,804<br />
Chief Mt, MT 15,677 0 15,677<br />
Piegan, MT 19,211 107,123 126,334<br />
Raymond, MT 54,089 1 54,091<br />
Rooseville, MT 0 1 1<br />
Sweetgrass, MT 95,489 372,218 467,707<br />
Turner, MT 2,025 19,564 21,589<br />
Ambrose, ND 10,023 1 10,024<br />
Dunseith, ND 17,689 1 17,690<br />
Portal, ND 24,880 1 24,882<br />
St. John ND 9,001 1 9,001<br />
Pembina, ND 127,622 4 127,626<br />
Columbus, NM 40,240 308,621 348,861<br />
Santa Teresa, NM -1,598 194,134 192,536<br />
Alexandria Bay, NY 61,614 238,686 300,300<br />
Champlain, NY 101,838 165,866 267,704<br />
Massena, NY 54,160 0 54,160<br />
Fort Covington, NY 8,772 6,406 15,178<br />
Rouses Pt. NY 16,320 11,088 27,408<br />
St John Hwy, NY 35,322 1 35,322<br />
Trout, River, NY 16,564 12,055 28,618<br />
Chateaugay, NY 14,295 0 14,295<br />
Mooers, NY 7,764 5,861 13,626<br />
Jamieson, NY 2,506 1,636 4,142<br />
Niagra Falls, NY 232,113 1,004,548 1,236,660<br />
Ogdensburg, NY 79,618 168,138 247,756<br />
Brownsville/<br />
Matamoros, TX -14 517,782 517,768<br />
Gateway, TX -681 987,929 987,248<br />
Columbia, TX 171,344 1,704,380 1,875,724<br />
Convent, TX -2,259 114,955 112,696<br />
Del Rio, TX 72,297 281,769 354,066<br />
Donna TX (not built) 0 33,332 33,332<br />
Bridge of the Americas,<br />
TX -6,509 477,901 471,392<br />
Eagle Pass, TX -1,258 269,402 268,144<br />
Fabens, TX 18,777 160,892 179,669<br />
111
Table B-4: CO 2 Avoided by Site (without incentives)<br />
LPOE Site Name<br />
CO 2 prevented from natural<br />
gas savings (lbs/yr)<br />
CO 2 prevented from<br />
electricity saved (lbs)<br />
Total CO 2 prevented<br />
(lbs/yr)<br />
Fort Hancock, TX 16,630 15,183 31,814<br />
El Paso, TX (out leased) 0 -1,435,344 -1,435,344<br />
Juarez-Lincoln, TX -1,933 662,509 660,576<br />
Los Indios, TX -613 338,517 337,904<br />
Laredo TX -507 81,365 80,858<br />
Los Tomates, TX -671 1,497,772 1,497,101<br />
McAllen, TX -272 91,443 91,170<br />
McAllen TX (not built) 0 1 1<br />
Marfa, TX 61,581 280,919 342,501<br />
Kika de la Garza, TX -590 1,122,805 1,122,215<br />
Paso Del Norte, TX -5,589 249,095 243,506<br />
Progreso, TX 21,084 331,540 352,624<br />
Roma, TX 18,971 80,705 99,675<br />
Rio Grande City, TX -1,184 96,411 95,228<br />
Ysleta, TX -4,405 560,715 556,311<br />
RR Inspection, TX -107 7,773 7,666<br />
Admin, TX (leased) 0 1 1<br />
El Paso, TX (leased) 0 0 0<br />
DOT, TX (leased) 47,154 695,143 742,297<br />
Derby Line, VT 10,859 15,485 26,345<br />
Norton, VT 6,288 11,592 17,880<br />
Beebe Plain, VT 2,800 4,801 7,601<br />
Alburg Springs, VT 3,431 5,280 8,710<br />
North Troy VT 7,671 8,067 15,738<br />
West Berkshire,VT 8,006 10,568 18,574<br />
Derby Line, VT 45,016 28,720 73,736<br />
Beecher Falls, VT 13,295 13,020 26,315<br />
Canaan, VT 7,499 6,888 14,387<br />
East Richford, VT 7,898 11,686 19,585<br />
Richford, VT 11,091 10,985 22,076<br />
Alburg, VT (Joint<br />
ownership) 5,415 19,426 24,841<br />
Highgate Springs 1, VT 0 1,110 1,110<br />
Highgate Springs 2, VT 34,401 38,153 72,555<br />
Highgate Springs 3, VT 2,298 6,165 8,463<br />
Blaine, WA 69,782 325,436 395,219<br />
Danville, WA 18,730 14,902 33,632<br />
Laurier, WA 9,250 38,620 47,871<br />
Mataline Falls. WA 0 25,480 25,480<br />
112
Table B-4: CO 2 Avoided by Site (without incentives)<br />
LPOE Site Name<br />
CO 2 prevented from natural<br />
gas savings (lbs/yr)<br />
CO 2 prevented from<br />
electricity saved (lbs)<br />
Total CO 2 prevented<br />
(lbs/yr)<br />
Oroville, WA 6,886 3 6,889<br />
Point Robert, WA 75,940 264,748 340,688<br />
Sumas, WA 0 1 1<br />
Blaine, WA 70,372 216,898 287,270<br />
Blaine, WA -24,453 172,095 147,642<br />
Kenneth Ward, WA -3,910 28,322 24,412<br />
Totals (millions) 3.35 21.03 24.38<br />
113
B.3 Initial Cost<br />
Initial cost of $0 means the RE technology could not be sized to yield a return on<br />
investment greater than the discount rate of the life-cycle analysis (4.6 percent).<br />
PV and solar process heat were not found to be cost effective at any LPOE site<br />
without incentives.<br />
Note that each technology is recommended as part of the optimized solution for a<br />
site, and these sizes minimize life-cycle costs. In other words, it is possible for<br />
an LPOE site to cost effectively generate more RE than the optimized solution<br />
indicates, but the life cycle costs would be higher.<br />
Table B-5: Initial Cost of RE Technologies by <strong>GSA</strong> Region<br />
(without incentives)<br />
<strong>GSA</strong> Region<br />
RE<br />
Technology 1 2 5 7 8 9 10 Grand Total<br />
Daylighting $236,602 $719,494 $96,240 $2,739,282 $158,736 $1,602,373 $336,348 $5,889,073<br />
Wind<br />
Energy $4,350 $1,007,008 $0 $3,040,547 $14,562 $1,501,536 $0 $5,568,005<br />
Solar Vent<br />
Preheat $623,082 $1,070,017 $222,167 $157,312 $373,540 $85,603 $712,677 $3,244,397<br />
Solar Water<br />
Heating $185,083 $341,784 $4,312 $580,114 $40,669 $572,870 $332,260 $2,057,091<br />
Biomass<br />
Gasifier $221,424 $100,237 $81 $137,234 $83,082 $408,204 $0 $950,262<br />
Total RE<br />
Solution<br />
Initial Cost $1,270,542.00 $3,238,542.00 $322,805.00 $6,654,496.00 $670,597.00 $4,170,595.00 $1,381,295.00 $17,708,828.00<br />
114
Table B-6: Initial Costs for RE Technologies by Site (without incentives)<br />
Table B-6: Initial Costs for RE Technologies by Site<br />
(without incentives)<br />
Wind Initial<br />
Cost ($)<br />
Solar<br />
Vent<br />
Preheat<br />
Cost ($)<br />
Solar<br />
Water<br />
Heating<br />
Cost ($)<br />
Biomass<br />
Gasifier<br />
Cost ($)<br />
Daylighting<br />
Cost ($)<br />
Total Initial<br />
Cost ($)<br />
Juarez-Lincoln, TX $1,253,512 $0 $0 $0 $316,588 $1,570,100<br />
Niagra Falls, NY $527,588 $512,553 $119,938 $98,311 $262,393 $1,520,782<br />
Otay Mesa, CA $595,107 $0 $214,833 $0 $405,135 $1,215,074<br />
Los Tomates, TX $933,797 $0 $0 $0 $197,511 $1,131,309<br />
Columbia, TX $567,630 $0 $117,830 $164,393 $252,593 $1,102,447<br />
Kika de la Garza, TX $848,325 $0 $0 $0 $206,342 $1,054,667<br />
San Ysidro, CA $768,846 $0 $0 $0 $270,670 $1,039,517<br />
Bridge of the Americas,<br />
TX<br />
$737,064 $0 $0 $0 $219,433 $956,498<br />
Gateway, TX $690,677 $0 $0 $0 $121,059 $811,736<br />
Champlain, NY $402,486 $229,362 $0 $0 $173,289 $805,137<br />
Alexandria Bay, NY $479,418 $56,770 $0 $0 $64,198 $600,386<br />
Calexico, CA $0 $0 $179,648 $177,412 $206,908 $563,968<br />
Brownsville/<br />
Matamoros, TX<br />
$394,213 $0 $0 $0 $72,198 $466,410<br />
Ogdensburg, NY $0 $226,561 $0 $0 $175,361 $401,922<br />
Alcan, AK $0 $148,625 $219,513 $0 $1 $368,140<br />
Sweetgrass, MT $0 $98,160 $39,911 $91,169 $58,033 $287,272<br />
San Luis, AZ $0 $0 $83,316 $130,831 $69,113 $283,260<br />
Nogales, AZ $0 $0 $163,909 $0 $108,131 $272,040<br />
Del Rio, TX $0 $0 $132,905 $0 $136,352 $269,257<br />
Ysleta, TX $0 $0 $0 $0 $259,146 $259,146<br />
Tecate, CA $0 $46,845 $47,974 $87,268 $69,177 $251,264<br />
Marfa, TX $173,533 $0 $29,958 $0 $34,951 $238,443<br />
Nogales, AZ $0 $0 $110,359 $0 $120,850 $231,210<br />
Douglas, AZ $0 $70,483 $67,951 $0 $77,813 $216,247<br />
DOT, TX (leased) $0 $70,007 $71,366 $0 $72,904 $214,277<br />
Piegan, MT $0 $27,744 $85,509 $0 $90,607 $203,861<br />
Houlton, ME $0 $44,147 $61,189 $83,149 $1 $188,485<br />
Blaine, WA $0 $79,049 $48,829 $0 $50,389 $178,267<br />
Andrade, CA $137,582 $0 $16,185 $0 $12,947 $166,715<br />
Los Indios, TX $0 $0 $0 $0 $163,432 $163,432<br />
Calexico West, CA $0 $0 $0 $0 $162,694 $162,695<br />
Blaine, WA $0 $0 $0 $0 $162,654 $162,654<br />
Raymond, MT $0 $33,957 $128,247 $0 $1 $162,206<br />
Point Robert, WA $0 $75,821 $36,522 $0 $43,680 $156,023<br />
115
Table B-6: Initial Costs for RE Technologies by Site<br />
(without incentives)<br />
Wind Initial<br />
Cost ($)<br />
Solar<br />
Vent<br />
Preheat<br />
Cost ($)<br />
Solar<br />
Water<br />
Heating<br />
Cost ($)<br />
Biomass<br />
Gasifier<br />
Cost ($)<br />
Daylighting<br />
Cost ($)<br />
Total Initial<br />
Cost ($)<br />
Coburn Gore, ME $0 $5,655 $27,996 $79,804 $19,673 $133,128<br />
Eagle Pass, TX $0 $0 $0 $0 $127,361 $127,361<br />
Paso Del Norte, TX $0 $0 $0 $0 $117,745 $117,746<br />
Fort Kent, ME $0 $9,426 $0 $90,978 $12,691 $113,095<br />
Columbus, NM $0 $48,451 $25,652 $0 $31,569 $105,673<br />
Roma, TX $0 $0 $59,677 $0 $44,628 $104,305<br />
Santa Teresa, NM $0 $0 $0 $0 $88,329 $88,330<br />
Lukeville, AZ $0 $0 $34,520 $0 $48,486 $83,007<br />
Derby Line, VT $0 $34,070 $24,735 $0 $24,057 $82,862<br />
Admin, TX (leased) $0 $0 $0 $0 $79,230 $79,230<br />
Blaine, WA $0 $79,049 $0 $0 $1 $79,050<br />
Pembina, ND $0 $78,326 $0 $0 $1 $78,327<br />
Detroit Cargo, MI $0 $0 $0 $0 $77,868 $77,868<br />
Progreso, TX $0 $0 $35,031 $0 $35,880 $70,912<br />
Dalton Cache, AK $0 $20,588 $29,864 $0 $19,267 $69,718<br />
Derby Line, VT $0 $11,295 $42,775 $0 $13,963 $68,033<br />
Kenneth Ward, WA $0 $40,436 $0 $0 $26,495 $66,931<br />
Highgate Springs 2, VT $1 $32,391 $0 $0 $32,210 $64,603<br />
Convent, TX $0 $0 $0 $0 $62,573 $62,574<br />
Massena, NY $0 $23,290 $37,942 $0 $0 $61,232<br />
Eastport, ID $0 $31,757 $28,686 $0 $0 $60,444<br />
Roseau, MN $0 $60,384 $0 $0 $1 $60,384<br />
Limestone, ME $38,060 $4,471 $8,291 $0 $6,331 $57,152<br />
Ferry Point, ME $0 $24,711 $28,549 $0 $0 $53,260<br />
Rio Grande City, TX $0 $0 $0 $0 $52,686 $52,686<br />
Naco, AZ $0 $0 $22,329 $0 $29,422 $51,751<br />
Fabens, TX $0 $20,344 $14,545 $0 $15,729 $50,618<br />
Skagway, AK $0 $15,290 $24,591 $0 $8,757 $48,638<br />
Grand Portage, MN $0 $27,760 $0 $0 $18,372 $46,132<br />
McAllen, TX $0 $0 $0 $0 $44,664 $44,664<br />
St John Hwy, NY $0 $18,171 $25,006 $0 $0 $43,177<br />
Rouses Pt. NY $0 $10,138 $18,396 $0 $13,318 $41,852<br />
Laredo TX $0 $0 $0 $0 $40,968 $40,968<br />
Madawaska, ME $0 $8,871 $19,608 $0 $12,352 $40,831<br />
Trout, River, NY $0 $10,958 $14,638 $0 $14,368 $39,965<br />
Vanceboro, ME $0 $11,445 $18,061 $0 $9,855 $39,361<br />
116
Table B-6: Initial Costs for RE Technologies by Site<br />
(without incentives)<br />
Wind Initial<br />
Cost ($)<br />
Solar<br />
Vent<br />
Preheat<br />
Cost ($)<br />
Solar<br />
Water<br />
Heating<br />
Cost ($)<br />
Biomass<br />
Gasifier<br />
Cost ($)<br />
Daylighting<br />
Cost ($)<br />
Total Initial<br />
Cost ($)<br />
Beecher Falls, VT $0 $9,331 $13,754 $0 $11,985 $35,071<br />
Fort Hancock, TX $0 $8,913 $17,957 $0 $7,170 $34,040<br />
Turner, MT $14,561 $8,396 $839 $0 $10,091 $33,887<br />
Richford, VT $0 $7,814 $12,515 $0 $10,231 $30,561<br />
Danville, WA $0 $17,465 $0 $0 $11,590 $29,056<br />
East Richford, VT $0 $8,392 $9,928 $0 $10,725 $29,045<br />
Laurier, WA $0 $11,501 $3,986 $0 $13,512 $28,998<br />
VanBuren, ME $0 $12,167 $16,045 $0 $0 $28,212<br />
Sasabe, AZ $0 $0 $6,371 $0 $21,024 $27,395<br />
Fort Fairfield, ME $0 $5,882 $12,065 $0 $8,266 $26,212<br />
West Berkshire,VT $0 $7,364 $8,148 $0 $10,148 $25,660<br />
Fort Covington, NY $0 $5,733 $10,881 $0 $7,812 $24,426<br />
Mooers, NY $0 $5,278 $9,108 $0 $7,202 $21,589<br />
Canaan, VT $0 $4,800 $9,575 $0 $6,615 $20,990<br />
Norton, VT $0 $7,702 $0 $0 $12,198 $19,900<br />
North Troy VT $0 $5,884 $6,695 $0 $7,274 $19,854<br />
Jackman, ME $0 $19,242 $0 $0 $0 $19,242<br />
Chateaugay, NY $1 $6,080 $12,925 $0 $0 $19,006<br />
Alburg, VT (Joint<br />
ownership)<br />
$2,435 $8,550 $2,588 $0 $4,730 $18,302<br />
Highgate Springs 3, VT $0 $4,381 $8,153 $0 $5,751 $18,285<br />
Porthill, ID $0 $9,956 $7,680 $0 $0 $17,636<br />
Noyes, MN $0 $16,334 $0 $0 $0 $16,334<br />
Portal, ND $0 $15,518 $0 $0 $0 $15,519<br />
Donna TX (not built) $0 $0 $0 $0 $14,708 $14,708<br />
El Paso, TX (out leased) $0 $0 $0 $0 $14,295 $14,296<br />
Orient, ME $0 $4,318 $2,824 $0 $6,542 $13,685<br />
Alburg Springs, VT $0 $3,166 $5,480 $0 $4,898 $13,545<br />
Baudette, MN $0 $8,399 $4,572 $0 $0 $12,971<br />
Chief Mt, MT $0 $12,461 $0 $0 $0 $12,461<br />
Intl Falls, MN $0 $11,464 $0 $0 $0 $11,464<br />
El Paso, TX (Leased) $0 $0 $0 $0 $11,351 $11,351<br />
Dunseith, ND $0 $11,130 $0 $0 $0 $11,131<br />
Milltown, ME $0 $1,089 $5,342 $0 $1,560 $7,992<br />
Beebe Plain, VT $0 $3,378 $0 $0 $4,545 $7,923<br />
Ambrose, ND $0 $6,430 $0 $0 $0 $6,430<br />
117
Table B-6: Initial Costs for RE Technologies by Site<br />
(without incentives)<br />
Wind Initial<br />
Cost ($)<br />
Solar<br />
Vent<br />
Preheat<br />
Cost ($)<br />
Solar<br />
Water<br />
Heating<br />
Cost ($)<br />
Biomass<br />
Gasifier<br />
Cost ($)<br />
Daylighting<br />
Cost ($)<br />
Total Initial<br />
Cost ($)<br />
St. John ND $0 $5,563 $0 $0 $0 $5,563<br />
Jamieson, NY $0 $1,823 $1,721 $0 $1,552 $5,097<br />
St. Francis, ME $0 $2,012 $2,184 $0 $0 $4,196<br />
St. Francis, ME $0 $901 $2,641 $0 $0 $3,542<br />
RR Inspection, TX $0 $0 $450 $0 $2,760 $3,210<br />
Highgate Springs 1, VT $1,911 $0 $0 $0 $0 $1,911<br />
Amb. Bridge, MI $0 $0 $0 $0 $0 $0<br />
Intl Bridge, MI $0 $0 $0 $0 $0 $0<br />
Oroville, WA $0 $0 $0 $0 $0 $0<br />
Rooseville, MT $0 $0 $0 $0 $0 $0<br />
Sumas, WA $0 $0 $0 $0 $0 $0<br />
San Luis AZ (not built) $0 $0 $0 $0 $0 $0<br />
McAllen TX (not built) $0 $0 $0 $0 $0 $0<br />
Mataline Falls. WA $0 $0 $0 $0 $0 $0<br />
PV and solar industrial process heat technology were not cost effective at any<br />
LPOE site without incentives. Zero initial cost indicates that the technology was<br />
not cost effective at the site.<br />
Note that each technology is recommended as part of the optimized solution for a<br />
site, and these sizes minimize life-cycle costs. In other words, it is possible for<br />
an LPOE site to cost effectively generate more RE than the optimized solution<br />
indicates, but the life cycle costs would be higher.<br />
118
B.4 Life-Cycle Cost<br />
Life-cycle cost is calculated by adding initial cost to any annual costs discounted<br />
to their present value. Annual costs include maintenance, fuel (as in the case of<br />
biomass), standby charges from the utility, payments to the utility associated with<br />
the difference between retail and delivered power, any production incentives or<br />
other cash flows.<br />
LCC= C initial + (S energy – C O&M –C biomass fuel ) pwf 25 + (S prod incentive ) pwf prod incentive<br />
where<br />
• LCC= life-cycle cost<br />
• C initial = initial cost of renewable energy system<br />
• S energy = annual savings in electricity and natural gas purchased from utility<br />
• C O&M = annual cost of operating and maintaining renewable energy<br />
systems<br />
• C biomass fuel = annual cost of delivering biomass fuel to the site<br />
• pwf 25 = present worth factor for future savings stream for 25 year lifetime<br />
and 3 percent real discount rate (specified by NIST for 2008) [ref. 2].<br />
• S prod incentive =annual revenue from production incentive<br />
• pwf prod incentive = present worth factor associated with the term of the<br />
production incentive<br />
Simple payback period is not a good criterion because it does not include the<br />
analysis period or term of production incentives, but it is a useful indicator and is<br />
given by the equation<br />
SPB = C / S<br />
General O&M costs are escalated at the general inflation rate and annual costs<br />
for fuels and electricity are inflated according to census region and fuel type. All<br />
annual costs are discounted according to discount rate. The factors are provided<br />
in Table B-7 [ref. 2].<br />
Table B-7: Economic Parameters Used in Life-Cycle Cost Calculations<br />
Discount Rate 4.6%<br />
General Inflation Rate 1.8%<br />
Corporate Tax Rate (for case with 35%<br />
incentives)<br />
Depreciation Schedule (for case<br />
with incentives)<br />
Year 1 2 3 4 5 6<br />
Fraction 0.200 0.320 0.192 0.115 0.115 0.058<br />
119
Table B-8: Fuel Escalation Rates Used in Life-Cycle Cost Calculations<br />
State AK AZ CA ID ME MI MN MT ND NM NY TX VT WA<br />
Fuel<br />
Escalation<br />
Rate<br />
Electric<br />
Escalation<br />
Rate<br />
1.66% 1.66% 1.66% 1.66% 1.72% 1.48% 1.48% 1.65% 1.48% 1.65% 1.72% 1.73% 1.72% 1.66%<br />
1.25% 1.25% 1.25% 1.25% 1.42% 1.79% 1.79% 1.25% 1.79% 1.25% 1.42% 1.75% 1.42% 1.25%<br />
Table B-9: Technology Sizes That Minimize Life-Cycle Cost by <strong>GSA</strong> Region*<br />
<strong>GSA</strong> Region<br />
Technology Size 1 2 5 7 8 9 10 Grand Total<br />
Average Daylighting<br />
non-Office<br />
Skylight/Floor Area 3.4% 3.6% 1.6% 5% 1.1% 4.2% 2.5% 3.5%<br />
Average Daylighting<br />
Office Skylight/Floor<br />
Area 3.1% 3.1% 1.4% 3.9% 1.1% 3.6% 2.3% 3.0%<br />
Wind Capacity (kW) 13 384 N/A 1,763 2 1,284 N/A 3,445 kW<br />
Solar Vent Preheat Area<br />
(ft 2 ) 11,053 40,413 13,544 5,391 11,884 4,282 19,326 105,893 ft 2<br />
Solar Water Heating<br />
Area (ft 2 ) 4,783 3,432 63 6,923 3,486 13,967 5,475 38,129 ft 2<br />
Biomass Gasifier<br />
(M Btu/h) 0.32 0.12 N/A 0.21 0.11 0.50 N/A 1.27 Mbtu/h<br />
Biomass Gasifier<br />
Cogen Size (kW) 34 13 N/A 23 12 55 N/A 137.0 kW<br />
* N/A means the RE technology could not be sized to yield a return on<br />
investment greater than the discount rate of the life-cycle analysis (4.6 percent).<br />
PV and solar industrial process heat were not cost effective at any LPOE site<br />
without incentives.<br />
Note that each technology is recommended as part of the optimized solution for a<br />
site, and these sizes minimize life-cycle costs. In other words, it is possible for<br />
an LPOE site to cost effectively generate more RE than the optimized solution<br />
indicates, but the life cycle costs would be higher.<br />
Table B-10 presents the life-cycle cost for the base case and RE solutions case<br />
at each LPOE. The base case of continuing to purchase electricity, gas, and<br />
coal has zero initial cost but high annual cost, while the RE solutions case has<br />
high initial cost but lower annual cost. Over a 25 year analysis period, the lifecycle<br />
cost of the RE case is slightly less in all LPOE sites.<br />
120
Table B-11 lists the size of each RE technology that minimizes life-cycle costs as<br />
part of the optimal RE solutions case. Table B-12 and B-13 show the detailed<br />
calculations of the optimal sizes for daylighting and wind energy. Table B-14<br />
shows the calculations for biomass gasification of dry waste. Table B-15 is a<br />
shortened version of Table B-14, showing only the LPOE sites with a simple<br />
payback period of 17 years or less. Table B-16 and B-17 show the detailed<br />
calculations of the optimal sizes for solar ventilation air preheating and solar<br />
water heating.<br />
Table B-18 presents the ROI for the RE solutions case by LPOE site, and Table<br />
B-19 aggregates the ROI by <strong>GSA</strong> Region.<br />
121
Table B-10: Life-Cycle Costs for RE Solutions Case, Base Case, and ROI (without incentives)<br />
Table B-10: Life-Cycle Costs for RE Solutions Case, Base Case, and ROI<br />
(without incentives)<br />
Name<br />
Renewable<br />
Energy<br />
Initial Cost<br />
($)<br />
RE Life-<br />
Cycle<br />
O&M<br />
Cost ($)<br />
RE Life-<br />
Cycle<br />
Biomass<br />
Fuel Cost<br />
($)<br />
RE Life-<br />
Cycle Gas<br />
Cost ($)<br />
RE Life-<br />
Cycle<br />
Electric Cost<br />
($)<br />
RE Case<br />
Life-Cycle<br />
Cost ($)<br />
Base Case<br />
Life-Cycle<br />
Cost ($)<br />
Return<br />
on<br />
invest<br />
ment<br />
(%)<br />
Oroville, WA $10,415 $0 $0 $0 $1,202,343 $1,201,469 $1,254,894 44.8%<br />
Fabens, TX $46,957 $1,450 $0 $140,046 $482,523 $640,297 $777,609 27.4%<br />
Sasabe, AZ $32,691 $1,103 $0 $111,157 $255,330 $377,290 $456,025 23.3%<br />
Columbus, NM $95,087 $2,610 $0 $148,653 $588,539 $799,531 $976,752 19.9%<br />
Tecate, CA $224,279 $166,489 $39,496 $329,205 $1,294,555 $1,963,062 $2,367,343 19.7%<br />
Santa Teresa, NM $88,330 $0 $0 $130,137 $2,251,019 $2,422,683 $2,593,983 19.4%<br />
Donna TX, not built $14,708 $0 $0 $28,669 $244,750 $280,294 $307,574 18.9%<br />
Paso Del Norte, TX $117,746 $0 $0 $266,206 $2,183,995 $2,496,897 $2,712,162 18.7%<br />
Baudette, MN $16,701 $465 $39 $18 $105,303 $120,794 $147,275 18.5%<br />
Ysleta, TX $259,146 $0 $0 $774,624 $2,779,835 $3,642,882 $4,089,669 18.0%<br />
Calexico, CA $627,943 $363,280 $103,995 $1,221,774 $4,057,221 $6,069,151 $7,063,869 18.0%<br />
Bridge of the<br />
Americas, TX<br />
$219,433 $0 $0 $1,613,870 $3,569,154 $5,081,708 $5,452,568 17.8%<br />
Calexico West, CA $162,695 $0 $0 $318,844 $6,377,768 $6,739,396 $7,013,550 17.7%<br />
Dalton Cache, AK $78,957 $1,131 $245 $489,290 $925,961 $1,399,128 $1,521,347 17.5%<br />
McAllen TX, not built $0 $0 $0 $28,669 $286,424 $307,574 $307,574 n/a<br />
Nogales, AZ $124,450 $0 $0 $348,569 $3,011,976 $3,391,983 $3,578,824 16.5%<br />
McAllen, TX $44,664 $0 $0 $30,418 $1,166,614 $1,223,880 $1,290,185 16.4%<br />
Lukeville, AZ $95,330 $3,546 $0 $295,053 $696,666 $1,029,003 $1,154,779 15.7%<br />
Juarez-Lincoln, TX $316,588 $0 $0 $409,333 $5,117,021 $5,711,558 $6,146,785 15.6%<br />
Eagle Pass, TX $127,361 $0 $0 $470,817 $1,160,808 $1,661,380 $1,835,503 15.6%<br />
Raymond, MT $56,749 $1,260 $440 $1,457,616 $675,156 $1,930,963 $1,997,355 15.2%<br />
Laredo TX $40,968 $0 $0 $29,362 $945,194 $1,000,052 $1,053,164 15.1%<br />
Los Indios, TX $163,432 $0 $0 $123,356 $2,600,711 $2,835,216 $3,046,057 15.1%<br />
Alburg, VT, joint<br />
owner<br />
$19,095 $235 $0 $170 $46,084 $64,251 $87,027 15.0%<br />
Rio Grande City, TX $52,686 $0 $0 $39,986 $1,425,134 $1,495,642 $1,562,354 14.9%<br />
Jamieson, NY $6,298 $144 $0 $16,620 $19,167 $38,897 $46,171 14.6%<br />
St. Francis, ME $6,517 $192 $0 $1,592 $36,031 $43,431 $50,393 14.4%<br />
Columbia, TX $543,397 $314,541 $119,654 $452,093 $1,446,565 $2,728,986 $3,318,599 14.1%<br />
Fort Hancock, TX $34,852 $1,797 $0 $99,217 $467,675 $580,607 $617,218 14.0%<br />
Nogales, AZ $108,132 $0 $0 $402,577 $4,011,091 $4,411,255 $4,534,344 14.0%<br />
Ambrose, ND $10,210 $0 $0 $68,023 $77,461 $142,785 $153,144 13.9%<br />
Noyes, MN $32,457 $0 $0 $145,099 $250,047 $398,807 $431,149 13.8%<br />
Skagway, AK $59,255 $1,742 $245 $366,140 $534,367 $890,982 $950,179 13.7%<br />
Convent, TX $62,574 $0 $0 $116,108 $2,064,851 $2,202,026 $2,265,586 13.1%<br />
122
Table B-10: Life-Cycle Costs for RE Solutions Case, Base Case, and ROI<br />
(without incentives)<br />
Name<br />
Renewable<br />
Energy<br />
Initial Cost<br />
($)<br />
RE Life-<br />
Cycle<br />
O&M<br />
Cost ($)<br />
RE Life-<br />
Cycle<br />
Biomass<br />
Fuel Cost<br />
($)<br />
RE Life-<br />
Cycle Gas<br />
Cost ($)<br />
RE Life-<br />
Cycle<br />
Electric Cost<br />
($)<br />
RE Case<br />
Life-Cycle<br />
Cost ($)<br />
Base Case<br />
Life-Cycle<br />
Cost ($)<br />
Return<br />
on<br />
invest<br />
ment<br />
(%)<br />
Laurier, WA $31,892 $310 $0 $359 $54,226 $84,751 $115,171 13.1%<br />
Sweetgrass, MT $225,652 $164,473 $39,981 $362 $524,075 $926,893 $1,131,193 13.0%<br />
Otay Mesa, CA $1,000,242 $60,560 $0 $1,206,212 $5,609,206 $7,571,426 $8,525,158 12.7%<br />
Fort Kent, ME $112,520 $161,396 $39,771 $175,759 $112,459 $553,009 $649,941 12.6%<br />
Orient, ME $19,355 $232 $0 $6,344 $53,666 $77,119 $94,455 12.6%<br />
San Ysidro, CA $1,039,517 $102,378 $0 $2,520,953 $7,293,202 $10,407,761 $11,365,375 12.4%<br />
Beebe Plain, VT $10,345 $0 $0 $49,698 $78,016 $128,300 $137,465 12.4%<br />
Ogdensburg NY $377,470 $0 $0 $423,030 $1,538,422 $2,234,485 $2,569,924 12.3%<br />
Eastport, ID $57,326 $0 $0 $67,158 $384,676 $491,441 $538,000 12.3%<br />
St. John ND $9,675 $0 $0 $50,667 $98,880 $149,141 $156,946 12.2%<br />
Derby Line, VT $102,253 $1,290 $0 $160,242 $224,594 $453,948 $535,282 11.9%<br />
Fort Fairfield, ME $30,203 $685 $0 $120,981 $182,341 $310,294 $334,467 11.8%<br />
Limestone, ME $24,553 $650 $0 $89,362 $118,874 $215,812 $235,286 11.8%<br />
East Richford, VT $27,681 $0 $0 $60,209 $160,275 $235,045 $257,160 11.8%<br />
Ferry Point, ME $73,078 $1,336 $0 $34,826 $703,513 $797,020 $850,481 11.6%<br />
Jackman, ME $32,959 $0 $0 $17,056 $270,810 $313,910 $337,700 11.5%<br />
Roma, TX $85,057 $3,315 $0 $3,903 $1,447,274 $1,521,923 $1,587,054 11.5%<br />
Pembina, ND $137,934 $0 $0 $1,532,384 $1,838,664 $3,221,645 $3,320,512 11.5%<br />
Porthill, ID $24,445 $531 $0 $3,916 $108,281 $134,387 $151,440 11.3%<br />
San Luis, AZ $289,853 $248,428 $70,273 $340,985 $1,409,058 $2,253,582 $2,452,837 11.2%<br />
DOT, TX, leased $189,091 $7,576 $0 $473,885 $1,174,698 $1,744,160 $1,878,746 11.2%<br />
Madawaska, ME $42,018 $816 $0 $156,770 $341,295 $508,829 $538,666 11.1%<br />
Norton, VT $26,317 $0 $0 $159,794 $270,974 $425,853 $444,738 11.1%<br />
Alcan, AK $403,956 $20,667 $245 $3,925,689 $1,390,247 $5,032,271 $5,302,416 11.1%<br />
Derby Line, VT $34,673 $0 $0 $413,343 $481,346 $852,106 $876,501 11.1%<br />
Del Rio, TX $288,329 $12,463 $0 $604,546 $2,221,514 $2,989,214 $3,192,497 11.0%<br />
VanBuren, ME $36,550 $700 $0 $105,008 $208,585 $329,151 $352,943 10.9%<br />
Vanceboro, ME $48,446 $1,000 $0 $161,326 $234,147 $412,727 $445,136 10.9%<br />
Beecher Falls, VT $41,812 $1,019 $0 $74,064 $250,919 $350,836 $378,661 10.8%<br />
Highgate Springs 3,<br />
VT<br />
$12,905 $0 $0 $86,643 $95,113 $178,256 $186,327 10.3%<br />
Coburn Gore, ME $140,181 $146,654 $33,649 $227,588 $54,958 $546,031 $627,043 10.3%<br />
Grand Portage, MN $73,841 $0 $0 $271,835 $392,215 $684,020 $726,801 10.2%<br />
Houlton, ME $174,282 $147,476 $35,297 $171,395 $824,960 $1,297,218 $1,392,579 10.2%<br />
Progreso, TX $81,634 $3,752 $0 $215,112 $523,709 $778,603 $826,572 10.2%<br />
St. Francis, ME $3,825 $217 $0 $13,575 $42,174 $56,893 $58,984 10.1%<br />
Richford, VT $36,618 $870 $0 $82,211 $206,162 $308,121 $329,003 10.0%<br />
123
Table B-10: Life-Cycle Costs for RE Solutions Case, Base Case, and ROI<br />
(without incentives)<br />
Name<br />
Renewable<br />
Energy<br />
Initial Cost<br />
($)<br />
RE Life-<br />
Cycle<br />
O&M<br />
Cost ($)<br />
RE Life-<br />
Cycle<br />
Biomass<br />
Fuel Cost<br />
($)<br />
RE Life-<br />
Cycle Gas<br />
Cost ($)<br />
RE Life-<br />
Cycle<br />
Electric Cost<br />
($)<br />
RE Case<br />
Life-Cycle<br />
Cost ($)<br />
Base Case<br />
Life-Cycle<br />
Cost ($)<br />
Return<br />
on<br />
invest<br />
ment<br />
(%)<br />
Naco, AZ $70,556 $2,317 $0 $36,533 $561,820 $656,596 $697,006 10.0%<br />
Chateaugay, NY $28,841 $1,215 $0 $95,287 $186,674 $292,562 $307,451 9.8%<br />
Canaan, VT $24,276 $717 $0 $59,702 $176,414 $248,095 $261,045 9.7%<br />
Trout, River, NY $55,944 $1,255 $0 $78,526 $254,170 $371,460 $400,914 9.7%<br />
Niagra Falls, NY $1,383,426 $209,751 $42,494 $119,939 $1,378,087 $3,023,102 $3,746,085 9.6%<br />
Los Tomates, TX $1,131,309 $39,812 $0 $50,900 $2,041,062 $3,183,399 $3,791,946 9.5%<br />
St John Hwy, NY $70,551 $2,329 $0 $166,705 $142,933 $349,193 $383,476 9.5%<br />
Dunseith, ND $19,012 $0 $0 $33,922 $178,014 $222,609 $231,773 9.5%<br />
Douglas, AZ $220,785 $6,932 $0 $77,745 $1,655,824 $1,922,732 $2,033,183 9.4%<br />
RR Inspection, TX $2,760 $0 $0 $5,585 $5,762 $12,963 $14,416 9.4%<br />
Alburg Springs, VT $15,417 $434 $0 $54,162 $75,890 $135,159 $142,793 9.4%<br />
Fort Covington, NY $31,915 $990 $0 $67,929 $214,552 $300,255 $315,542 9.3%<br />
Andrade, CA $174,114 $5,086 $0 $176,370 $299,457 $613,811 $697,785 9.2%<br />
Gateway, TX $811,736 $27,069 $0 $59,433 $1,756,133 $2,590,613 $2,984,200 9.1%<br />
Massena, NY $109,903 $4,209 $0 $27,521 $439,608 $567,438 $615,736 9.1%<br />
Detroit Cargo, MI $77,868 $0 $0 $1,422,562 $2,572,481 $3,800,734 $3,839,007 9.1%<br />
Champlain, NY $415,889 $0 $0 $4,149,002 $9,021,117 $12,769,725 $12,963,556 9.1%<br />
West Berkshire,VT $32,551 $622 $0 $43,333 $136,805 $203,090 $217,239 8.9%<br />
Piegan, MT $137,642 $0 $0 $1,001,213 $542,764 $1,497,580 $1,557,310 8.8%<br />
Mooers, NY $28,052 $825 $0 $56,037 $152,735 $225,304 $236,566 8.6%<br />
Rouses Pt. NY $55,590 $1,544 $0 $165,992 $229,484 $419,324 $441,563 8.6%<br />
Kenneth Ward, WA $26,495 $0 $0 $131,221 $387,562 $517,919 $529,039 8.6%<br />
Highgate Springs 2,<br />
VT<br />
$107,349 $0 $0 $1,844,877 $1,479,443 $3,095,076 $3,137,323 8.5%<br />
Blaine, WA $188,460 $1,533 $0 $152,579 $671,314 $972,738 $1,040,623 8.3%<br />
Turner, MT $31,218 $256 $0 $0 $19,439 $49,283 $59,614 8.0%<br />
Blaine, WA $162,654 $0 $0 $180,098 $3,427,536 $3,700,823 $3,755,228 7.9%<br />
Point Robert, WA $176,860 $1,334 $0 $40,194 $413,220 $612,709 $667,543 7.9%<br />
Danville, WA $41,203 $0 $0 $15,813 $152,322 $203,316 $216,147 7.8%<br />
Blaine, WA $119,368 $0 $0 $64,493 $497,621 $660,308 $695,963 7.8%<br />
Brownsville TX $466,410 $13,212 $0 $62,723 $779,817 $1,282,641 $1,428,943 7.7%<br />
Alexandria Bay, NY $674,659 $16,969 $0 $56,798 $2,055,652 $2,744,416 $2,953,875 7.7%<br />
Roseau, MN $104,341 $0 $0 $195,362 $534,963 $791,280 $817,759 7.4%<br />
Kika de la Garza, TX $1,054,667 $35,212 $0 $173,590 $2,841,094 $4,000,071 $4,290,611 7.4%<br />
North Troy VT $24,896 $483 $0 $92,283 $3,894 $104,441 $110,418 7.2%<br />
Milltown ME $7,955 $378 $0 $15,014 $153,039 $172,052 $173,937 7.2%<br />
Marfa, TX $315,565 $6,640 $0 $111,241 $205,051 $602,769 $670,371 6.9%<br />
124
Table B-10: Life-Cycle Costs for RE Solutions Case, Base Case, and ROI<br />
(without incentives)<br />
Name<br />
Renewable<br />
Energy<br />
Initial Cost<br />
($)<br />
RE Life-<br />
Cycle<br />
O&M<br />
Cost ($)<br />
RE Life-<br />
Cycle<br />
Biomass<br />
Fuel Cost<br />
($)<br />
RE Life-<br />
Cycle Gas<br />
Cost ($)<br />
RE Life-<br />
Cycle<br />
Electric Cost<br />
($)<br />
RE Case<br />
Life-Cycle<br />
Cost ($)<br />
Base Case<br />
Life-Cycle<br />
Cost ($)<br />
Return<br />
on<br />
invest<br />
ment<br />
(%)<br />
Portal, ND $25,714 $0 $0 $73,680 $335,561 $418,026 $421,940 6.4%<br />
Intl Falls, MN $17,592 $0 $0 $87,388 $216,376 $303,514 $305,496 6.0%<br />
Chief Mt, MT $16,780 $0 $0 $469,955 $742,171 $1,140,375 $1,140,633 5.1%<br />
Highgate Springs 1,<br />
VT<br />
$1,911 $23 $0 $2,181 $3,871 $7,486 $6,193 -4.2%<br />
The following ten LPOE sites did not have cost-effective applications of RE<br />
technologies:<br />
• San Luis AZ (not built);<br />
• Amb. Bridge, MI;<br />
• Intl Bridge, MI;<br />
• Rooseville, MT;<br />
• Admin, TX (leased);<br />
• El Paso, TX (out leased);<br />
• McAllen TX (not built);<br />
• Highgate Springs 1, VT;<br />
• Mataline Falls. WA;<br />
• Sumas, WA.<br />
125
Table B-11: RE Solutions that Minimize Life-Cycle Cost (without incentives)<br />
Table B-11: RE Solutions that Minimize Life-Cycle Cost<br />
(without incentives)<br />
Wind<br />
Capacity<br />
(kW)<br />
Solar<br />
Vent<br />
Preheat<br />
Area<br />
(ft 2 )<br />
Solar<br />
Water<br />
Heating<br />
Area<br />
(ft 2 )<br />
Biomass<br />
Gasifier<br />
Size (M<br />
Btu/h)<br />
Biomass<br />
Gasifier<br />
Cogen<br />
Size<br />
(kW)<br />
Daylighting<br />
non-Office<br />
Skylight/Floor<br />
Area Ratio<br />
Daylighting<br />
Office<br />
Skylight/Floor<br />
Area Ratio<br />
Dalton Cache, AK 0 1,275 189 0.00 0 4.2% 4.5%<br />
Alcan, AK 0 4,220 3,452 0.00 0 0.0% 0.0%<br />
Skagway, AK 0 813 291 0.00 0 4.3% 4.4%<br />
Lukeville, AZ 0 2,380 592 0.00 0 4.6% 4.2%<br />
Nogales, AZ 0 0 0 0.00 0 4.5% 3.5%<br />
Sasabe, AZ 0 1,035 184 0.00 0 4.5% 4.3%<br />
Douglas, AZ 0 1,623 1,158 0.00 0 4.5% 3.6%<br />
San Luis, AZ 0 0 1,445 0.17 17 4.7% 3.8%<br />
Naco, AZ 0 358 387 0.00 0 4.5% 4.1%<br />
San Luis AZ (not built<br />
yet)<br />
0 0 0 0.00 0 0.0% 0.0%<br />
Nogales, AZ 0 0 0 0.00 0 4.5% 3.3%<br />
Calexico West, CA 0 0 0 0.00 0 4.5% 3.7%<br />
San Ysidro, CA 790 0 0 0.00 0 4.5% 3.8%<br />
Andrade, CA 27 97 275 0.00 0 4.6% 4.4%<br />
Otay Mesa, CA 467 0 0 0.00 0 4.7% 3.9%<br />
Tecate, CA 0 0 1,028 0.12 12 4.6% 4.1%<br />
Calexico, CA 0 0 3,062 0.25 24 4.6% 2.9%<br />
Eastport, ID 0 1,592 0 0.00 0 0.0% 0.0%<br />
Porthill, ID 0 499 89 0.00 0 0.0% 0.0%<br />
Ferry Point, ME 0 1,577 223 0.00 0 0.0% 0.0%<br />
Coburn Gore, ME 0 269 556 0.10 11 4.6% 4.3%<br />
Fort Fairfield, ME 0 377 114 0.00 0 4.5% 4.4%<br />
Houlton, ME 0 2,832 0 0.11 11 0.0% 0.0%<br />
Jackman, ME 0 916 0 0.00 0 0.0% 0.0%<br />
Limestone, ME 0 286 109 0.00 0 4.5% 4.4%<br />
Orient, ME 0 277 39 0.00 0 4.5% 4.4%<br />
Vanceboro, ME 0 733 167 0.00 0 4.5% 4.3%<br />
VanBuren, ME 0 778 117 0.00 0 0.0% 0.0%<br />
Milltown ME 0 50 63 0.00 0 4.5% 4.5%<br />
St. Francis, ME 0 116 32 0.00 0 0.0% 0.0%<br />
Madawaska, ME 0 548 136 0.00 0 4.5% 4.3%<br />
Fort Kent, ME 0 582 0 0.11 12 4.5% 4.2%<br />
St. Francis, ME 0 33 36 0.00 0 0.0% 0.0%<br />
Detroit Cargo, MI 0 0 0 0.00 0 4.5% 3.0%<br />
126
Table B-11: RE Solutions that Minimize Life-Cycle Cost<br />
(without incentives)<br />
Wind<br />
Capacity<br />
(kW)<br />
Solar<br />
Vent<br />
Preheat<br />
Area<br />
(ft 2 )<br />
Solar<br />
Water<br />
Heating<br />
Area<br />
(ft 2 )<br />
Biomass<br />
Gasifier<br />
Size (M<br />
Btu/h)<br />
Biomass<br />
Gasifier<br />
Cogen<br />
Size<br />
(kW)<br />
Daylighting<br />
non-Office<br />
Skylight/Floor<br />
Area Ratio<br />
Daylighting<br />
Office<br />
Skylight/Floor<br />
Area Ratio<br />
Intl Bridge, MI 0 0 0 0.00 0 0.0% 0.0%<br />
Amb. Bridge, MI 0 0 0 0.00 0 0.0% 0.0%<br />
Grand Portage, MN 0 1,541 0 0.00 0 4.5% 3.5%<br />
Noyes, MN 0 902 0 0.00 0 0.0% 0.0%<br />
Roseau, MN 0 2,898 0 0.00 0 0.0% 0.0%<br />
Intl Falls, MN 0 489 0 0.00 0 0.0% 0.0%<br />
Baudette, MN 0 342 59 0.00 0 0.0% 0.0%<br />
Chief Mt, MT 0 466 0 0.00 0 0.0% 0.0%<br />
Piegan, MT 0 1,307 0 0.00 0 2.7% 3.0%<br />
Raymond, MT 0 1,555 0 0.00 0 0.0% 0.0%<br />
Rooseville, MT 0 0 0 0.00 0 0.0% 0.0%<br />
Sweetgrass, MT 0 1,261 547 0.11 12 4.5% 4.5%<br />
Turner, MT 2 161 10 0.00 0 4.4% 4.2%<br />
Ambrose, ND 0 284 0 0.00 0 0.0% 0.0%<br />
Dunseith, ND 0 528 0 0.00 0 0.0% 0.0%<br />
Portal, ND 0 714 0 0.00 0 0.0% 0.0%<br />
St. John ND 0 269 0 0.00 0 0.0% 0.0%<br />
Pembina, ND 0 3,831 0 0.00 0 0.0% 0.0%<br />
Columbus, NM 0 880 436 0.00 0 4.9% 4.5%<br />
Santa Teresa, NM 0 0 0 0.00 0 5.4% 4.2%<br />
Alexandria Bay, NY 131 3,640 0 0.00 0 4.7% 3.6%<br />
Champlain, NY 0 6,739 0 0.00 0 5.4% 3.2%<br />
Massena, NY 0 1,627 703 0.00 0 0.0% 0.0%<br />
Fort Covington, NY 0 334 165 0.00 0 4.5% 4.2%<br />
Rouses Pt. NY 0 651 258 0.00 0 4.5% 4.0%<br />
St John Hwy, NY 0 1,171 389 0.00 0 0.0% 0.0%<br />
Trout, River, NY 0 730 210 0.00 0 4.5% 4.0%<br />
Chateaugay, NY 0 389 203 0.00 0 0.0% 0.0%<br />
Mooers, NY 0 300 138 0.00 0 4.5% 4.2%<br />
Jamieson, NY 0 111 24 0.00 0 4.9% 5.2%<br />
Niagra Falls, NY 148 8,444 2,592 0.13 13 3.8% 4.5%<br />
Ogdensburg NY 0 5,614 0 0.00 0 6.2% 4.5%<br />
Brownsville/Matamoros<br />
TX<br />
102 0 0 0.00 0 5.5% 4.5%<br />
Gateway, TX 209 0 0 0.00 0 5.6% 4.0%<br />
Columbia, TX 0 0 2,104 0.21 23 5.2% 4.4%<br />
127
Table B-11: RE Solutions that Minimize Life-Cycle Cost<br />
(without incentives)<br />
Wind<br />
Capacity<br />
(kW)<br />
Solar<br />
Vent<br />
Preheat<br />
Area<br />
(ft 2 )<br />
Solar<br />
Water<br />
Heating<br />
Area<br />
(ft 2 )<br />
Biomass<br />
Gasifier<br />
Size (M<br />
Btu/h)<br />
Biomass<br />
Gasifier<br />
Cogen<br />
Size<br />
(kW)<br />
Daylighting<br />
non-Office<br />
Skylight/Floor<br />
Area Ratio<br />
Daylighting<br />
Office<br />
Skylight/Floor<br />
Area Ratio<br />
Convent, TX 0 0 0 0.00 0 4.5% 3.2%<br />
Del Rio, TX 0 0 2,082 0.00 0 5.5% 3.6%<br />
Donna TX (not built) 0 0 0 0.00 0 4.9% 4.5%<br />
Bridge of the Americas,<br />
TX<br />
0 0 0 0.00 0 5.6% 3.2%<br />
Eagle Pass, TX 0 0 0 0.00 0 5.3% 3.9%<br />
Fabens, TX 0 376 242 0.00 0 5.0% 4.4%<br />
Fort Hancock, TX 0 160 300 0.00 0 4.6% 4.4%<br />
El Paso, TX (out leased) 0 0 0 0.00 0 0.0% 0.0%<br />
Juarez-Lincoln, TX 0 0 0 0.00 0 5.4% 3.3%<br />
Los Indios, TX 0 0 0 0.00 0 5.5% 3.9%<br />
Laredo TX 0 0 0 0.00 0 5.1% 4.4%<br />
Los Tomates, TX 307 0 0 0.00 0 5.7% 4.0%<br />
McAllen, TX 0 0 0 0.00 0 5.2% 4.2%<br />
McAllen TX (not built) 0 0 0 0.00 0 0.0% 0.0%<br />
Marfa, TX 36 2,292 337 0.00 0 4.3% 4.0%<br />
Kika de la Garza, TX 272 0 0 0.00 0 5.5% 4.0%<br />
Paso Del Norte, TX 0 0 0 0.00 0 5.6% 3.4%<br />
Progreso, TX 0 0 627 0.00 0 4.5% 3.6%<br />
Roma, TX 0 0 554 0.00 0 4.5% 3.3%<br />
Rio Grande City, TX 0 0 0 0.00 0 4.5% 3.2%<br />
Ysleta, TX 0 0 0 0.00 0 5.8% 3.4%<br />
RR Inspection, TX 0 0 0 0.00 0 4.5% 4.5%<br />
Admin, TX (leased) 0 0 0 0.00 0 0.0% 0.0%<br />
El Paso, TX (Leased) 0 0 0 0.00 0 0.0% 0.0%<br />
DOT, TX (leased) 0 661 1,266 0.00 0 4.5% 3.0%<br />
Derby Line, VT 0 575 0 0.00 0 4.5% 3.7%<br />
Norton, VT 0 392 0 0.00 0 4.5% 5.1%<br />
Beebe Plain, VT 0 161 0 0.00 0 4.5% 4.2%<br />
Alburg Springs, VT 0 145 72 0.00 0 4.6% 4.3%<br />
North Troy VT 0 326 81 0.00 0 4.5% 3.7%<br />
West Berkshire,VT 0 412 104 0.00 0 4.5% 4.3%<br />
Derby Line, VT 0 1,735 216 0.00 0 4.7% 3.3%<br />
Beecher Falls, VT 0 483 170 0.00 0 4.5% 3.9%<br />
Canaan, VT 0 248 120 0.00 0 4.5% 4.3%<br />
East Richford, VT 0 471 0 0.00 0 4.5% 3.9%<br />
128
Table B-11: RE Solutions that Minimize Life-Cycle Cost<br />
(without incentives)<br />
Wind<br />
Capacity<br />
(kW)<br />
Solar<br />
Vent<br />
Preheat<br />
Area<br />
(ft 2 )<br />
Solar<br />
Water<br />
Heating<br />
Area<br />
(ft 2 )<br />
Biomass<br />
Gasifier<br />
Size (M<br />
Btu/h)<br />
Biomass<br />
Gasifier<br />
Cogen<br />
Size<br />
(kW)<br />
Daylighting<br />
non-Office<br />
Skylight/Floor<br />
Area Ratio<br />
Daylighting<br />
Office<br />
Skylight/Floor<br />
Area Ratio<br />
Richford, VT 0 438 145 0.00 0 4.5% 4.0%<br />
Alburg, VT (Joint<br />
ownership)<br />
0 261 34 0.00 0 4.2% 4.5%<br />
Highgate Springs 1, VT 0 0 0 0.00 0 0.0% 0.0%<br />
Highgate Springs 2, VT 0 2,087 0 0.00 0 4.4% 2.8%<br />
Highgate Springs 3, VT 0 199 0 0.00 0 4.4% 4.0%<br />
Blaine, WA 0 3,316 256 0.00 0 4.9% 4.2%<br />
Danville, WA 0 823 0 0.00 0 4.7% 4.1%<br />
Laurier, WA 0 406 52 0.00 0 4.6% 4.2%<br />
Mataline Falls. WA 0 0 0 0.00 0 0.0% 0.0%<br />
Oroville, WA 0 289 0 0.00 0 0.0% 0.0%<br />
Point Robert, WA 0 3,248 223 0.00 0 4.4% 4.1%<br />
Sumas, WA 0 0 0 0.00 0 0.0% 0.0%<br />
Blaine, WA 0 3,316 0 0.00 0 0.0% 0.0%<br />
Blaine, WA 0 0 0 0.00 0 5.7% 4.4%<br />
Kenneth Ward, WA 0 0 0 0.00 0 5.1% 4.8%<br />
*Size 0 means the RE technology could not be sized to yield a return on<br />
investment greater than the discount rate of the life-cycle analysis (4.6 percent).<br />
PV, Solar Thermal, and Solar Thermal Electric were not cost effective at any<br />
LPOE site without incentives.<br />
Note that each technology is recommended as part of the optimized solution for a<br />
site, and these sizes minimize life-cycle costs. In other words, it is possible for<br />
an LPOE site to cost effectively generate more RE than the optimized solution<br />
indicates, but the life cycle costs would be higher.<br />
129
Table B-12: Daylighting Calculations by Site<br />
Table B-12: Daylighting Calculations by Site<br />
LPOE Site Name<br />
Total Skylight<br />
Area (ft 2 )<br />
Daylighting<br />
Initial Cost<br />
($)<br />
Electricity<br />
Saved<br />
(kWh/yr)<br />
Natural Gas<br />
Saved<br />
(therms/yr)<br />
Utility<br />
Savings<br />
($/yr)<br />
Daylighting<br />
Payback<br />
Period (yrs)<br />
Dalton Cache, AK 621 $19,267 16403 (481.1) $4,976 4<br />
Alcan, AK 0 $1 2 (0.1) $0 32<br />
Skagway, AK 285 $8,757 7515 (220.4) $910 10<br />
Lukeville, AZ 1,582 $48,486 77340 (81.2) $7,624 6<br />
Nogales, AZ 3,761 $120,850 177176 (647.9) $18,514 7<br />
Sasabe, AZ 686 $21,024 33010 (37.9) $4,168 5<br />
Douglas, AZ 2,439 $77,813 112952 (683.8) $9,757 8<br />
San Luis, AZ 2,217 $69,113 105134 (163.7) $8,970 8<br />
Naco, AZ 945 $29,422 39698 (161.4) $3,589 8<br />
San Luis AZ (not built<br />
yet) 0 $0 1 0.0 $0 4<br />
Nogales, AZ 3,326 $108,131 161780 (581.1) $13,798 8<br />
Calexico West, CA 5,126 $162,694 221817 (573.8) $26,314 6<br />
San Ysidro, CA 8,588 $270,670 371949 (1,222.3) $46,464 6<br />
Andrade, CA 424 $12,947 20207 (23.0) $2,601 5<br />
Otay Mesa, CA 12,936 $405,135 552036 (1,805.0) $73,406 6<br />
Tecate, CA 2,230 $69,177 94695 (285.7) $11,548 6<br />
Calexico, CA 6,184 $206,908 322052 (663.8) $36,714 6<br />
Eastport, ID 0 $0 1 (0.0) $0 18<br />
Porthill, ID 0 $0 0 (0.0) $0 16<br />
Ferry Point, ME 0 $0 1 (0.0) $0 7<br />
Coburn Gore, ME 644 $19,673 27005 (435.4) $2,359 8<br />
Fort Fairfield, ME 269 $8,266 9225 (304.9) $1,093 8<br />
Houlton, ME 0 $1 1 (0.0) $0 11<br />
Jackman, ME 0 $0 1 (0.0) $0 11<br />
Limestone, ME 207 $6,331 7030 (233.9) $722 9<br />
Orient, ME 213 $6,542 7476 (235.8) $715 9<br />
Vanceboro, ME 321 $9,855 11362 (352.9) $952 10<br />
VanBuren, ME 0 $0 0 (0.0) $0 9<br />
Milltown ME 51 $1,560 1720 (57.8) $125 12<br />
St. Francis, ME 0 $0 0 (0.0) $0 27<br />
Madawaska, ME 402 $12,352 13870 (454.7) $1,227 10<br />
Fort Kent, ME 409 $12,691 14569 (463.5) $1,425 9<br />
St. Francis, ME 0 $0 0 (0.0) $0 26<br />
Detroit Cargo, MI 2,328 $77,868 97333 (1,720.9) $6,631 12<br />
Intl Bridge, MI 0 $0 0 (0.0) $0 42<br />
130
Table B-12: Daylighting Calculations by Site<br />
LPOE Site Name<br />
Total Skylight<br />
Area (ft 2 )<br />
Daylighting<br />
Initial Cost<br />
($)<br />
Electricity<br />
Saved<br />
(kWh/yr)<br />
Natural Gas<br />
Saved<br />
(therms/yr)<br />
Utility<br />
Savings<br />
($/yr)<br />
Daylighting<br />
Payback<br />
Period (yrs)<br />
Amb. Bridge, MI 0 $0 0 (0.0) $0 6<br />
Grand Portage, MN 576 $18,372 22521 (658.3) $1,211 15<br />
Noyes, MN 0 $0 0 (0.0) $0 21<br />
Roseau, MN 0 $0 0 (0.0) $0 14<br />
Intl Falls, MN 0 $0 0 (0.0) $0 14<br />
Baudette, MN 0 $0 0 (0.0) $0 10<br />
Chief Mt, MT 0 $0 0 (0.0) $0 13<br />
Piegan, MT 2,668 $90,607 118761 (2,124.9) $5,252 17<br />
Raymond, MT 0 $1 2 (0.0) $0 83<br />
Rooseville, MT 0 $1 1 (0.0) $0 12<br />
Sweetgrass, MT 1,900 $58,033 82780 (1,397.8) $4,220 14<br />
Turner, MT 327 $10,091 11854 (317.9) $639 16<br />
Ambrose, ND 0 $0 0 (0.0) $0 13<br />
Dunseith, ND 0 $0 1 (0.0) $0 16<br />
Portal, ND 0 $0 1 (0.0) $0 13<br />
St. John ND 0 $0 0 (0.0) $0 14<br />
Pembina, ND 0 $1 2 (0.0) $0 19<br />
Columbus, NM 1,049 $31,569 56981 (12.3) $6,655 5<br />
Santa Teresa, NM 2,959 $88,329 148080 (137.3) $15,696 6<br />
Alexandria Bay, NY 2,020 $64,198 79158 (1,906.5) $9,134 7<br />
Champlain, NY 5,530 $173,289 230050 (4,580.0) $18,682 9<br />
Massena, NY 0 $0 0 (0.0) $0 23<br />
Fort Covington, NY 253 $7,812 8885 (243.9) $636 12<br />
Rouses Pt. NY 427 $13,318 15378 (381.8) $943 14<br />
St John Hwy, NY 0 $0 1 (0.0) 0 (126)<br />
Trout, River, NY 460 $14,368 16719 (444.5) $1,225 12<br />
Chateaugay, NY 0 $0 0 (0.0) $0 11<br />
Mooers, NY 233 $7,202 8130 (208.4) $426 17<br />
Jamieson, NY 52 $1,552 2269 (21.8) $326 5<br />
Niagra Falls, NY 8,295 $262,393 370412 (4,083.1) $31,373 8<br />
Ogdensburg BS 6,042 $175,361 233201 (4,019.4) $29,248 6<br />
Brownsville TX 2,444 $72,198 116515 (1.2) $11,050 7<br />
Gateway, TX 4,051 $121,059 183631 (58.5) $18,054 7<br />
Columbia, TX 8,465 $252,593 415211 (9.3) $42,024 6<br />
Convent, TX 1,907 $62,573 86824 (194.1) $7,546 8<br />
Del Rio, TX 4,535 $136,352 212817 (169.0) $20,363 7<br />
131
Table B-12: Daylighting Calculations by Site<br />
LPOE Site Name<br />
Total Skylight<br />
Area (ft 2 )<br />
Daylighting<br />
Initial Cost<br />
($)<br />
Electricity<br />
Saved<br />
(kWh/yr)<br />
Natural Gas<br />
Saved<br />
(therms/yr)<br />
Utility<br />
Savings<br />
($/yr)<br />
Daylighting<br />
Payback<br />
Period (yrs)<br />
Donna TX, not built yet 488 $14,708 25175 0.0 $2,541 6<br />
Bridge of the Americas,<br />
TX 7,224 $219,433 364532 (559.2) $35,605 6<br />
Eagle Pass, TX 4,253 $127,361 203476 (108.1) $18,159 7<br />
Fabens, TX 520 $15,729 25962 (45.7) $4,249 4<br />
Fort Hancock, TX 235 $7,170 11582 (29.3) $1,255 6<br />
El Paso, TX, leased 0 $0 1 0.0 $0 4<br />
Juarez-Lincoln, TX 10,514 $316,588 500384 (166.0) $45,314 7<br />
Los Indios, TX 5,476 $163,432 255677 (52.6) $22,548 7<br />
Laredo TX 1,359 $40,968 61454 (43.6) $5,662 7<br />
Los Tomates, TX 6,663 $197,511 303904 (57.6) $28,330 7<br />
McAllen, TX 1,484 $44,664 69065 (23.4) $6,691 7<br />
McAllen TX, not built yet 0 $0 1 0.0 $0 4<br />
Marfa, TX 1,131 $34,951 61123 (103.1) $5,425 6<br />
Kika de la Garza, TX 6,933 $206,342 325365 (50.7) $34,153 6<br />
Paso Del Norte, TX 3,828 $117,745 190004 (480.2) $20,078 6<br />
Progreso, TX 1,122 $35,880 47022 (70.8) $3,922 9<br />
Roma, TX 1,373 $44,628 60955 (86.6) $5,225 9<br />
Rio Grande City, TX 1,611 $52,686 72818 (101.7) $7,169 7<br />
Ysleta, TX 8,706 $259,146 427700 (378.4) $42,632 6<br />
RR Inspection, TX 90 $2,760 3184 (9.2) $336 8<br />
Admin, TX (leased) 0 $0 0 (0.0) $0 5<br />
El Paso, TX, Leased 0 $0 0 (0.0) $0 4<br />
DOT, TX, leased 2,186 $72,904 106635 (379.1) $9,210 8<br />
Derby Line, VT 441 $13,963 16687 (394.1) $1,126 12<br />
Norton, VT 408 $12,198 12491 (364.5) $1,081 11<br />
Beebe Plain, VT 147 $4,545 5173 (131.1) $540 8<br />
Alburg Springs, VT 159 $4,898 5689 (136.3) $523 9<br />
North Troy VT 230 $7,274 8693 (205.3) $1,471 5<br />
West Berkshire,VT 329 $10,148 11388 (294.3) $887 11<br />
Derby Line, VT 751 $24,057 30948 (623.4) $2,809 9<br />
Beecher Falls, VT 382 $11,985 14030 (341.7) $1,268 9<br />
Canaan, VT 215 $6,615 7423 (191.9) $635 10<br />
East Richford, VT 341 $10,725 12593 (305.4) $1,190 9<br />
Richford, VT 328 $10,231 11838 (293.1) $1,099 9<br />
Alburg, VT, joint owner 152 $4,730 6838 (90.6) $570 8<br />
132
Table B-12: Daylighting Calculations by Site<br />
LPOE Site Name<br />
Total Skylight<br />
Area (ft 2 )<br />
Daylighting<br />
Initial Cost<br />
($)<br />
Electricity<br />
Saved<br />
(kWh/yr)<br />
Natural Gas<br />
Saved<br />
(therms/yr)<br />
Utility<br />
Savings<br />
($/yr)<br />
Daylighting<br />
Payback<br />
Period (yrs)<br />
Highgate Springs 1, VT 0 $0 0 (0.0) $0 9<br />
Highgate Springs 2, VT 951 $32,210 41113 (850.1) $2,211 15<br />
Highgate Springs 3, VT 184 $5,751 6644 (164.9) $592 10<br />
Blaine, WA 1,676 $50,389 59755 (635.4) $3,053 17<br />
Danville, WA 382 $11,590 16521 (190.7) $945 12<br />
Laurier, WA 443 $13,512 19317 (221.5) $1,350 10<br />
Mataline Falls. WA 0 $0 0 (0.0) $0 24<br />
Oroville, WA 0 $2 3 (0.0) 0 (16)<br />
Point Robert, WA 1,422 $43,680 62869 (710.4) $2,613 17<br />
Sumas, WA 0 $1 1 (0.0) $0 13<br />
Blaine, WA 0 $1 1 (0.0) $0 16<br />
Blaine, WA 5,542 $162,654 190793 (2,100.8) $12,501 13<br />
Kenneth Ward, WA 886 $26,495 31399 (335.9) $2,180 12<br />
Total $846,453.00<br />
Therms/yr in red and in paratheses (xx.x) indicate additional natural gas will need<br />
to be purchased/consumed at some locations to compensate for heat loss<br />
through skylights. This extra cost was included in the Utility Savings and<br />
Daylighting Payback Period calculations.<br />
Note that each technology is recommended as part of the optimized solution for a<br />
site, and these sizes minimize life-cycle costs. In other words, it is possible for<br />
an LPOE site to cost effectively generate more RE than the optimized solution<br />
indicates, but the life cycle costs would be higher.<br />
133
Table B-13: Wind Energy Calculations by Site<br />
Table B-13: Wind Energy Calculations by Site<br />
LPOE Site Name<br />
Wind<br />
Capacity<br />
(kW)<br />
Wind Initial<br />
Cost ($)<br />
Wind<br />
Rebate ($)<br />
Wind Net<br />
Metering up<br />
to (kW)<br />
Wind Annual<br />
Energy<br />
Delivery<br />
(kWh/yr)<br />
Wind Annual<br />
Cost Savings<br />
($)<br />
Wind<br />
Annual<br />
O&M Cost<br />
($/yr)<br />
Wind<br />
Payback<br />
Period<br />
(yrs)<br />
Dalton Cache, AK 0 $0 0 $0 $0 0 0 $0<br />
Alcan, AK 0 $0 $0 0 0 $0 $0 182<br />
Skagway, AK 0 $0 $0 0 0 $0 $0 143<br />
Lukeville, AZ 0 $0 $0 100 0 $0 $0 166<br />
Nogales, AZ 0 $0 $0 100 0 $0 $0 98<br />
Sasabe, AZ 0 $0 $0 0 0 $0 $0 88<br />
Douglas, AZ 0 $0 $0 100 0 $0 $0 104<br />
San Luis, AZ 0 $0 $0 100 0 $0 $0 177<br />
Naco, AZ 0 $0 $0 100 0 $0 $0 109<br />
San Luis AZ (not built yet) 0 $0 $0 100 0 $0 $0 154<br />
Nogales, AZ 0 $0 $0 0 0 $0 $0 178<br />
Calexico West, CA 0 0 $0 $0 0 0 $0 $0<br />
San Ysidro, CA 790 $1,954,078 $1,185,232 1,000 802,390 $103,006 $6,242 8<br />
Andrade, CA 27 $137,582 $0 0 76,326 $10,051 $210 14<br />
Otay Mesa, CA 467 $1,296,214 $701,107 1,000 420,706 $57,579 $3,692 11<br />
Tecate, CA 0 $0 $0 1,000 0 $0 $0 84<br />
Calexico, CA 0 $0 $0 0 0 $0 $0 92<br />
Eastport, ID 0 $0 $0 0 0 $0 $0 1,545<br />
Porthill, ID 0 $0 $0 0 0 $0 $0 287<br />
Ferry Point, ME 0 $0 $0 0 0 $0 $0 78<br />
Coburn Gore, ME 0 $0 $0 0 0 $0 $0 87<br />
Fort Fairfield, ME 0 $0 $0 0 0 $0 $0 31<br />
Houlton, ME 0 $0 $0 0 0 $0 $0 64<br />
Jackman, ME 0 $0 $0 0 0 $0 $0 109<br />
Limestone, ME 0 $0 $0 0 0 $0 $0 28<br />
Orient, ME 0 $0 $0 0 0 $0 $0 54<br />
Vanceboro, ME 0 $0 $0 0 0 $0 $0 56<br />
VanBuren, ME 0 $0 $0 0 0 $0 $0 137<br />
Milltown ME 0 $0 $0 0 0 $0 $0 76<br />
St. Francis, ME 0 $0 $0 0 0 $0 $0 62<br />
Madawaska, ME 0 $0 $0 0 0 $0 $0 96<br />
Fort Kent, ME 0 $0 $0 0 0 $0 $0 97<br />
St. Francis, ME 0 $0 $0 0 0 $0 $0 176<br />
Detroit Cargo, MI 0 $0 $0 0 0 $0 $0 92<br />
Intl Bridge, MI 0 $0 $0 0 0 $0 $0 0<br />
Amb. Bridge, MI 0 $0 0 $0 $0 0 0 $0<br />
Grand Portage, MN 0 $0 $0 0 0 $0 $0 43<br />
134
Table B-13: Wind Energy Calculations by Site<br />
LPOE Site Name<br />
Wind<br />
Capacity<br />
(kW)<br />
Wind Initial<br />
Cost ($)<br />
Wind<br />
Rebate ($)<br />
Wind Net<br />
Metering up<br />
to (kW)<br />
Wind Annual<br />
Energy<br />
Delivery<br />
(kWh/yr)<br />
Wind Annual<br />
Cost Savings<br />
($)<br />
Wind<br />
Annual<br />
O&M Cost<br />
($/yr)<br />
Wind<br />
Payback<br />
Period<br />
(yrs)<br />
Noyes, MN 0 $0 $0 0 0 $0 $0 41<br />
Roseau, MN 0 $0 $0 0 0 $0 $0 63<br />
Intl Falls, MN 0 $0 $0 0 0 $0 $0 79<br />
Baudette, MN 0 $0 $0 0 0 $0 $0 48<br />
Chief Mt, MT 0 $0 $0 0 0 $0 $0 65<br />
Piegan, MT 0 $0 $0 0 0 $0 $0 62<br />
Raymond, MT 0 $0 $0 0 0 $0 $0 86<br />
Rooseville, MT 0 $0 $0 0 0 $0 $0 77<br />
Sweetgrass, MT 0 $0 $0 0 0 $0 $0 33<br />
Turner, MT 2 $14,561 $0 0 4,754 $940 $12 16<br />
Ambrose, ND 0 $0 $0 0 0 $0 $0 39<br />
Dunseith, ND 0 $0 $0 0 0 $0 $0 80<br />
Portal, ND 0 $0 $0 0 0 $0 $0 53<br />
St. John ND 0 $0 $0 0 0 $0 $0 35<br />
Pembina, ND 0 $0 $0 0 0 $0 $0 70<br />
Columbus, NM 0 $0 $0 0 0 $0 $0 59<br />
Santa Teresa, NM 0 $0 $0 0 0 $0 $0 74<br />
Alexandria Bay, NY 131 $479,418 $0 0 251,889 $37,724 $1,035 13<br />
Champlain, NY 0 $0 $0 0 0 $0 $0 54<br />
Massena, NY 0 $0 $0 0 0 $0 $0 102<br />
Fort Covington, NY 0 $0 $0 0 0 $0 $0 41<br />
Rouses Pt. NY 0 $0 $0 0 0 $0 $0 128<br />
St John Hwy, NY 0 $0 $0 0 0 $0 $0 406<br />
Trout, River, NY 0 $0 $0 0 0 $0 $0 43<br />
Chateaugay, NY 0 $1 $0 0 0 $0 $0 na<br />
Mooers, NY 0 $0 $0 0 0 $0 $0 133<br />
Jamieson, NY 0 $0 $0 10 0 $0 $0 35<br />
Niagra Falls, NY 148 $527,588 $0 0 284,705 $35,623 $1,169 15<br />
Ogdensburg, NY 0 $0 $0 0 0 $0 $0 na<br />
Brownsville/<br />
Matamoros, TX<br />
102 $394,213 $0 0 274,559 $26,042 $806 16<br />
Gateway, TX 209 $690,677 $0 0 562,539 $55,523 $1,650 13<br />
Columbia, TX 0 $0 $0 0 0 $0 $0 59<br />
Convent, TX 0 $0 $0 0 0 $0 $0 67<br />
Del Rio, TX 0 $0 $0 0 0 $0 $0 61<br />
Donna TX (not built yet) 0 $0 $0 0 0 $0 $0 59<br />
Bridge of the Americas,<br />
TX<br />
0 $0 $0 0 0 $0 $0 60<br />
135
Table B-13: Wind Energy Calculations by Site<br />
LPOE Site Name<br />
Wind<br />
Capacity<br />
(kW)<br />
Wind Initial<br />
Cost ($)<br />
Wind<br />
Rebate ($)<br />
Wind Net<br />
Metering up<br />
to (kW)<br />
Wind Annual<br />
Energy<br />
Delivery<br />
(kWh/yr)<br />
Wind Annual<br />
Cost Savings<br />
($)<br />
Wind<br />
Annual<br />
O&M Cost<br />
($/yr)<br />
Wind<br />
Payback<br />
Period<br />
(yrs)<br />
Eagle Pass, TX 0 $0 $0 0 0 $0 $0 67<br />
Fabens, TX 0 $0 $0 0 0 $0 $0 88<br />
Fort Hancock, TX 0 $0 $0 0 0 $0 $0 137<br />
El Paso, TX (out leased) 0 $0 $0 0 0 $0 $0 62<br />
Juarez-Lincoln, TX 0 $0 $0 0 0 $0 $0 66<br />
Los Indios, TX 0 $0 $0 0 0 $0 $0 68<br />
Laredo TX 0 $0 $0 0 0 $0 $0 64<br />
Los Tomates, TX 307 $933,797 $0 0 827,344 $77,571 $2,427 12<br />
McAllen, TX 0 $0 $0 0 0 $0 $0 61<br />
McAllen TX (not built yet) 0 $0 $0 0 0 $0 $0 59<br />
Marfa, TX 36 $173,533 $0 0 151,052 $13,771 $282 13<br />
Kika de la Garza, TX 272 $848,325 $0 0 522,675 $54,958 $2,147 16<br />
Paso Del Norte, TX 0 $0 $0 0 0 $0 $0 55<br />
Progreso, TX 0 $0 $0 0 0 $0 $0 69<br />
Roma, TX 0 $0 $0 0 0 $0 $0 67<br />
Rio Grande City, TX 0 $0 $0 0 0 $0 $0 59<br />
Ysleta, TX 0 $0 $0 0 0 $0 $0 159<br />
RR Inspection, TX 0 $0 $0 0 0 $0 $0 51<br />
Admin, TX (leased) 0 $0 $0 0 0 $0 $0 64<br />
El Paso, TX (Leased) 0 $0 $0 0 0 $0 $0 59<br />
DOT, TX (leased) 0 $0 $0 0 0 $0 $0 62<br />
Derby Line, VT 0 $0 $0 0 0 $0 $0 98<br />
Norton, VT 0 $0 $0 0 0 $0 $0 43<br />
Beebe Plain, VT 0 $0 $0 0 0 $0 $0 81<br />
Alburg Springs, VT 0 $0 $0 0 0 $0 $0 45<br />
North Troy VT 0 $0 $0 0 0 $0 $0 44<br />
West Berkshire,VT 0 $0 $0 0 0 $0 $0 55<br />
Derby Line, VT 0 $0 $0 0 0 $0 $0 84<br />
Beecher Falls, VT 0 $0 $0 0 0 $0 $0 188<br />
Canaan, VT 0 $0 $0 0 0 $0 $0 127<br />
East Richford, VT 0 $0 $0 0 0 $0 $0 56<br />
Richford, VT 0 $0 $0 0 0 $0 $0 55<br />
Alburg, VT (Joint<br />
ownership)<br />
0 $2,435 $0 0 383 $52 $2 48<br />
Highgate Springs 1, VT 0 $1,911 $0 0 243 $34 $1 59<br />
Highgate Springs 2, VT 0 $1 $0 0 0 $0 $0 87<br />
Highgate Springs 3, VT 0 $0 $0 0 0 $0 $0 59<br />
Blaine, WA 0 $0 $0 100 0 $0 $0 136<br />
136
Table B-13: Wind Energy Calculations by Site<br />
LPOE Site Name<br />
Wind<br />
Capacity<br />
(kW)<br />
Wind Initial<br />
Cost ($)<br />
Wind<br />
Rebate ($)<br />
Wind Net<br />
Metering up<br />
to (kW)<br />
Wind Annual<br />
Energy<br />
Delivery<br />
(kWh/yr)<br />
Wind Annual<br />
Cost Savings<br />
($)<br />
Wind<br />
Annual<br />
O&M Cost<br />
($/yr)<br />
Wind<br />
Payback<br />
Period<br />
(yrs)<br />
Danville, WA 0 $0 $0 0 0 $0 $0 1,006<br />
Laurier, WA 0 $0 $0 0 0 $0 $0 671<br />
Mataline Falls. WA 0 $0 $0 0 0 $0 $0 (110,018)<br />
Oroville, WA 0 $0 $0 0 0 $0 $0 1,558<br />
Point Robert, WA 0 $0 $0 0 0 $0 $0 1,124<br />
Sumas, WA 0 $0 $0 100 0 $0 $0 149<br />
Blaine, WA 0 $0 $0 100 0 $0 $0 165<br />
Blaine, WA 0 $0 $0 100 0 $0 $0 129<br />
Kenneth Ward, WA 0 $0 $0 100 0 $0 $0 124<br />
Totals $472,874.00<br />
Note that each technology is recommended as part of the optimized solution for a<br />
site, and these sizes minimize life-cycle costs. In other words, it is possible for<br />
an LPOE site to cost effectively generate more RE than the optimized solution<br />
indicates, but the life cycle costs would be higher.<br />
137
Table B-14: Calculations for Biomass Gasification of Dry Waste for Heat and Electric Power<br />
Table B-14: Calculations for Biomass Gasification of Dry Waste<br />
for Heat and Electric Power<br />
LPOE Site Name<br />
Biomass<br />
Gasifier<br />
Size<br />
(MBtu/h)<br />
Biomass<br />
Gasifier<br />
Cogen<br />
Size<br />
(kW)<br />
Biomass<br />
Initial<br />
Cost ($)<br />
Biomass<br />
Natural<br />
Gas<br />
Savings<br />
(therms/yr)<br />
Biomass<br />
Gasifier<br />
Electric<br />
Delivery<br />
(kWh/yr)<br />
Biomass<br />
Gasifier<br />
Annual<br />
Utility<br />
Cost<br />
Savings<br />
($/yr)<br />
Tons<br />
of<br />
Fuel<br />
Used<br />
Biomass<br />
Gasifier<br />
Payback<br />
Period<br />
(yrs)<br />
Dalton Cache, AK 0 0 $0 0 0 $0 0 $0 $0 n/a<br />
Alcan, AK 0 0 $0 0 0 $0 0 $0 $0 n/a<br />
Skagway, AK 0 0 $0 0 0 $0 0 $0 $0 n/a<br />
Lukeville, AZ 0 0 $0 0 0 $0 0 $0 $0 n/a<br />
Nogales, AZ 0 0 $0 0 0 $0 0 $0 $0 n/a<br />
Sasabe, AZ 0 0 $0 0 0 $0 0 $0 $0 n/a<br />
Douglas, AZ 0 0 $0 0 0 $0 0 $0 $0 n/a<br />
San Luis, AZ 0.172 17 $115,233 6,878 129,993 $29,643 171 $4,285 $14,620 11<br />
Naco, AZ 0 0 $0 0 0 $0 0 $0 $0 n/a<br />
San Luis AZ (not<br />
built yet) 0 0 $0 0 0 $0 0 $0 $0 n/a<br />
Nogales, AZ 0 0 $0 0 0 $0 0 $0 $0 n/a<br />
Calexico West, CA 0 0 $0 0 0 $0 0 $0 $0 n/a<br />
San Ysidro, CA 0 0 $0 0 0 $0 0 $0 $0 n/a<br />
Andrade, CA 0 0 $0 0 0 $0 0 $0 $0 n/a<br />
Otay Mesa, CA 0 0 $0 0 0 $0 0 $0 $0 n/a<br />
Tecate, CA 0.115 12 $95,485 4,615 86,759 $29,700 114 $2,408 $9,776 5<br />
Calexico, CA 0.254 24 $197,485 10,800 177,241 $59,910 252 $6,341 $21,032 6<br />
Eastport, ID 0 0 $0 0 0 $0 0 $0 $0 n/a<br />
Porthill, ID 0 0 $0 0 0 $0 0 $0 $0 n/a<br />
Ferry Point, ME 0 0 $0 0 0 $0 0 $0 $0 n/a<br />
Coburn Gore, ME 0.101 11 $70,229 3,893 80,054 $19,782 101 $2,052 $8,739 8<br />
Fort Fairfield, ME 0 0 $0 0 0 $0 0 $0 $0 n/a<br />
Houlton, ME 0.105 11 $72,315 4,098 81,383 $16,804 104 $2,152 $8,992 13<br />
Jackman, ME 0 0 $0 0 0 $0 0 $0 $0 n/a<br />
Limestone, ME 0 0 $0 0 0 $0 0 $0 $0 n/a<br />
Orient, ME 0 0 $0 0 0 $0 0 $0 $0 n/a<br />
Vanceboro, ME 0 0 $0 0 0 $0 0 $0 $0 n/a<br />
VanBuren, ME 0 0 $0 0 0 $0 0 $0 $0 n/a<br />
Milltown ME 0 0 $0 0 0 $0 0 $0 $0 n/a<br />
St. Francis, ME 0 0 $0 0 0 $0 0 $0 $0 n/a<br />
Madawaska, ME 0 0 $0 0 0 $0 0 $0 $0 n/a<br />
Fort Kent, ME 0.115 12 $78,880 4,491 89,001 $22,350 114 $2,425 $9,841 8<br />
St. Francis, ME 0 0 $0 0 0 $0 0 $0 $0 n/a<br />
Detroit Cargo, MI 0 0 $0 0 0 $0 0 $0 $0 n/a<br />
Fuel<br />
Cost<br />
($)<br />
Biomass<br />
Gasifier<br />
O&M<br />
Cost($/yr)<br />
138
Table B-14: Calculations for Biomass Gasification of Dry Waste<br />
for Heat and Electric Power<br />
LPOE Site Name<br />
Biomass<br />
Gasifier<br />
Size<br />
(MBtu/h)<br />
Biomass<br />
Gasifier<br />
Cogen<br />
Size<br />
(kW)<br />
Biomass<br />
Initial<br />
Cost ($)<br />
Biomass<br />
Natural<br />
Gas<br />
Savings<br />
(therms/yr)<br />
Biomass<br />
Gasifier<br />
Electric<br />
Delivery<br />
(kWh/yr)<br />
Biomass<br />
Gasifier<br />
Annual<br />
Utility<br />
Cost<br />
Savings<br />
($/yr)<br />
Tons<br />
of<br />
Fuel<br />
Used<br />
Fuel<br />
Cost<br />
($)<br />
Biomass<br />
Gasifier<br />
O&M<br />
Cost($/yr)<br />
Biomass<br />
Gasifier<br />
Payback<br />
Period<br />
(yrs)<br />
Intl Bridge, MI 0 0 $0 0 0 $0 0 $0 $0 n/a<br />
Amb. Bridge, MI 0 0 $0 0 0 $0 0 $0 $0 n/a<br />
Grand Portage, MN 0 0 $0 0 0 $0 0 $0 $0 n/a<br />
Noyes, MN 0 0 $0 0 0 $0 0 $0 $0 n/a<br />
Roseau, MN 0 0 $0 0 0 $0 0 $0 $0 n/a<br />
Intl Falls, MN 0 0 $0 0 0 $0 0 $0 $0 n/a<br />
Baudette, MN 0 0 $81 9 0 $32 0 $2 $7 n/a<br />
Chief Mt, MT 0 0 $0 0 0 $0 0 $0 $0 n/a<br />
Piegan, MT 0 0 $0 0 0 $0 0 $0 $0 n/a<br />
Raymond, MT 0.001 0 $784 99 0 $193 1 $27 $77 9<br />
Rooseville, MT 0 0 $0 0 0 $0 0 $0 $0 n/a<br />
Sweetgrass, MT 0.115 12 $82,297 4,454 89,228 $22,182 114 $2,438 $9,829 8<br />
Turner, MT 0 0 $0 0 0 $0 0 $0 $0 n/a<br />
Ambrose, ND 0 0 $0 0 0 $0 0 $0 $0 n/a<br />
Dunseith, ND 0 0 $0 0 0 $0 0 $0 $0 n/a<br />
Portal, ND 0 0 $0 0 0 $0 0 $0 $0 n/a<br />
St. John ND 0 0 $0 0 0 $0 0 $0 $0 n/a<br />
Pembina, ND 0 0 $0 0 0 $0 0 $0 $0 n/a<br />
Columbus, NM 0 0 $0 0 0 $0 0 $0 $0 n/a<br />
Santa Teresa, NM 0 0 $0 0 0 $0 0 $0 $0 n/a<br />
Alexandria Bay, NY 0 0 $0 0 0 $0 0 $0 $0 n/a<br />
Champlain, NY 0 0 $0 0 0 $0 0 $0 $0 n/a<br />
Massena, NY 0 0 $0 0 0 $0 0 $0 $0 n/a<br />
Fort Covington, NY 0 0 $0 0 0 $0 0 $0 $0 n/a<br />
Rouses Pt. NY 0 0 $0 0 0 $0 0 $0 $0 n/a<br />
St John Hwy, NY 0 0 $0 0 0 $0 0 $0 $0 n/a<br />
Trout, River, NY 0 0 $0 0 0 $0 0 $0 $0 n/a<br />
Chateaugay, NY 0 0 $0 0 0 $0 0 $0 $0 n/a<br />
Mooers, NY 0 0 $0 0 0 $0 0 $0 $0 n/a<br />
Jamieson, NY 0 0 $0 0 0 $0 0 $0 $0 n/a<br />
Niagra Falls, NY 0.126 13 $100,237 4,988 95,270 $30,211 125 $2,591 $10,673 6<br />
Ogdensburg, NY 0 0 $0 0 0 $0 0 $0 $0 n/a<br />
Brownsville/<br />
Matamoros, TX 0 0 $0 0 0 $0 0 $0 $0 n/a<br />
Gateway, TX 0 0 $0 0 0 $0 0 $0 $0 n/a<br />
139
Table B-14: Calculations for Biomass Gasification of Dry Waste<br />
for Heat and Electric Power<br />
LPOE Site Name<br />
Biomass<br />
Gasifier<br />
Size<br />
(MBtu/h)<br />
Biomass<br />
Gasifier<br />
Cogen<br />
Size<br />
(kW)<br />
Biomass<br />
Initial<br />
Cost ($)<br />
Biomass<br />
Natural<br />
Gas<br />
Savings<br />
(therms/yr)<br />
Biomass<br />
Gasifier<br />
Electric<br />
Delivery<br />
(kWh/yr)<br />
Biomass<br />
Gasifier<br />
Annual<br />
Utility<br />
Cost<br />
Savings<br />
($/yr)<br />
Tons<br />
of<br />
Fuel<br />
Used<br />
Fuel<br />
Cost<br />
($)<br />
Biomass<br />
Gasifier<br />
O&M<br />
Cost($/yr)<br />
Biomass<br />
Gasifier<br />
Payback<br />
Period<br />
(yrs)<br />
Columbia, TX 0.214 23 $137,234 8,218 168,483 $41,457 212 $7,296 $18,411 9<br />
Convent, TX 0 0 $0 0 0 $0 0 $0 $0 n/a<br />
Del Rio, TX 0 0 $0 0 0 $0 0 $0 $0 n/a<br />
Donna TX (not built<br />
yet) 0 0 $0 0 0 $0 0 $0 $0 n/a<br />
Bridge of the<br />
Americas, TX 0 0 $0 0 0 $0 0 $0 $0 n/a<br />
Eagle Pass, TX 0 0 $0 0 0 $0 0 $0 $0 n/a<br />
Fabens, TX 0 0 $0 0 0 $0 0 $0 $0 n/a<br />
Fort Hancock, TX 0 0 $0 0 0 $0 0 $0 $0 n/a<br />
El Paso, TX (out<br />
leased) 0 0 $0 0 0 $0 0 $0 $0 n/a<br />
Juarez-Lincoln, TX 0 0 $0 0 0 $0 0 $0 $0 n/a<br />
Los Indios, TX 0 0 $0 0 0 $0 0 $0 $0 n/a<br />
Laredo TX 0 0 $0 0 0 $0 0 $0 $0 n/a<br />
Los Tomates, TX 0 0 $0 0 0 $0 0 $0 $0 n/a<br />
McAllen, TX 0 0 $0 0 0 $0 0 $0 $0 n/a<br />
McAllen TX (not<br />
built yet) 0 0 $0 0 0 $0 0 $0 $0 n/a<br />
Marfa, TX 0 0 $0 0 0 $0 0 $0 $0 n/a<br />
Kika de la Garza, TX 0 0 $0 0 0 $0 0 $0 $0 n/a<br />
Paso Del Norte, TX 0 0 $0 0 0 $0 0 $0 $0 n/a<br />
Progreso, TX 0 0 $0 0 0 $0 0 $0 $0 n/a<br />
Roma, TX 0 0 $0 0 0 $0 0 $0 $0 n/a<br />
Rio Grande City, TX 0 0 $0 0 0 $0 0 $0 $0 n/a<br />
Ysleta, TX 0 0 $0 0 0 $0 0 $0 $0 n/a<br />
RR Inspection, TX 0 0 $0 0 0 $0 0 $0 $0 n/a<br />
Admin, TX (leased) 0 0 $0 0 0 $0 0 $0 $0 n/a<br />
El Paso, TX<br />
(Leased) 0 0 $0 0 0 $0 0 $0 $0 n/a<br />
DOT, TX (leased) 0 0 $0 0 0 $0 0 $0 $0 n/a<br />
Derby Line, VT 0 0 $0 0 0 $0 0 $0 $0 n/a<br />
Norton, VT 0 0 $0 0 0 $0 0 $0 $0 n/a<br />
Beebe Plain, VT 0 0 $0 0 0 $0 0 $0 $0 n/a<br />
Alburg Springs, VT 0 0 $0 0 0 $0 0 $0 $0 n/a<br />
North Troy VT 0 0 $0 0 0 $0 0 $0 $0 n/a<br />
140
Table B-14: Calculations for Biomass Gasification of Dry Waste<br />
for Heat and Electric Power<br />
LPOE Site Name<br />
Biomass<br />
Gasifier<br />
Size<br />
(MBtu/h)<br />
Biomass<br />
Gasifier<br />
Cogen<br />
Size<br />
(kW)<br />
Biomass<br />
Initial<br />
Cost ($)<br />
Biomass<br />
Natural<br />
Gas<br />
Savings<br />
(therms/yr)<br />
Biomass<br />
Gasifier<br />
Electric<br />
Delivery<br />
(kWh/yr)<br />
Biomass<br />
Gasifier<br />
Annual<br />
Utility<br />
Cost<br />
Savings<br />
($/yr)<br />
Tons<br />
of<br />
Fuel<br />
Used<br />
Fuel<br />
Cost<br />
($)<br />
Biomass<br />
Gasifier<br />
O&M<br />
Cost($/yr)<br />
Biomass<br />
Gasifier<br />
Payback<br />
Period<br />
(yrs)<br />
West Berkshire,VT 0 0 $0 0 0 $0 0 $0 $0 n/a<br />
Derby Line, VT 0 0 $0 0 0 $0 0 $0 $0 n/a<br />
Beecher Falls, VT 0 0 $0 0 0 $0 0 $0 $0 n/a<br />
Canaan, VT 0 0 $0 0 0 $0 0 $0 $0 n/a<br />
East Richford, VT 0 0 $0 0 0 $0 0 $0 $0 n/a<br />
Richford, VT 0 0 $0 0 0 $0 0 $0 $0 n/a<br />
Alburg, VT (Joint<br />
ownership) 0 0 $0 0 0 $0 0 $0 $0 n/a<br />
Highgate Springs 1,<br />
VT 0 0 $0 0 0 $0 0 $0 $0 n/a<br />
Highgate Springs 2,<br />
VT 0 0 $0 0 0 $0 0 $0 $0 n/a<br />
Highgate Springs 3,<br />
VT 0 0 $0 0 0 $0 0 $0 $0 n/a<br />
Blaine, WA 0 0 $0 0 0 $0 0 $0 $0 n/a<br />
Danville, WA 0 0 $0 0 0 $0 0 $0 $0 n/a<br />
Laurier, WA 0 0 $0 0 0 $0 0 $0 $0 n/a<br />
Mataline Falls. WA 0 0 $0 0 0 $0 0 $0 $0 n/a<br />
Oroville, WA 0 0 $0 0 0 $0 0 $0 $0 n/a<br />
Point Robert, WA 0 0 $0 0 0 $0 0 $0 $0 n/a<br />
Sumas, WA 0 0 $0 0 0 $0 0 $0 $0 n/a<br />
Blaine, WA 0 0 $0 0 0 $0 0 $0 $0 n/a<br />
Blaine, WA 0 0 $0 0 0 $0 0 $0 $0 n/a<br />
Kenneth Ward, WA 0 0 $0 0 0 $0 0 $0 $0 n/a<br />
Totals $272,264<br />
Note that each technology is recommended as part of the optimized solution for a<br />
site, and these sizes minimize life-cycle costs. In other words, it is possible for<br />
an LPOE site to cost effectively generate more RE than the optimized solution<br />
indicates, but the life cycle costs would be higher.<br />
141
Table B-15: Calculations for Biomass Gasification of Dry Waste for Heat and Electric Power (Only Sites with Payback Periods Fewer<br />
than 17 Years)<br />
Table B-15: Calculations for Biomass Gasification of Dry Waste<br />
for Heat and Electric Power<br />
(Only Sites with Payback Periods Fewer than 17 Years)<br />
LPOE Site<br />
Name<br />
Biomass<br />
Gasifier<br />
Size<br />
(MBtu/h)<br />
Biomass<br />
Gasifier<br />
Cogen<br />
Size<br />
(kW)<br />
Biomass<br />
Gasifier<br />
Initial<br />
Cost ($)<br />
Biomass<br />
Fuel<br />
Cost<br />
($)<br />
Biomass<br />
Gasifier<br />
O&M<br />
($/yr)<br />
Natural<br />
Gas Saved<br />
(therms/yr)<br />
Biomass<br />
Gasifier<br />
Electric<br />
Delivery<br />
(kWh/yr)<br />
Utility<br />
Savings<br />
($/yr)<br />
Biomass<br />
Gasifier<br />
Payback<br />
Period<br />
(yrs)<br />
Tecate, CA 0.115 12 $95,485 $2,408 $9,776 4,615 86,759 $29,700 5<br />
Calexico, CA 0.254 24 $197,485 $6,341 $21,032 10,800 177,241 $59,910 6<br />
Niagra Falls,<br />
NY 0.126 13 $100,237 $2,591 $10,673 4,988 95,270 $30,211 6<br />
Coburn<br />
Gore, ME 0.101 11 $70,229 $2,052 $8,739 3,893 80,054 $19,782 8<br />
Fort Kent,<br />
ME 0.115 12 $78,880 $2,425 $9,841 4,491 89,001 $22,350 8<br />
Sweetgrass,<br />
MT 0.115 12 $82,297 $2,438 $9,829 4,454 89,228 $22,182 8<br />
Raymond,<br />
MT 0.001 0 $784 $27 $77 99 0 $193 9<br />
Columbia,<br />
TX 0.214 23 $137,234 $7,296 $18,411 8,218 168,483 $41,457 9<br />
San Luis, AZ 0.172 17 $115,233 $4,285 $14,620 6,878 129,993 $29,643 11<br />
Houlton, ME 0.105 11 $72,315 $2,152 $8,992 4,098 81,383 $16,804 13<br />
Totals 1.318 135 $950,179.00 $32,015.00 $111,990.00 52,534 997,412 $272,232<br />
Note that each technology is recommended as part of the optimized solution for a<br />
site, and these sizes minimize life-cycle costs. In other words, it is possible for<br />
an LPOE site to cost effectively generate more RE than the optimized solution<br />
indicates, but the life cycle costs would be higher.<br />
142
Table B-16: Details of Solar Ventilation Air Preheating Calculations<br />
Table B-16: Details of Solar Ventilation Air Preheating Calculations<br />
LPOE Site Name<br />
SVP<br />
Ventilation<br />
Rate<br />
(CFM)<br />
Solar Vent<br />
Preheat<br />
Area (ft 2 )<br />
Annual Gas<br />
Savings<br />
(therms/yr)<br />
Initial Cost<br />
($)<br />
Annual Utility<br />
Cost Savings<br />
($/yr)<br />
Solar Vent<br />
Preheat<br />
Payback<br />
Period<br />
(yrs)<br />
Dalton Cache, AK 3,005 1275 2,906 $45,903 $7,476 6<br />
Alcan, AK 21,697 4,220 12,178 $151,931 $30,537 5<br />
Skagway, AK 2,232 813 2,158 $29,256 $5,877 5<br />
Lukeville, AZ 9,520 100 108 $3,600 $323 11<br />
Nogales, AZ 15,552 100 147 $3,600 $180 20<br />
Sasabe, AZ 4,140 100 132 $3,600 $504 7<br />
Douglas, AZ 10,290 1,623 2,645 $58,443 $4,642 13<br />
San Luis, AZ 10,934 0 0 $0 $0 21<br />
Naco, AZ 3,341 358 525 $12,884 $993 13<br />
San Luis AZ (not built<br />
yet)<br />
3,400 0 0 $0 $0 55<br />
Nogales, AZ 13,994 0 0 $0 $0 21<br />
Calexico West, CA 19,888 0 0 $0 $0 48<br />
San Ysidro, CA 31,339 0 0 $0 $0 60<br />
Andrade, CA 646 97 65 $3,477 $256 14<br />
Otay Mesa, CA 48,105 0 0 $0 $0 53<br />
Tecate, CA 6,839 0 0 $0 $0 16<br />
Calexico, CA 34,637 0 0 $0 $0 14<br />
Eastport, ID 4,636 1,592 4,040 $57,326 $7,458 8<br />
Porthill, ID 1,453 499 1,266 $17,973 $2,563 7<br />
Ferry Point, ME 3,607 1,577 3,676 $56,783 $8,009 7<br />
Coburn Gore, ME 826 269 636 $9,682 $1,570 6<br />
Fort Fairfield, ME 859 377 875 $13,585 $1,944 7<br />
Houlton, ME 6,445 2,832 6,568 $101,965 $13,455 8<br />
Jackman, ME 2,809 916 2,166 $32,958 $4,068 8<br />
Limestone, ME 653 286 665 $10,292 $1,638 6<br />
Orient, ME 630 277 642 $9,979 $1,474 7<br />
Vanceboro, ME 1,671 733 1,703 $26,390 $3,715 7<br />
VanBuren, ME 1,776 778 1,810 $28,008 $3,803 7<br />
Milltown ME 159 50 115 $1,783 $239 7<br />
St. Francis, ME 29 116 299 $4,181 $782 5<br />
Madawaska, ME 1,295 548 1,320 $19,714 $2,869 7<br />
Fort Kent, ME 1,376 582 1,402 $20,949 $2,613 8<br />
St. Francis, ME 132 33 79 $1,184 $212 6<br />
Detroit Cargo, MI 11,013 0 0 $0 $0 21<br />
Intl Bridge, MI 25,009 0 0 $0 $0 18<br />
143
Table B-16: Details of Solar Ventilation Air Preheating Calculations<br />
LPOE Site Name<br />
SVP<br />
Ventilation<br />
Rate<br />
(CFM)<br />
Solar Vent<br />
Preheat<br />
Area (ft 2 )<br />
Annual Gas<br />
Savings<br />
(therms/yr)<br />
Initial Cost<br />
($)<br />
Annual Utility<br />
Cost Savings<br />
($/yr)<br />
Solar Vent<br />
Preheat<br />
Payback<br />
Period<br />
(yrs)<br />
Amb. Bridge, MI 131,810 0 0 $0 $0 17<br />
Grand Portage, MN 4,053 1,541 4,385 $55,469 $6,690 8<br />
Noyes, MN 2,384 902 2,580 $32,457 $4,663 7<br />
Roseau, MN 8,815 2,898 7,709 $104,341 $9,280 11<br />
Intl Falls, MN 1,674 489 1,149 $17,592 $1,382 13<br />
Baudette, MN 1,226 342 713 $12,308 $2,581 5<br />
Chief Mt, MT 1,819 466 1,347 $16,780 $1,198 14<br />
Piegan, MT 4,050 1,307 3,775 $47,035 $7,001 7<br />
Raymond, MT 4,957 1,555 4,547 $55,964 $8,806 6<br />
Rooseville, MT 4,076 0 0 $0 $0 21<br />
Sweetgrass, MT 14,330 1,261 3,645 $45,411 $10,782 4<br />
Turner, MT 1,226 161 464 $5,809 $3,423 2<br />
Ambrose, ND 939 284 861 $10,210 $1,480 7<br />
Dunseith, ND 1,625 528 1,520 $19,012 $2,011 9<br />
Portal, ND 2,265 714 2,138 $25,713 $2,095 12<br />
St. John ND 812 269 773 $9,675 $1,255 8<br />
Pembina, ND 11,434 3,831 10,964 $137,933 $16,974 8<br />
Columbus, NM 7,073 880 1,818 $31,694 $6,263 5<br />
Santa Teresa, NM 16,819 0 0 $0 $0 17<br />
Alexandria Bay, NY 8,288 3,640 7,200 $131,044 $10,275 13<br />
Champlain, NY 33,484 6,739 13,329 $242,600 $19,778 12<br />
Massena, NY 3,400 1,627 2,954 $58,573 $7,358 8<br />
Fort Covington, NY 837 334 607 $12,029 $1,554 8<br />
Rouses Pt. NY 1,480 651 1,188 $23,449 $2,893 8<br />
St John Hwy, NY 2,653 1,171 2,135 $42,152 $5,385 8<br />
Trout, River, NY 1,600 730 1,371 $26,273 $3,314 8<br />
Chateaugay, NY 888 389 753 $14,021 $1,971 7<br />
Mooers, NY 771 300 547 $10,793 $1,402 8<br />
Jamieson, NY 355 111 177 $3,980 $438 7<br />
Niagra Falls, NY 74,825 8,444 13,087 $303,989 $47,991 6<br />
Ogdensburg, NY 33,075 5,614 10,859 $202,109 $15,098 13<br />
Brownsville/<br />
Matamoros, TX<br />
14,995 0 0 $0 $0 269<br />
Gateway, TX 21,815 0 0 $0 $0 259<br />
Columbia, TX 54,548 0 0 $0 $0 32<br />
Convent, TX 8,344 0 0 $0 $0 87<br />
144
Table B-16: Details of Solar Ventilation Air Preheating Calculations<br />
LPOE Site Name<br />
SVP<br />
Ventilation<br />
Rate<br />
(CFM)<br />
Solar Vent<br />
Preheat<br />
Area (ft 2 )<br />
Annual Gas<br />
Savings<br />
(therms/yr)<br />
Initial Cost<br />
($)<br />
Annual Utility<br />
Cost Savings<br />
($/yr)<br />
Solar Vent<br />
Preheat<br />
Payback<br />
Period<br />
(yrs)<br />
Del Rio, TX 25,464 0 0 $0 $0 21<br />
Donna TX (not built yet) 3,400 0 0 $0 $0 267<br />
Bridge of the Americas,<br />
TX<br />
40,439 0 0 $0 $0 20<br />
Eagle Pass, TX 25,438 0 0 $0 $0 32<br />
Fabens, TX 2,970 376 763 $13,542 $3,861 4<br />
Fort Hancock, TX 1,301 160 327 $5,765 $843 7<br />
El Paso, TX (out leased) 3,400 0 0 $0 $0 18<br />
Juarez-Lincoln, TX 63,132 0 0 $0 $0 81<br />
Los Indios, TX 31,515 0 0 $0 $0 241<br />
Laredo TX 19,621 0 0 $0 $0 80<br />
Los Tomates, TX 35,259 0 0 $0 $0 256<br />
McAllen, TX 22,730 0 0 $0 $0 91<br />
McAllen TX (not built<br />
yet)<br />
3,400 0 0 $0 $0 189<br />
Marfa, TX 16,532 2,292 4,152 $82,515 $5,944 14<br />
Kika de la Garza, TX 40,431 0 0 $0 $0 165<br />
Paso Del Norte, TX 19,968 0 0 $0 $0 20<br />
Progreso, TX 4,381 0 0 $0 $0 104<br />
Roma, TX 5,776 0 0 $0 $0 45<br />
Rio Grande City, TX 6,952 0 0 $0 $0 82<br />
Ysleta, TX 44,995 0 0 $0 $0 20<br />
RR Inspection, TX 282 0 0 $0 $0 28<br />
Admin, TX (leased) 10,416 0 0 $0 $0 159<br />
El Paso, TX (Leased) 1,218 0 0 $0 $0 17<br />
DOT, TX (leased) 10,220 661 558 $23,797 $1,577 15<br />
Derby Line, VT 1,649 575 1,327 $20,710 $2,725 8<br />
Norton, VT 1,124 392 905 $14,119 $1,802 8<br />
Beebe Plain, VT 493 161 372 $5,799 $706 8<br />
Alburg Springs, VT 462 145 265 $5,231 $608 9<br />
North Troy VT 859 326 681 $11,731 $1,408 8<br />
West Berkshire,VT 1,075 412 741 $14,817 $1,646 9<br />
Derby Line, VT 4,974 1,735 4,003 $62,463 $8,594 7<br />
Beecher Falls, VT 1,362 483 1,094 $17,397 $2,498 7<br />
Canaan, VT 701 248 561 $8,922 $1,253 7<br />
East Richford, VT 1,225 471 984 $16,957 $2,024 8<br />
Richford, VT 1,141 438 916 $15,779 $2,008 8<br />
145
Table B-16: Details of Solar Ventilation Air Preheating Calculations<br />
LPOE Site Name<br />
Alburg, VT (Joint<br />
ownership)<br />
SVP<br />
Ventilation<br />
Rate<br />
(CFM)<br />
Solar Vent<br />
Preheat<br />
Area (ft 2 )<br />
Annual Gas<br />
Savings<br />
(therms/yr)<br />
Initial Cost<br />
($)<br />
Annual Utility<br />
Cost Savings<br />
($/yr)<br />
Solar Vent<br />
Preheat<br />
Payback<br />
Period<br />
(yrs)<br />
1,24 261 477 $9,414 $1,904 5<br />
Highgate Springs 1, VT 323 0 0 $0 $0 5<br />
Highgate Springs 2, VT 4,729 2,087 3,806 $75,137 $7,667 10<br />
Highgate Springs 3, VT 640 199 362 $7,153 $727 10<br />
Blaine, WA 11,540 3,316 6,046 $119,379 $13,153 9<br />
Danville, WA 2,550 823 1,800 $29,612 $2,653 11<br />
Laurier, WA 1,679 406 888 $14,603 $2,737 5<br />
Mataline Falls. WA 1,547 0 0 $0 $0 17<br />
Oroville, WA 24,285 289 592 $10,413 $4,668 2<br />
Point Robert, WA 11,069 3,248 6,642 $116,913 $12,099 10<br />
Sumas, WA 4,060 0 0 $0 $0 19<br />
Blaine, WA 11,540 3,316 6,046 $119,367 $11,012 11<br />
Blaine, WA 32,791 0 0 $0 $0 18<br />
Kenneth Ward, WA 5,903 0 0 $0 $0 19<br />
Totals $404,658.00<br />
Note that each technology is recommended as part of the optimized solution for a<br />
site, and these sizes minimize life-cycle costs. In other words, it is possible for<br />
an LPOE site to cost effectively generate more RE than the optimized solution<br />
indicates, but the life cycle costs would be higher.<br />
146
Table B-17: Details of Solar Water Heating Calculations<br />
Table B-17: Details of Solar Water Heating Calculations<br />
Name<br />
Hot Water<br />
Use<br />
(gallon/day)<br />
Solar Water<br />
Heating Area<br />
(ft 2 )<br />
Solar Water<br />
Heating<br />
Initial Cost<br />
($)<br />
SWH<br />
Utility<br />
Rebate ($)<br />
Solar<br />
Water<br />
Heating<br />
Gas<br />
Savings<br />
(therms/yr)<br />
Solar Water<br />
Heating<br />
Annual Utility<br />
Cost Savings<br />
($/yr)<br />
Solar<br />
Water<br />
Heating<br />
O&M Cost<br />
($/yr)<br />
Solar<br />
Water<br />
Heating<br />
Payback<br />
Period<br />
(yrs)<br />
Dalton Cache, AK 652 189 $13,788 $0 377 $970 $69 15<br />
Alcan, AK 4,430 3,452 $252,024 $0 7,694 $19,293 $1,260 14<br />
Skagway, AK 537 291 $21,242 $0 581 $1,583 $106 14<br />
Lukeville, AZ 820 592 $43,243 $0 2,256 $6,725 $216 7<br />
Nogales, AZ 2,616 0 $0 $0 0 $0 $0 17<br />
Sasabe, AZ 252 184 $13,445 $5,378 694 $2,656 $67 3<br />
Douglas, AZ 1,574 1,158 $84,530 $0 4,328 $7,597 $423 12<br />
San Luis, AZ 1,982 1,445 $105,506 $0 5,452 $14,285 $528 8<br />
Naco, AZ 529 387 $28,250 $0 1,456 $2,754 $141 11<br />
San Luis AZ (not built<br />
yet)<br />
249 0 $0 $0 0 $0 $0 21<br />
Nogales, AZ 3,841 0 $0 $0 0 $0 $0 17<br />
Calexico West, CA 4,415 0 $0 $0 0 $0 $0 21<br />
San Ysidro, CA 9,666 0 $0 $0 0 $0 $0 18<br />
Andrade, CA 379 275 $20,108 $0 1,041 $4,064 $101 5<br />
Otay Mesa, CA 5,725 0 $0 $0 0 $0 $0 16<br />
Tecate, CA 1,279 1,028 $75,034 $15,418 3,516 $13,788 $375 4<br />
Calexico, CA 4,206 3,062 $223,550 $0 11,570 $41,140 $1,118 6<br />
Eastport, ID 617 0 $0 $0 0 $0 $0 17<br />
Porthill, ID 158 89 $6,472 $0 222 $450 $32 15<br />
Ferry Point, ME 512 223 $16,294 $0 534 $1,163 $81 15<br />
Coburn Gore, ME 498 556 $40,598 $0 1,369 $3,376 $203 13<br />
Fort Fairfield, ME 210 114 $8,353 $0 255 $567 $42 16<br />
Houlton, ME 1,144 0 $0 $0 0 $0 $0 16<br />
Jackman, ME 318 0 $0 $0 0 $0 $0 18<br />
Limestone, ME 145 109 $7,931 $0 240 $592 $40 14<br />
Orient, ME 52 39 $2,834 $0 95 $217 $14 14<br />
Vanceboro, ME 321 167 $12,200 $0 394 $859 $61 15<br />
VanBuren, ME 290 117 $8,541 $0 271 $570 $43 16<br />
Milltown ME 96 63 $4,612 $0 151 $313 $23 16<br />
St. Francis, ME 41 32 $2,336 $0 78 $203 $12 12<br />
Madawaska, ME 341 136 $9,951 $0 311 $677 $50 16<br />
Fort Kent, ME 523 0 $0 $0 0 $0 $0 18<br />
St. Francis, ME 47 36 $2,641 $0 85 $227 $13 12<br />
Detroit Cargo, MI 4,832 0 $0 $0 0 $0 $0 35<br />
Intl Bridge, MI 3,581 0 $0 $0 0 $0 $0 37<br />
147
Table B-17: Details of Solar Water Heating Calculations<br />
Name<br />
Hot Water<br />
Use<br />
(gallon/day)<br />
Solar Water<br />
Heating Area<br />
(ft 2 )<br />
Solar Water<br />
Heating<br />
Initial Cost<br />
($)<br />
SWH<br />
Utility<br />
Rebate ($)<br />
Solar<br />
Water<br />
Heating<br />
Gas<br />
Savings<br />
(therms/yr)<br />
Solar Water<br />
Heating<br />
Annual Utility<br />
Cost Savings<br />
($/yr)<br />
Solar<br />
Water<br />
Heating<br />
O&M Cost<br />
($/yr)<br />
Solar<br />
Water<br />
Heating<br />
Payback<br />
Period<br />
(yrs)<br />
Amb. Bridge, MI 851 0 $0 $0 0 $0<br />
Grand Portage, MN 770 0 $0 $0 0 $0 $0 21<br />
Noyes, MN 454 0 $0 $0 0 $0 $0 18<br />
Roseau, MN 1,106 0 $0 $0 0 $0 $0 28<br />
Intl Falls, MN 372 0 $0 $0 0 $0 $0 31<br />
Baudette, MN 86 59 $4,312 $0 151 $548 $22 8<br />
Chief Mt, MT 1,915 0 $0 $0 0 $0 $0 36<br />
Piegan, MT 1,732 0 $0 $0 0 $0 $0 16<br />
Raymond, MT 2,560 0 $0 $0 0 $0 $0 16<br />
Rooseville, MT 636 0 $0 $0 0 $0 $0 61<br />
Sweetgrass, MT 810 547 $39,911 $0 1,502 $4,444 $200 9<br />
Turner, MT 17 10 $757 $0 28 $208 $4 4<br />
Ambrose, ND 172 0 $0 $0 0 $0 $0 18<br />
Dunseith, ND 282 0 $0 $0 0 $0 $0 24<br />
Portal, ND 561 0 $0 $0 0 $0 $0 34<br />
St. John ND 172 0 $0 $0 0 $0 $0 19<br />
Pembina, ND 4,140 0 $0 $0 0 $0 $0 22<br />
Columbus, NM 600 436 $31,824 $0 1,651 $5,689 $159 6<br />
Santa Teresa, NM 1,829 0 $0 $0 0 $0 $0 20<br />
Alexandria Bay, NY 1,530 0 $0 $0 0 $0 $0 24<br />
Champlain, NY 11,603 0 $0 $0 0 $0 $0 23<br />
Massena, NY 666 703 $51,329 $0 1,699 $4,233 $257 13<br />
Fort Covington, NY 189 165 $12,074 $0 391 $1,002 $60 13<br />
Rouses Pt. NY 325 258 $18,823 $0 596 $1,452 $94 14<br />
St John Hwy, NY 442 389 $28,398 $0 900 $2,269 $142 13<br />
Trout, River, NY 254 210 $15,303 $0 496 $1,199 $77 14<br />
Chateaugay, NY 229 203 $14,820 $0 475 $1,242 $74 13<br />
Mooers, NY 162 138 $10,057 $0 329 $843 $50 13<br />
Jamieson, NY 31 24 $1,760 $0 61 $150 $9 12<br />
Niagra Falls, NY 2,163 2,592 $189,220 $0 5,949 $21,817 $946 9<br />
Ogdensburg, NY 1,782 0 $0 $0 0 $0 $0 25<br />
Brownsville/<br />
Matamoros, TX<br />
1,099 0 $0 $0 0 $0 $0 24<br />
Gateway, TX 2,128 0 $0 $0 0 $0 $0 23<br />
Columbia, TX 2,367 2,104 $153,570 $0 6,511 $19,328 $768 8<br />
Convent, TX 1,865 0 $0 $0 0 $0 $0 24<br />
148
Table B-17: Details of Solar Water Heating Calculations<br />
Name<br />
Hot Water<br />
Use<br />
(gallon/day)<br />
Solar Water<br />
Heating Area<br />
(ft 2 )<br />
Solar Water<br />
Heating<br />
Initial Cost<br />
($)<br />
SWH<br />
Utility<br />
Rebate ($)<br />
Solar<br />
Water<br />
Heating<br />
Gas<br />
Savings<br />
(therms/yr)<br />
Solar Water<br />
Heating<br />
Annual Utility<br />
Cost Savings<br />
($/yr)<br />
Solar<br />
Water<br />
Heating<br />
O&M Cost<br />
($/yr)<br />
Solar<br />
Water<br />
Heating<br />
Payback<br />
Period<br />
(yrs)<br />
Del Rio, TX 2,640 2,082 $151,977 $0 6,380 $11,708 $760 14<br />
Donna TX (not built<br />
yet)<br />
Bridge of the<br />
Americas, TX<br />
249 0 $0 $0 0 $0 $0 28<br />
6,425 0 $0 $0 0 $0 $0 24<br />
Eagle Pass, TX 1,788 0 $0 $0 0 $0 $0 20<br />
Fabens, TX 326 242 $17,686 $0 895 $4,529 $88 4<br />
Fort Hancock, TX 411 300 $21,918 $0 1,131 $2,918 $110 8<br />
El Paso, TX (out<br />
leased)<br />
1,465 0 $0 $0 0 $0 $0 21<br />
Juarez-Lincoln, TX 5,051 0 $0 $0 0 $0 $0 22<br />
Los Indios, TX 2,494 0 $0 $0 0 $0 $0 25<br />
Laredo TX 804 0 $0 $0 0 $0 $0 22<br />
Los Tomates, TX 2,823 0 $0 $0 0 $0 $0 23<br />
McAllen, TX 914 0 $0 $0 0 $0 $0 12<br />
McAllen TX (not built<br />
yet)<br />
249 0 $0 $0 0 $0 $0 27<br />
Marfa, TX 683 337 $24,566 $0 1,242 $1,778 $123 15<br />
Kika de la Garza, TX 2,993 0 $0 $0 0 $0 $0 23<br />
Paso Del Norte, TX 2,146 0 $0 $0 0 $0 $0 24<br />
Progreso, TX 684 627 $45,753 $0 1,882 $4,814 $229 10<br />
Roma, TX 1,217 554 $40,429 $0 1,716 $4,715 $202 9<br />
Rio Grande City, TX 1,089 0 $0 $0 0 $0 $0 17<br />
Ysleta, TX 4,048 0 $0 $0 0 $0 $0 24<br />
RR Inspection, TX 9 0 $0 $0 0 $0 $0 7<br />
Admin, TX (leased) 2,635 0 $0 $0 0 $0 $0 22<br />
El Paso, TX (Leased) 532 0 $0 $0 0 $0 $0 21<br />
DOT, TX (leased) 1,408 1,266 $92,390 $0 3,872 $10,942 $462 9<br />
Derby Line, VT 729 0 $0 $0 0 $0 $0 17<br />
Norton, VT 317 0 $0 $0 0 $0 $0 18<br />
Beebe Plain, VT 100 0 $0 $0 0 $0 $0 19<br />
Alburg Springs, VT 98 72 $5,288 $0 166 $381 $26 15<br />
North Troy VT 115 81 $5,891 $0 184 $380 $29 17<br />
West Berkshire,VT 142 104 $7,587 $0 241 $537 $38 15<br />
Derby Line, VT 422 216 $15,733 $0 488 $1,048 $79 16<br />
Beecher Falls, VT 233 170 $12,430 $0 390 $891 $62 15<br />
Canaan, VT 166 120 $8,739 $0 275 $614 $44 15<br />
149
Table B-17: Details of Solar Water Heating Calculations<br />
Name<br />
Hot Water<br />
Use<br />
(gallon/day)<br />
Solar Water<br />
Heating Area<br />
(ft 2 )<br />
Solar Water<br />
Heating<br />
Initial Cost<br />
($)<br />
SWH<br />
Utility<br />
Rebate ($)<br />
Solar<br />
Water<br />
Heating<br />
Gas<br />
Savings<br />
(therms/yr)<br />
Solar Water<br />
Heating<br />
Annual Utility<br />
Cost Savings<br />
($/yr)<br />
Solar<br />
Water<br />
Heating<br />
O&M Cost<br />
($/yr)<br />
Solar<br />
Water<br />
Heating<br />
Payback<br />
Period<br />
(yrs)<br />
East Richford, VT 169 0 $0 $0 0 $0 $0 17<br />
Richford, VT 213 145 $10,607 $0 330 $724 $53 16<br />
Alburg, VT (Joint<br />
ownership)<br />
46 34 $2,517 $0 79 $316 $13 8<br />
Highgate Springs 1, VT 3 0 $0 $0 0 $0 $0 8<br />
Highgate Springs 2, VT 3,008 0 $0 $0 0 $0 $0 17<br />
Highgate Springs 3, VT 146 0 $0 $0 0 $0 $0 17<br />
Blaine, WA 1,013 256 $18,691 $0 584 $1,271 $93 16<br />
Danville, WA 231 0 $0 $0 0 $0 $0 21<br />
Laurier, WA 79 52 $3,777 $0 129 $397 $19 10<br />
Mataline Falls. WA 95 0 $0 $0 0 $0 $0 35<br />
Oroville, WA 1,568 0 $0 $0 0 $0 $0 4<br />
Point Robert, WA 776 223 $16,267 $0 592 $1,079 $81 16<br />
Sumas, WA 1,192 0 $0 $0 0 $0 $0 36<br />
Blaine, WA 809 0 $0 $0 0 $0 $0 19<br />
Blaine, WA 3,447 0 $0 $0 0 $0 $0 34<br />
Kenneth Ward, WA 595 0 $0 $0 0 $0 $0 36<br />
Totals $237,535.00<br />
Note that each technology is recommended as part of the optimized solution for a<br />
site, and these sizes minimize life-cycle costs. In other words, it is possible for<br />
an LPOE site to cost effectively generate more RE than the optimized solution<br />
indicates, but the life cycle costs would be higher.<br />
150
LPOE Site Name<br />
Table B-18: ROI of RE Solutions (without incentives)<br />
Table B-18: Return on Investment of RE Solutions<br />
(without incentives)<br />
Renewable<br />
Energy Initial<br />
Cost<br />
RE Case Life-<br />
Cycle Cost<br />
Base Case<br />
Life-Cycle<br />
Cost<br />
RE Solution<br />
Case Return on<br />
investment<br />
Oroville, WA $10,415 $1,201,469 $1,254,894 44.8%<br />
Fabens, TX $46,957 $640,297 $777,609 27.4%<br />
Sasabe, AZ $32,691 $377,290 $456,025 23.3%<br />
Columbus, NM $95,087 $799,531 $976,752 19.9%<br />
Tecate, CA $224,279 $1,963,062 $2,367,343 19.7%<br />
Santa Teresa, NM $88,330 $2,422,683 $2,593,983 19.4%<br />
Donna TX (not built) $14,708 $280,294 $307,574 18.9%<br />
Paso Del Norte, TX $117,746 $2,496,897 $2,712,162 18.7%<br />
Baudette, MN $16,701 $120,794 $147,275 18.5%<br />
Calexico, CA $627,943 $6,069,151 $7,063,869 18.0%<br />
Ysleta, TX $259,146 $3,642,882 $4,089,669 18.0%<br />
Bridge of the Americas,<br />
TX<br />
$219,433 $5,081,708 $5,452,568 17.8%<br />
Calexico West, CA $162,695 $6,739,396 $7,013,550 17.7%<br />
Dalton Cache, AK $78,957 $1,399,128 $1,521,347 17.5%<br />
Nogales, AZ $124,450 $3,391,983 $3,578,824 16.5%<br />
McAllen, TX $44,664 $1,223,880 $1,290,185 16.4%<br />
Lukeville, AZ $95,330 $1,029,003 $1,154,779 15.7%<br />
Juarez-Lincoln, TX $316,588 $5,711,558 $6,146,785 15.6%<br />
Eagle Pass, TX $127,361 $1,661,380 $1,835,503 15.6%<br />
Raymond, MT $56,749 $1,930,963 $1,997,355 15.2%<br />
Los Indios, TX $163,432 $2,835,216 $3,046,057 15.1%<br />
Laredo TX $40,968 $1,000,052 $1,053,164 15.1%<br />
Alburg, VT (Joint<br />
ownership)<br />
$19,095 $64,251 $87,027 15.0%<br />
Rio Grande City, TX $52,686 $1,495,642 $1,562,354 14.9%<br />
Jamieson, NY $6,298 $38,897 $46,171 14.6%<br />
St. Francis, ME $6,517 $43,431 $50,393 14.4%<br />
Columbia, TX $543,397 $2,728,986 $3,318,599 14.1%<br />
Nogales, AZ $108,132 $4,411,255 $4,534,344 14.0%<br />
Fort Hancock, TX $34,852 $580,607 $617,218 14.0%<br />
Ambrose, ND $10,210 $142,785 $153,144 13.9%<br />
Noyes, MN $32,457 $398,807 $431,149 13.8%<br />
Skagway, AK $59,255 $890,982 $950,179 13.7%<br />
Convent, TX $62,574 $2,202,026 $2,265,586 13.1%<br />
Laurier, WA $31,892 $84,751 $115,171 13.1%<br />
Sweetgrass, MT $225,652 $926,893 $1,131,193 13.0%<br />
151
LPOE Site Name<br />
Table B-18: Return on Investment of RE Solutions<br />
(without incentives)<br />
Renewable<br />
Energy Initial<br />
Cost<br />
RE Case Life-<br />
Cycle Cost<br />
Base Case<br />
Life-Cycle<br />
Cost<br />
RE Solution<br />
Case Return on<br />
investment<br />
Otay Mesa, CA $1,000,242 $7,571,426 $8,525,158 12.7%<br />
Fort Kent, ME $112,520 $553,009 $649,941 12.6%<br />
Orient, ME $19,355 $77,119 $94,455 12.6%<br />
San Ysidro, CA $1,039,517 $10,407,761 $11,365,375 12.4%<br />
Beebe Plain, VT $10,345 $128,300 $137,465 12.4%<br />
Ogdensburg NY $377,470 $2,234,485 $2,569,924 12.3%<br />
Eastport, ID $57,326 $491,441 $538,000 12.3%<br />
St. John ND $9,675 $149,141 $156,946 12.2%<br />
Derby Line, VT $102,253 $453,948 $535,282 11.9%<br />
Fort Fairfield, ME $30,203 $310,294 $334,467 11.8%<br />
East Richford, VT $27,681 $235,045 $257,160 11.8%<br />
Limestone, ME $24,553 $215,812 $235,286 11.8%<br />
Ferry Point, ME $73,078 $797,020 $850,481 11.6%<br />
Pembina, ND $137,934 $3,221,645 $3,320,512 11.5%<br />
Roma, TX $85,057 $1,521,923 $1,587,054 11.5%<br />
Jackman, ME $32,959 $313,910 $337,700 11.5%<br />
Porthill, ID $24,445 $134,387 $151,440 11.3%<br />
San Luis, AZ $289,853 $2,253,582 $2,452,837 11.2%<br />
DOT, TX (leased) $189,091 $1,744,160 $1,878,746 11.2%<br />
Alcan, AK $403,956 $5,032,271 $5,302,416 11.1%<br />
Madawaska, ME $42,018 $508,829 $538,666 11.1%<br />
Derby Line, VT $34,673 99852,106 $876,501 11.1%<br />
Norton, VT $26,317 $425,853 $444,738 11.1%<br />
Del Rio, TX $288,329 $2,989,214 $3,192,497 11.0%<br />
Vanceboro, ME $48,446 $412,727 $445,136 10.9%<br />
VanBuren, ME $36,550 $329,151 $352,943 10.9%<br />
Beecher Falls, VT $41,812 $350,836 $378,661 10.8%<br />
Coburn Gore, ME $140,181 $546,031 $627,043 10.3%<br />
Highgate Springs 3, VT $12,905 $178,256 $186,327 10.3%<br />
Houlton, ME $174,282 $1,297,218 $1,392,579 10.2%<br />
Progreso, TX $81,634 $778,603 $826,572 10.2%<br />
Grand Portage, MN $73,841 $684,020 $726,801 10.2%<br />
St. Francis, ME $3,825 $56,893 $58,984 10.1%<br />
Naco, AZ $70,556 $656,596 $697,006 10.0%<br />
Richford, VT $36,618 $308,121 $329,003 10.0%<br />
Chateaugay, NY $28,841 $292,562 $307,451 9.8%<br />
Trout, River, NY $55,944 $371,460 $400,914 9.7%<br />
152
LPOE Site Name<br />
Table B-18: Return on Investment of RE Solutions<br />
(without incentives)<br />
Renewable<br />
Energy Initial<br />
Cost<br />
RE Case Life-<br />
Cycle Cost<br />
Base Case<br />
Life-Cycle<br />
Cost<br />
RE Solution<br />
Case Return on<br />
investment<br />
Canaan, VT $24,276 $248,095 $261,045 9.7%<br />
Niagra Falls, NY $1,383,426 $3,023,102 $3,746,085 9.6%<br />
Los Tomates, TX $1,131,309 $3,183,399 $3,791,946 9.5%<br />
St John Hwy, NY $70,551 $349,193 $383,476 9.5%<br />
Dunseith, ND $19,012 $222,609 $231,773 9.5%<br />
Douglas, AZ $220,785 $1,922,732 $2,033,183 9.4%<br />
Alburg Springs, VT $15,417 $135,159 $142,793 9.4%<br />
RR Inspection, TX $2,760 $12,963 $14,416 9.4%<br />
Fort Covington, NY $31,915 $300,255 $315,542 9.3%<br />
Andrade, CA $174,114 $613,811 $697,785 9.2%<br />
Gateway, TX $811,736 $2,590,613 $2,984,200 9.1%<br />
Champlain, NY $415,889 $12,769,725 $12,963,556 9.1%<br />
Massena, NY $109,903 $567,438 $615,736 9.1%<br />
Detroit Cargo, MI $77,868 $3,800,734 $3,839,007 9.1%<br />
West Berkshire,VT $32,551 $203,090 $217,239 8.9%<br />
Piegan, MT $137,642 $1,497,580 $1,557,310 8.8%<br />
Rouses Pt. NY $55,590 $419,324 $441,563 8.6%<br />
Mooers, NY $28,052 $225,304 $236,566 8.6%<br />
Kenneth Ward, WA $26,495 $517,919 $529,039 8.6%<br />
Highgate Springs 2, VT $107,349 $3,095,076 $3,137,323 8.5%<br />
Blaine, WA $188,460 $972,738 $1,040,623 8.3%<br />
Turner, MT $31,218 $49,283 $59,614 8.0%<br />
Point Robert, WA $176,860 $612,709 $667,543 7.9%<br />
Blaine, WA $162,654 $3,700,823 $3,755,228 7.9%<br />
Blaine, WA $119,368 $660,308 $695,963 7.8%<br />
Danville, WA $41,203 $203,316 $216,147 7.8%<br />
Alexandria Bay, NY $674,659 $2,744,416 $2,953,875 7.7%<br />
Brownsville/<br />
Matamoros, TX<br />
$466,410 $1,282,641 $1,428,943 7.7%<br />
Kika de la Garza, TX $1,054,667 $4,000,071 $4,290,611 7.4%<br />
Roseau, MN $104,341 $791,280 $817,759 7.4%<br />
North Troy, VT $24,896 $104,441 $110,418 7.2%<br />
Milltown, ME $7,955 $172,052 $173,937 7.2%<br />
Marfa, TX $315,565 $602,769 $670,371 6.9%<br />
Portal, ND $25,714 $418,026 $421,940 6.4%<br />
Intl Falls, MN $17,592 $303,514 $305,496 6.0%<br />
Chief Mt, MT $16,780 $1,140,375 $1,140,633 5.1%<br />
153
The following LPOE Sites did not have cost-effective applications of RE<br />
technologies.<br />
• Rooseville, MT,<br />
• Sumas, WA,<br />
• San Luis AZ (not built),<br />
• Intl Bridge, MI,<br />
• Amb. Bridge, MI,<br />
• El Paso, TX (out leased),<br />
• McAllen TX (not built),<br />
• Admin, TX (leased),<br />
• El Paso, TX (leased),<br />
• Mataline Falls. WA,<br />
• Highgate Springs 1, VT.<br />
154
Table B-19: ROI of RE Solutions by <strong>GSA</strong> Region<br />
(without incentives)<br />
<strong>GSA</strong> Region<br />
1 2 5 7 8 9 10 Grand Total<br />
RE<br />
Solutions<br />
Case Lifecycle<br />
Cost $13,989,463 $23,524,359 $8,871,273 $57,994,499 $10,212,440 $47,714,623 $17,025,517 $179,332,174<br />
Base Case<br />
Life-Cycle<br />
Cost $14,941,605 $25,004,919 $9,039,609 $63,225,183 $10,683,561 $52,247,654 $17,869,336 $193,011,868<br />
Average<br />
Return on<br />
investment<br />
(%) 10.4% 10.4% 8.2% 13.9% 10.0% 15.0% 11.6% 11.8%<br />
Table B-20 offers a snapshot of the number of technologies included in the<br />
optimized RE solutions by region and by technology. It is important to<br />
understand that for each LPOE site, a technology is only counted here if it is part<br />
of the optimized combination of RE solutions for that site.<br />
In other words, it is possible for an LPOE site to have the potential to generate<br />
biomass energy cost effectively. However, if it is more cost-effective to generate<br />
wind energy and use solar water heating at that LPOE site, then biomass energy<br />
will not be counted as an optimized technology for that site.<br />
Further more, the number of technologies counted in this table does not reflect<br />
the total amount of energy that each region has the potential to generate.<br />
Table B-20: Number of Technologies Included in Optimized RE Solutions<br />
(without incentives)<br />
Number of Sites by <strong>GSA</strong> Region<br />
RE Technology 1 2 5 7 8 9 10 Grand Total<br />
Daylighting 3 4 0 8 1 3 0 19<br />
Wind Energy 28 12 5 4 10 2 11 72<br />
Biomass Energy 22 9 2 26 3 12 8 82<br />
Solar Ventilation Air Preheat 23 9 1 10 4 10 8 65<br />
Solar Water Heating 3 1 0 1 1 2 0 8<br />
Solar Electric Photovoltaics 0 0 0 0 0 0 0 0<br />
Solar Industrial Process Heat 0 0 0 0 0 0 0 0<br />
155
Appendix C. Results of Life-Cycle Cost Optimization<br />
(with Financial Incentives)<br />
Results are presented both with and without financial incentives. <strong>GSA</strong> does not<br />
benefit directly from tax credits when paying for projects with appropriations.<br />
However, by partnering with an entity that does have a tax liability through an<br />
alternative financing mechanism such as an ESPC, the tax credits could improve<br />
the cost-effectiveness of the project. Tables in the body of the report and<br />
Appendix A and B are without incentives, and tables in Appendix C are withincentives.<br />
There are 4 types of incentives that are considered for each technology and at<br />
each site:<br />
1. Federal Business Investment Tax Credit (% of cost);<br />
2. State tax credit (% of cost);<br />
3. Rebate ($/watt or % of cost); and<br />
4. Production incentives ($/kWh produced).<br />
The 30% business investment tax credit is assumed for PV in the with-incentives<br />
case.<br />
Renewable Energy Credits (RECs) could be sold for the power generated from<br />
renewable sources, but these would be used to offset another organization’s<br />
goals, and thus it would be double-counting to say that <strong>GSA</strong> is using the<br />
renewable energy if the REC’s are sold.<br />
Incentives offered by federal and state governments, local utilities, and private<br />
organizations have a huge effect on solar project economics, and need to be<br />
taken into account even at this early planning stage. For this analysis,<br />
descriptions of incentives available at each LPOE site are taken from the<br />
Database for State Incentives for Renewable Energy [ref. 6]. These descriptions,<br />
however complicated, are approximated as a % reduction in initial cost, a $/watt<br />
or $/m 2 reduction in initial cost, a $/kWh production incentive, or a combination of<br />
the three. Incentives represented in this way modify the initial cost estimate or<br />
the annual cost savings estimate to calculate the life-cycle cost and payback<br />
period.<br />
Federal incentives are applied at all sites in the with-incentives case. State<br />
incentives considered include:<br />
• California Solar Initiative (San Diego tier)<br />
o 50kW: $0.32/kWh for 5 years<br />
156
• California Emerging Renewables Program<br />
o Wind: $2.5/W for first 7.5kW, then $1.50/W for additional kW up to<br />
30kW<br />
• NYSERDA Anaerobic Digester Rebate and PBI<br />
o $500/W and $0.10/kWh up to $1M<br />
• NYSERDA On-Site Small Wind<br />
o Max of $150,000 per site, for projects up to 250kW<br />
• NYSERDA PV Incentive Program<br />
o $4/W up to 25kW, building integrated PV are eligible for an<br />
additional $500/kW<br />
o Max incentive: $225,000<br />
• Vermont Solar and Small Wind Rebate Program<br />
o PV: $1.75/W up to $8,750<br />
o Wind: $4.50/w up to $20,000<br />
o SWH: up to $8,750<br />
• Vermont Green Mountain Power- Solar GMP for PV<br />
o $0.06/kWh for 20 years, up to 250kW<br />
It is important to note that most incentive and rebate programs have<br />
requirements, such as minimum or maximum size limitations or specific<br />
technology specifications, which a system must meet in order to qualify.<br />
Other forms of incentives include tax rebates and loan options. Sales and<br />
property tax rebates or exemptions exist, as do low and no interest loans. These<br />
loans can be applied towards the purchase and installation costs of a renewableenergy<br />
system.<br />
Net metering is another form of an incentive. It is an arrangement in which a<br />
utility provider credits a customer for generating electricity with a renewable<br />
technology and either using that electricity or feeding it into the local utility grid.<br />
• One method is when two meters are installed: one meter records<br />
electricity drawn from the grid while the other records excess electricity<br />
that’s generated by the customer and then fed to the grid. Generally in<br />
this type of arrangement the utility customer pays retail rates for the<br />
electricity they use, and they are paid wholesale rates for the electricity<br />
they generate and feed back into the grid.<br />
• Another net metering arrangement occurs when a single bi-directional<br />
meter is used to record electricity drawn from the grid (the meter would<br />
spin forward) as well as excess electricity from the renewable technology<br />
that is fed back into the grid (the meter would spin backward). For this<br />
157
type of arrangement the customer pays the retail price for any electricity<br />
used in excess of what they produce, and for any excess electricity<br />
produced by the customer, the utility provider pays for the electricity at its<br />
avoided cost, which is essentially the retail price.<br />
Table C-1 presents the initial costs for the optimized mix of RE technologies for<br />
each LPOE site. Table C-2 shows the size of each technology in the optimized<br />
mix for every LPOE site. Table C-3 compares the difference in size of the<br />
optimal solutions with and without financial incentives. Table C-4 shows the<br />
calculations for the return on investment for the optimized mix of RE solutions for<br />
each site.<br />
158
Table C-1: Initial Cost of RE Technology (with incentives)<br />
Table C-1: Initial Cost of RE Technology (with incentives)<br />
LPOE Site Name<br />
PV Initial<br />
Cost<br />
w/incentives<br />
Wind<br />
Initial<br />
Cost w/<br />
incentives<br />
Solar Vent<br />
Preheat<br />
Cost<br />
w/incentives<br />
Solar Water<br />
Heating<br />
Cost<br />
w/incentives<br />
Biomass<br />
Gasifier<br />
Cost<br />
w/incentives<br />
Daylighting<br />
Cost<br />
w/incentives<br />
Total Initial<br />
Cost<br />
Dalton Cache, AK $537,950 $1 $27,544 $30,397 $55 $19,267 $615,214<br />
Alcan, AK $1 $1 $91,166 $239,475 $55 $1 $330,700<br />
Skagway, AK $1 $1 $17,554 $25,018 $55 $8,757 $51,387<br />
Lukeville, AZ $1 $0 $1,944 $23,351 $40 $48,486 $73,822<br />
Nogales, AZ $1 $0 $1,944 $75,398 $40 $120,850 $198,233<br />
Sasabe, AZ $1 $0 $1,944 $4,045 $40 $21,024 $27,054<br />
Douglas, AZ $1 $0 $31,553 $45,646 $40 $77,813 $155,053<br />
San Luis, AZ $1 $0 $32,503 $56,974 $101,852 $69,113 $260,443<br />
Naco, AZ $1 $0 $6,964 $15,255 $40 $29,422 $51,682<br />
San Luis AZ (not built<br />
yet) $1 $0 $0 $0 $40 $0 $41<br />
Nogales, AZ $1 $0 $0 $111,512 $40 $108,131 $219,684<br />
Calexico West, CA $1 $0 $0 $141,182 $49 $162,694 $303,926<br />
San Ysidro, CA $2,028,297 $849,150 $0 $270,450 $49 $270,670 $3,418,616<br />
Andrade, CA $1 $131,347 $3,008 $12,065 $49 $12,947 $159,417<br />
Otay Mesa, CA $983,563 $849,150 $0 $160,171 $49 $405,135 $2,398,067<br />
Tecate, CA $255,478 $0 $32,905 $35,773 $82,546 $69,177 $475,879<br />
Calexico, CA $1 $0 $107,977 $134,132 $167,814 $206,908 $616,833<br />
Eastport, ID $1 $0 $34,418 $25,400 $45 $0 $59,864<br />
Porthill, ID $1 $0 $10,786 $5,398 $45 $0 $16,230<br />
Ferry Point, ME $0 $0 $34,077 $25,053 $40 $0 $59,171<br />
Coburn Gore, ME $0 $0 $6,039 $23,643 $62,127 $19,673 $111,482<br />
Fort Fairfield, ME $0 $25,260 $6,493 $8,266 $40 $8,266 $48,326<br />
Houlton, ME $0 $0 $61,185 $55,743 $64,731 $1 $181,660<br />
Jackman, ME $0 $0 $19,421 $10,024 $40 $0 $29,486<br />
Limestone, ME $0 $19,030 $4,773 $5,396 $40 $6,331 $35,570<br />
Orient, ME $0 $0 $4,452 $1,431 $40 $6,542 $12,466<br />
Vanceboro, ME $0 $24,276 $15,846 $14,655 $40 $9,855 $64,673<br />
VanBuren, ME $0 $0 $16,806 $11,796 $40 $0 $28,643<br />
Milltown ME $0 $0 $917 $2,803 $40 $1,560 $5,320<br />
St. Francis, ME $0 $0 $1,901 $1,104 $40 $0 $3,046<br />
Madawaska, ME $0 $0 $11,322 $15,744 $40 $12,352 $39,458<br />
Fort Kent, ME $0 $0 $11,310 $22,572 $70,826 $12,691 $117,400<br />
St. Francis, ME $0 $0 $711 $1,188 $40 $0 $1,939<br />
Detroit Cargo, MI $1 $0 $62,081 $0 $45 $77,868 $139,996<br />
159
Table C-1: Initial Cost of RE Technology (with incentives)<br />
LPOE Site Name<br />
PV Initial<br />
Cost<br />
w/incentives<br />
Wind<br />
Initial<br />
Cost w/<br />
incentives<br />
Solar Vent<br />
Preheat<br />
Cost<br />
w/incentives<br />
Solar Water<br />
Heating<br />
Cost<br />
w/incentives<br />
Biomass<br />
Gasifier<br />
Cost<br />
w/incentives<br />
Daylighting<br />
Cost<br />
w/incentives<br />
Total Initial<br />
Cost<br />
Intl Bridge, MI $1 $0 $105,404 $0 $45 $2 $105,452<br />
Amb. Bridge, MI $1 $0 $0 $0 $45 $471,075 $471,122<br />
Grand Portage, MN $1 $0 $34,594 $22,969 $49 $18,372 $75,985<br />
Noyes, MN $1 $0 $19,478 $14,879 $49 $0 $34,407<br />
Roseau, MN $1 $0 $62,625 $21,923 $49 $1 $84,599<br />
Intl Falls, MN $1 $0 $10,245 $9,557 $49 $0 $19,852<br />
Baudette, MN $1 $0 $7,327 $2,739 $49 $0 $10,116<br />
Chief Mt, MT $1 $219,431 $7,549 $0 $42 $0 $227,023<br />
Piegan, MT $1 $172,445 $18,350 $74,880 $42 $90,607 $356,324<br />
Raymond, MT $1 $0 $21,894 $118,174 $42 $1 $140,112<br />
Rooseville, MT $1 $0 $10,258 $390 $42 $1 $10,692<br />
Sweetgrass, MT $1 $0 $17,748 $23,820 $74,175 $58,033 $173,777<br />
Turner, MT $0 $9,464 $3,936 $490 $42 $10,091 $24,024<br />
Ambrose, ND $1 $0 $6,126 $5,453 $40 $0 $11,620<br />
Dunseith, ND $1 $0 $10,835 $7,666 $40 $0 $18,542<br />
Portal, ND $1 $0 $14,638 $0 $40 $0 $14,680<br />
St. John ND $1 $0 $5,103 $4,994 $40 $0 $10,138<br />
Pembina, ND $1 $0 $82,768 $118,768 $5 $1 $201,543<br />
Columbus, NM $1 $0 $19,048 $19,095 $41 $31,569 $69,754<br />
Santa Teresa, NM $1 $0 $36,269 $44,942 $41 $88,329 $169,583<br />
Alexandria Bay, NY $1 $379,418 $74,250 $36,671 $47 $64,198 $554,584<br />
Champlain, NY $1 $302,486 $145,492 $11,596 $47 $173,289 $632,911<br />
Massena, NY $1 $0 $30,330 $30,171 $47 $0 $60,548<br />
Fort Covington, NY $1 $50,194 $5,277 $6,283 $47 $7,812 $69,614<br />
Rouses Pt. NY $1 $0 $10,196 $11,728 $47 $13,318 $35,290<br />
St John Hwy, NY $1 $0 $21,804 $18,532 $47 $0 $40,385<br />
Trout, River, NY $1 $53,452 $11,306 $8,829 $47 $14,368 $88,003<br />
Chateaugay, NY $1 $0 $5,760 $7,810 $47 $0 $13,618<br />
Mooers, NY $1 $0 $4,809 $5,090 $47 $7,202 $17,149<br />
Jamieson, NY $1 $0 $1,530 $811 $47 $1,552 $3,941<br />
Niagra Falls, NY $1 $427,588 $182,394 $110,538 $89,807 $262,393 $1,072,721<br />
Ogdensburg BS $1 $0 $121,213 $33,628 $47 $175,361 $330,250<br />
Brownsville/Matamoros<br />
TX $1 $394,213 $0 $29,191 $39 $72,198 $495,641<br />
Gateway, TX $1 $690,677 $0 $0 $39 $121,059 $811,775<br />
160
Table C-1: Initial Cost of RE Technology (with incentives)<br />
LPOE Site Name<br />
PV Initial<br />
Cost<br />
w/incentives<br />
Wind<br />
Initial<br />
Cost w/<br />
incentives<br />
Solar Vent<br />
Preheat<br />
Cost<br />
w/incentives<br />
Solar Water<br />
Heating<br />
Cost<br />
w/incentives<br />
Biomass<br />
Gasifier<br />
Cost<br />
w/incentives<br />
Daylighting<br />
Cost<br />
w/incentives<br />
Total Initial<br />
Cost<br />
Columbia, TX $1 $567,630 $0 $92,148 $123,245 $252,593 $1,035,618<br />
Convent, TX $1 $0 $0 $41,299 $5 $62,573 $103,878<br />
Del Rio, TX $1 $0 $50,414 $103,795 $5 $136,352 $290,567<br />
Donna TX (not built<br />
yet) $1 $0 $0 $7,014 $5 $14,708 $21,727<br />
Bridge of the<br />
Americas, TX $1 $0 $0 $24,046 $5 $219,433 $243,484<br />
Eagle Pass, TX $1 $0 $0 $69,672 $5 $127,361 $197,039<br />
Fabens, TX $1 $0 $10,950 $10,614 $5 $15,729 $37,298<br />
Fort Hancock, TX $1 $0 $6,050 $13,151 $5 $7,170 $26,376<br />
El Paso, TX (out<br />
leased) $1 $0 $11,692 $4,107 $5 $14,295 $30,100<br />
Juarez-Lincoln, TX $1 $0 $0 $122,934 $5 $316,588 $439,528<br />
Los Indios, TX $1 $0 $0 $40,339 $5 $163,432 $203,777<br />
Laredo TX $1 $0 $0 $19,413 $5 $40,968 $60,387<br />
Los Tomates, TX $1 $933,797 $0 $0 $5 $197,511 $1,131,314<br />
McAllen, TX $1 $0 $0 $0 $5 $44,664 $44,669<br />
McAllen TX (not built<br />
yet) $1 $0 $0 $7,006 $5 $14,603 $21,615<br />
Marfa, TX $1 $173,533 $50,596 $22,289 $5 $34,951 $281,375<br />
Kika de la Garza, TX $1 $848,325 $0 $62,317 $5 $206,342 $1,116,990<br />
Paso Del Norte, TX $1 $0 $0 $43,018 $5 $117,745 $160,769<br />
Progreso, TX $1 $0 $0 $27,452 $5 $35,880 $63,338<br />
Roma, TX $1 $0 $0 $24,258 $5 $44,628 $68,892<br />
Rio Grande City, TX $1 $0 $0 $20,312 $5 $52,686 $73,003<br />
Ysleta, TX $1 $0 $0 $52,683 $5 $259,146 $311,834<br />
RR Inspection, TX $1 $0 $1,481 $277 $5 $2,760 $4,524<br />
Admin, TX (leased) $1 $0 $0 $69,799 $5 $79,230 $149,034<br />
El Paso, TX (Leased) $1 $0 $5,720 $14,339 $5 $11,351 $31,416<br />
DOT, TX (leased) $1 $0 $40,796 $55,435 $90,598 $72,904 $259,734<br />
Derby Line, VT $1 $0 $11,927 $34,048 $91,019 $13,963 $150,959<br />
Norton, VT $1 $0 $7,413 $12,617 $5 $12,198 $32,234<br />
Beebe Plain, VT $1 $0 $2,902 $3,730 $5 $4,545 $11,183<br />
Alburg Springs, VT $2,498 $0 $2,692 $3,517 $5 $4,898 $13,610<br />
North Troy VT $1 $0 $5,350 $4,235 $5 $7,274 $16,865<br />
West Berkshire,VT $1 $0 $6,787 $5,362 $5 $10,148 $22,302<br />
161
Table C-1: Initial Cost of RE Technology (with incentives)<br />
LPOE Site Name<br />
PV Initial<br />
Cost<br />
w/incentives<br />
Wind<br />
Initial<br />
Cost w/<br />
incentives<br />
Solar Vent<br />
Preheat<br />
Cost<br />
w/incentives<br />
Solar Water<br />
Heating<br />
Cost<br />
w/incentives<br />
Biomass<br />
Gasifier<br />
Cost<br />
w/incentives<br />
Daylighting<br />
Cost<br />
w/incentives<br />
Total Initial<br />
Cost<br />
Derby Line, VT $1 $0 $37,486 $18,289 $5 $24,057 $79,838<br />
Beecher Falls, VT $1 $0 $9,706 $9,667 $5 $11,985 $31,364<br />
Canaan, VT $1 $0 $4,385 $6,384 $5 $6,615 $17,390<br />
East Richford, VT $1 $0 $8,049 $6,421 $5 $10,725 $25,201<br />
Richford, VT $1 $0 $7,534 $8,487 $5 $10,231 $26,258<br />
Alburg, VT (Joint<br />
ownership) $1,184 $0 $5,841 $1,429 $5 $4,730 $13,189<br />
Highgate Springs 1, VT $1 $0 $1,683 $107 $5 $0 $1,796<br />
Highgate Springs 2, VT $1 $0 $41,920 $157,308 $131,374 $32,210 $362,813<br />
Highgate Springs 3, VT $1 $0 $3,751 $5,187 $5 $5,751 $14,695<br />
Blaine, WA $1 $0 $71,647 $43,913 $6 $50,389 $165,957<br />
Danville, WA $1 $0 $17,493 $6,794 $6 $11,590 $35,884<br />
Laurier, WA $1 $0 $8,754 $2,392 $6 $13,512 $24,665<br />
Mataline Falls. WA $1 $0 $7,896 $2,731 $6 $0 $10,634<br />
Oroville, WA $1 $0 $0 $9,739 $6 $2 $9,747<br />
Point Robert, WA $1 $0 $70,150 $29,280 $6 $43,680 $143,116<br />
Sumas, WA $1 $0 $23,711 $12,886 $6 $1 $36,604<br />
Blaine, WA $1 $0 $71,585 $26,643 $6 $1 $98,235<br />
Blaine, WA $1 $0 $55,052 $0 $6 $162,654 $217,713<br />
Kenneth Ward, WA $1 $0 $35,706 $0 $6 $26,495 $62,208<br />
$24,799,302.00<br />
*Anaerobic digestor and solar thermal are not cost effective with incentives.<br />
Note that each technology is recommended as part of the optimized solution for a<br />
site, and these sizes minimize life-cycle costs. In other words, it is possible for<br />
an LPOE site to cost effectively generate more RE than the optimized solution<br />
indicates, but the life cycle costs would be higher.<br />
162
Table C-2: Size of RE Technology that Minimizes Life-Cycle Cost by State (with incentives)<br />
Table C-2: Size of RE Technology that Minimizes Life-Cycle Cost by State<br />
(with incentives)<br />
LPOE Site Name<br />
PV<br />
Size<br />
(kW)<br />
Wind<br />
Capacity<br />
(kW)<br />
Solar<br />
Vent<br />
Preheat<br />
Area (ft 2 )<br />
Solar<br />
Water<br />
Heating<br />
Area (ft 2 )<br />
Biomass<br />
Gasifier<br />
Size (M<br />
Btu/h)<br />
Biomass<br />
Gasifier<br />
Cogen<br />
Size (kW)<br />
Daylighting<br />
non-Office<br />
Skylight/<br />
Floor Area<br />
Ratio<br />
Daylighting<br />
Office<br />
Skylight/<br />
Floor Area<br />
Ratio<br />
Dalton Cache, AK 0 0 1,275 694 0 0 4.2% 4.5%<br />
Alcan, AK 0 0 4,221 5,467 0 0 0.0% 0.0%<br />
Skagway, AK 0 0 813 571 0 0 4.3% 4.4%<br />
Lukeville, AZ 0 0 2,380 592 0 0 4.6% 4.2%<br />
Nogales, AZ 0 0 0 1,913 0 0 4.5% 3.5%<br />
Sasabe, AZ 0 0 1,035 185 0 0 4.5% 4.3%<br />
Douglas, AZ 0 0 1,623 1,158 0 0 4.5% 3.6%<br />
San Luis, AZ 0 0 1,672 1,445 0.17 18 4.7% 3.8%<br />
Naco, AZ 0 0 358 387 0 0 4.5% 4.1%<br />
San Luis AZ (not built<br />
yet)<br />
0 0 0 0 0 0 0.0% 0.0%<br />
Nogales, AZ 0 0 0 2,829 0 0 4.5% 3.3%<br />
Calexico West, CA 0 0 0 3,223 0 0 4.5% 3.7%<br />
San Ysidro, CA 467 1,000 0 7,772 0 0 4.5% 3.8%<br />
Andrade, CA 0 25 139 275 0 0 4.6% 4.4%<br />
Otay Mesa, CA 217 1,000 0 4,603 0 0 4.7% 3.9%<br />
Tecate, CA 52 0 1,523 1,028 0.11 12 4.6% 4.1%<br />
Calexico, CA 0 0 4,999 3,062 0.23 25 4.6% 2.9%<br />
Eastport, ID 0 0 1,593 580 0 0 0.0% 0.0%<br />
Porthill, ID 0 0 499 123 0 0 0.0% 0.0%<br />
Ferry Point, ME 0 0 1,578 589 0 0 0.0% 0.0%<br />
Coburn Gore, ME 0 0 280 557 0.1 11 4.6% 4.3%<br />
Fort Fairfield, ME 0 7 301 206 0 0 4.5% 4.4%<br />
Houlton, ME 0 0 2,833 1,290 0.1 11 0.0% 0.0%<br />
Jackman, ME 0 0 899 246 0 0 0.0% 0.0%<br />
Limestone, ME 0 5 221 140 0 0 4.5% 4.4%<br />
Orient, ME 0 0 206 44 0 0 4.5% 4.4%<br />
Vanceboro, ME 0 7 734 352 0 0 4.5% 4.3%<br />
VanBuren, ME 0 0 778 286 0 0 0.0% 0.0%<br />
Milltown ME 0 0 42 81 0 0 4.5% 4.5%<br />
St. Francis, ME 0 0 88 34 0 0 0.0% 0.0%<br />
Madawaska, ME 0 0 524 377 0 0 4.5% 4.3%<br />
Fort Kent, ME 0 0 524 532 0.11 12 4.5% 4.2%<br />
St. Francis, ME 0 0 33 36 0 0 0.0% 0.0%<br />
Detroit Cargo, MI 0 0 2,874 0 0 0 4.5% 3.0%<br />
Intl Bridge, MI 0 0 4,880 0 0 0 0.0% 0.0%<br />
163
Table C-2: Size of RE Technology that Minimizes Life-Cycle Cost by State<br />
(with incentives)<br />
LPOE Site Name<br />
PV<br />
Size<br />
(kW)<br />
Wind<br />
Capacity<br />
(kW)<br />
Solar<br />
Vent<br />
Preheat<br />
Area (ft 2 )<br />
Solar<br />
Water<br />
Heating<br />
Area (ft 2 )<br />
Biomass<br />
Gasifier<br />
Size (M<br />
Btu/h)<br />
Biomass<br />
Gasifier<br />
Cogen<br />
Size (kW)<br />
Daylighting<br />
non-Office<br />
Skylight/<br />
Floor Area<br />
Ratio<br />
Daylighting<br />
Office<br />
Skylight/<br />
Floor Area<br />
Ratio<br />
Amb. Bridge, MI 0 0 0 0 0 0 3.9% 4.5%<br />
Grand Portage, MN 0 0 1,602 524 0 0 4.5% 3.5%<br />
Noyes, MN 0 0 902 340 0 0 0.0% 0.0%<br />
Roseau, MN 0 0 2,899 501 0 0 0.0% 0.0%<br />
Intl Falls, MN 0 0 474 218 0 0 0.0% 0.0%<br />
Baudette, MN 0 0 339 63 0 0 0.0% 0.0%<br />
Chief Mt, MT 0 84 538 0 0 0 0.0% 0.0%<br />
Piegan, MT 0 61 1,307 1,710 0 0 2.7% 3.0%<br />
Raymond, MT 0 0 1,559 2,698 0 0 0.0% 0.0%<br />
Rooseville, MT 0 0 731 9 0 0 0.0% 0.0%<br />
Sweetgrass, MT 0 0 1,264 544 0.11 12 4.5% 4.5%<br />
Turner, MT 0 2 280 11 0 0 4.4% 4.2%<br />
Ambrose, ND 0 0 284 124 0 0 0.0% 0.0%<br />
Dunseith, ND 0 0 502 175 0 0 0.0% 0.0%<br />
Portal, ND 0 0 678 0 0 0 0.0% 0.0%<br />
St. John ND 0 0 236 114 0 0 0.0% 0.0%<br />
Pembina, ND 0 0 3,832 2,712 0 0 0.0% 0.0%<br />
Columbus, NM 0 0 882 436 0 0 4.9% 4.5%<br />
Santa Teresa, NM 0 0 1,679 1,026 0 0 5.4% 4.2%<br />
Alexandria Bay, NY 0 131 3,437 906 0 0 4.7% 3.6%<br />
Champlain, NY 0 105 6,736 333 0 0 5.4% 3.2%<br />
Massena, NY 0 0 1,404 757 0 0 0.0% 0.0%<br />
Fort Covington, NY 0 13 244 191 0 0 4.5% 4.2%<br />
Rouses Pt. NY 0 0 472 336 0 0 4.5% 4.0%<br />
St John Hwy, NY 0 0 1,009 492 0 0 0.0% 0.0%<br />
Trout, River, NY 0 14 523 269 0 0 4.5% 4.0%<br />
Chateaugay, NY 0 0 267 238 0 0 0.0% 0.0%<br />
Mooers, NY 0 0 223 155 0 0 4.5% 4.2%<br />
Jamieson, NY 0 0 94 25 0 0 4.9% 5.2%<br />
Niagra Falls, NY 0 148 8,444 2,592 0.12 13 3.8% 4.5%<br />
Ogdensburg, NY 0 0 5,612 836 0 0 6.2% 4.5%<br />
Brownsville/<br />
Matamoros, TX<br />
0 102 0 666 0 0 5.5% 4.5%<br />
Gateway, TX 0 209 0 0 0 0 5.6% 4.0%<br />
Columbia, TX 0 163 0 2,104 0.21 23 5.2% 4.4%<br />
Convent, TX 0 0 0 943 0 0 4.5% 3.2%<br />
Del Rio, TX 0 0 2,334 2,370 0 0 5.5% 3.6%<br />
164
Table C-2: Size of RE Technology that Minimizes Life-Cycle Cost by State<br />
(with incentives)<br />
LPOE Site Name<br />
Donna TX (not built<br />
yet)<br />
Bridge of the<br />
Americas, TX<br />
PV<br />
Size<br />
(kW)<br />
Wind<br />
Capacity<br />
(kW)<br />
Solar<br />
Vent<br />
Preheat<br />
Area (ft 2 )<br />
Solar<br />
Water<br />
Heating<br />
Area (ft 2 )<br />
Biomass<br />
Gasifier<br />
Size (M<br />
Btu/h)<br />
Biomass<br />
Gasifier<br />
Cogen<br />
Size (kW)<br />
Daylighting<br />
non-Office<br />
Skylight/<br />
Floor Area<br />
Ratio<br />
Daylighting<br />
Office<br />
Skylight/<br />
Floor Area<br />
Ratio<br />
0 0 0 160 0 0 4.9% 4.5%<br />
0 0 0 549 0 0 5.6% 3.2%<br />
Eagle Pass, TX 0 0 0 1,591 0 0 5.3% 3.9%<br />
Fabens, TX 0 0 507 242 0 0 5.0% 4.4%<br />
Fort Hancock, TX 0 0 280 300 0 0 4.6% 4.4%<br />
El Paso, TX (out<br />
leased)<br />
0 0 541 94 0 0 4.7% 4.5%<br />
Juarez-Lincoln, TX 0 0 0 2,807 0 0 5.4% 3.3%<br />
Los Indios, TX 0 0 0 921 0 0 5.5% 3.9%<br />
Laredo TX 0 0 0 443 0 0 5.1% 4.4%<br />
Los Tomates, TX 0 307 0 0 0 0 5.7% 4.0%<br />
McAllen, TX 0 0 0 0 0 0 5.2% 4.2%<br />
McAllen TX (not built<br />
yet)<br />
0 0 0 160 0 0 4.8% 4.7%<br />
Marfa, TX 0 36 2,342 509 0 0 4.3% 4.0%<br />
Kika de la Garza, TX 0 272 0 1,423 0 0 5.5% 4.0%<br />
Paso Del Norte, TX 0 0 0 982 0 0 5.6% 3.4%<br />
Progreso, TX 0 0 0 627 0 0 4.5% 3.6%<br />
Roma, TX 0 0 0 554 0 0 4.5% 3.3%<br />
Rio Grande City, TX 0 0 0 464 0 0 4.5% 3.2%<br />
Ysleta, TX 0 0 0 1,203 0 0 5.8% 3.4%<br />
RR Inspection, TX 0 0 69 6 0 0 4.5% 4.5%<br />
Admin, TX (leased) 0 0 0 1,594 0 0 4.5% 3.3%<br />
El Paso, TX (Leased) 0 0 265 327 0 0 4.5% 4.2%<br />
DOT, TX (leased) 0 0 1,889 1,266 0.15 16 4.5% 3.0%<br />
Derby Line, VT 0 0 552 777 0.15 16 4.5% 3.7%<br />
Norton, VT 0 0 343 288 0 0 4.5% 5.1%<br />
Beebe Plain, VT 0 0 134 85 0 0 4.5% 4.2%<br />
Alburg Springs, VT 0 0 125 80 0 0 4.6% 4.3%<br />
North Troy VT 0 0 248 97 0 0 4.5% 3.7%<br />
West Berkshire,VT 0 0 314 122 0 0 4.5% 4.3%<br />
Derby Line, VT 0 0 1,735 418 0 0 4.7% 3.3%<br />
Beecher Falls, VT 0 0 449 221 0 0 4.5% 3.9%<br />
Canaan, VT 0 0 203 146 0 0 4.5% 4.3%<br />
East Richford, VT 0 0 373 147 0 0 4.5% 3.9%<br />
165
Table C-2: Size of RE Technology that Minimizes Life-Cycle Cost by State<br />
(with incentives)<br />
LPOE Site Name<br />
PV<br />
Size<br />
(kW)<br />
Wind<br />
Capacity<br />
(kW)<br />
Solar<br />
Vent<br />
Preheat<br />
Area (ft 2 )<br />
Solar<br />
Water<br />
Heating<br />
Area (ft 2 )<br />
Biomass<br />
Gasifier<br />
Size (M<br />
Btu/h)<br />
Biomass<br />
Gasifier<br />
Cogen<br />
Size (kW)<br />
Daylighting<br />
non-Office<br />
Skylight/<br />
Floor Area<br />
Ratio<br />
Daylighting<br />
Office<br />
Skylight/<br />
Floor Area<br />
Ratio<br />
Richford, VT 0 0 349 194 0 0 4.5% 4.0%<br />
Alburg, VT (Joint<br />
ownership)<br />
0 0 270 33 0 0 4.2% 4.5%<br />
Highgate Springs 1, VT 0 0 78 2 0 0 0.0% 0.0%<br />
Highgate Springs 2, VT 0 0 1,941 3,591 0.22 24 4.4% 2.8%<br />
Highgate Springs 3, VT 0 0 174 118 0 0 4.4% 4.0%<br />
Blaine, WA 0 0 3,317 1,003 0 0 4.9% 4.2%<br />
Danville, WA 0 0 810 155 0 0 4.7% 4.1%<br />
Laurier, WA 0 0 405 55 0 0 4.6% 4.2%<br />
Mataline Falls. WA 0 0 366 62 0 0 0.0% 0.0%<br />
Oroville, WA 0 0 0 222 0 0 0.0% 0.0%<br />
Sumas, WA 0 0 1,098 294 0 0 0.0% 0.0%<br />
Blaine, WA 0 0 3,314 608 0 0 0.0% 0.0%<br />
Blaine, WA 0 0 2,549 0 0 0 5.7% 4.4%<br />
Kenneth Ward, WA 0 0 1,653 0 0 0 5.1% 4.8%<br />
*Solar thermal and solar thermal electric were not cost effective at any LPOE<br />
sites with incentives.<br />
Note that each technology is recommended as part of the optimized solution for a<br />
site, and these sizes minimize life-cycle costs. In other words, it is possible for<br />
an LPOE site to cost effectively generate more RE than the optimized solution<br />
indicates, but the life cycle costs would be higher.<br />
166
Table C-3: Size of RE Solutions (with and without incentives)<br />
Without<br />
Tax Incentives<br />
With<br />
Tax Incentives<br />
Skylight Area (sf) 190,951 209,666<br />
Wind Energy (kW) 2,491 3,689<br />
Solar Ventilation Air Preheat (sf) 93,265 119,652<br />
Solar Water Heating (sf) 28,464 90,703<br />
Biomass Gasification Boiler (MBH) 1.3 1.8<br />
Biomass Gasification Cogen (kW) 134 193<br />
PV (kW) 0 737<br />
Biomass Anaerobic Digester (ft 3 ), Biomass Anaerobic Digester Cogen (kW),<br />
Solar Thermal Electric, and Solar Thermal Parabolic Trough technologies were<br />
not found to be cost-effective at any LPOE sites even with incentives. PV was<br />
cost effective at 3 sites when incentives were considered:<br />
• San Ysidro, CA (467 kW),<br />
• Otay Mesa, CA (217 kW), and<br />
• Tecate, CA (52 kW).<br />
The resultant table is not included here as the preponderance of entries show PV<br />
as not cost effective given the evaluation criteria.<br />
Note that each technology is recommended as part of the optimized solution for a<br />
site, and these sizes minimize life-cycle costs. In other words, it is possible for<br />
an LPOE site to cost effectively generate more RE than the optimized solution<br />
indicates, but the life cycle costs would be higher.<br />
167
Table C-4: Return on Investment for RE Solutions (with incentives)<br />
Table C-4: Return on Investment for RE Solutions<br />
(with incentives)<br />
Name<br />
Renewable<br />
Energy<br />
Initial Cost<br />
($)<br />
RE Life<br />
Cycle O&M<br />
Cost ($)<br />
Life Cycle<br />
Biomass<br />
Fuel Cost<br />
($)<br />
RE Life<br />
Cycle Gas<br />
Cost ($)<br />
RE Life<br />
Cycle<br />
Electric Cost<br />
($)<br />
Post-Tax RE<br />
Case Life-<br />
Cycle Cost<br />
($)<br />
Post-Tax<br />
Basecase<br />
Life-Cycle<br />
Cost ($)<br />
Return on<br />
investment<br />
(%)<br />
Oroville, WA $9,747 $1,341 $3 $0 $1,202,343 $781,821 $815,681 36.40%<br />
Fabens, TX $37,298 $1,460 $3 $139,984 $482,523 $411,716 $505,446 27.60%<br />
Baudette, MN $10,115 $449 $26 $0 $105,301 $74,823 $95,729 25.00%<br />
Columbus, NM $69,754 $2,685 $26 $148,322 $588,537 $506,752 $634,889 22.30%<br />
St. Francis, ME $3,046 $276 $26 $4,279 $36,030 $27,718 $32,755 21.50%<br />
Jamieson, NY $3,941 $223 $26 $17,371 $19,165 $24,452 $30,011 18.70%<br />
Alburg, VT (joint<br />
ownership)<br />
$12,944 $228 $3 $0 $46,530 $38,677 $56,568 18.60%<br />
St. Francis, ME $1,939 $291 $26 $13,319 $42,173 $35,816 $38,339 18.40%<br />
Chateaugay, NY $13,618 $1,498 $184 $101,741 $186,673 $185,048 $199,843 16.50%<br />
Fort Hancock, TX $26,375 $1,807 $3 $98,866 $467,675 $373,046 $401,192 16.00%<br />
St John Hwy, NY $40,385 $3,018 $26 $168,826 $142,932 $211,550 $249,259 15.10%<br />
Sweetgrass, MT $173,777 $164,696 $40,046 $2 $523,869 $575,022 $735,276 14.80%<br />
Laurier, WA $24,664 $336 $3 $0 $54,226 $51,450 $74,861 14.80%<br />
Orient, ME $12,466 $336 $26 $11,875 $53,664 $49,426 $61,396 14.70%<br />
VanBuren, ME $28,643 $1,790 $26 $91,275 $208,584 $203,566 $229,413 14.70%<br />
Noyes, MN $34,406 $2,108 $26 $120,682 $250,045 $250,108 $280,247 14.50%<br />
Massena, NY $60,548 $4,608 $26 $38,463 $439,607 $346,904 $400,228 14.50%<br />
Derby Line, VT $79,838 $2,509 $3 $144,095 $224,594 $276,576 $347,934 14.40%<br />
Bridge of the Americas,<br />
TX<br />
$243,484 $3,296 $3 $1,583,662 $3,569,154 $3,313,941 $3,544,169 14.30%<br />
Jackman, ME $29,486 $1,547 $26 $2 $270,809 $194,956 $219,505 14.10%<br />
Ambrose, ND $11,620 $820 $26 $59,013 $77,460 $89,866 $99,544 14.10%<br />
McAllen, TX $44,669 $9 $3 $30,393 $1,166,614 $797,357 $838,620 14.10%<br />
Ysleta, TX $311,834 $7,210 $6 $707,932 $2,779,835 $2,382,202 $2,658,285 13.80%<br />
Paso Del Norte, TX $160,769 $5,889 $3 $211,041 $2,183,994 $1,630,441 $1,762,905 13.30%<br />
Beecher Falls, VT $31,363 $1,331 $3 $72,582 $250,919 $222,267 $246,130 13.00%<br />
Ogdensburg NY $330,249 $5,081 $184 $378,412 $1,538,420 $1,416,168 $1,670,450 12.90%<br />
Madawaska, ME $39,458 $2,329 $26 $139,003 $341,293 $322,223 $350,133 12.60%<br />
Raymond, MT $140,112 $16,226 $26 $1,236,980 $675,155 $1,203,447 $1,298,281 12.60%<br />
St. John ND $10,138 $757 $26 $45,119 $98,879 $95,171 $102,015 12.60%<br />
Donna TX (not built ) $21,726 $968 $3 $20,749 $244,750 $183,810 $199,923 12.60%<br />
McAllen TX (not built) $21,614 $967 $3 $20,707 $244,919 $183,822 $199,923 12.60%<br />
Roma, TX $68,891 $3,325 $3 $3,870 $1,447,273 $982,057 $1,031,585 12.60%<br />
Santa Teresa, NM $169,583 $6,217 $26 $3,675 $2,251,018 $1,568,132 $1,686,089 12.30%<br />
Fort Kent, ME $117,400 $164,322 $39,590 $143,564 $111,858 $349,093 $422,461 12.00%<br />
Mooers, NY $17,148 $1,003 $26 $59,985 $152,734 $142,650 $153,768 12.00%<br />
168
Table C-4: Return on Investment for RE Solutions<br />
(with incentives)<br />
Name<br />
Renewable<br />
Energy<br />
Initial Cost<br />
($)<br />
RE Life<br />
Cycle O&M<br />
Cost ($)<br />
Life Cycle<br />
Biomass<br />
Fuel Cost<br />
($)<br />
RE Life<br />
Cycle Gas<br />
Cost ($)<br />
RE Life<br />
Cycle<br />
Electric Cost<br />
($)<br />
Post-Tax RE<br />
Case Life-<br />
Cycle Cost<br />
($)<br />
Post-Tax<br />
Basecase<br />
Life-Cycle<br />
Cost ($)<br />
Return on<br />
investment<br />
(%)<br />
East Richford, VT $25,201 $887 $3 $55,872 $160,275 $150,528 $167,154 12.00%<br />
Richford, VT $26,257 $1,169 $3 $84,947 $206,161 $196,608 $213,852 12.00%<br />
Canaan, VT $17,390 $882 $3 $61,198 $176,414 $158,625 $169,679 11.90%<br />
Rouses Pt., NY $35,290 $2,088 $26 $171,575 $229,483 $264,806 $287,016 11.80%<br />
Progreso, TX $63,338 $3,761 $3 $215,081 $523,709 $497,352 $537,272 11.80%<br />
Houlton, ME $181,660 $154,597 $34,965 $69,211 $824,074 $802,043 $905,176 11.60%<br />
DOT, TX (leased) $259,733 $224,255 $85,105 $144,925 $986,301 $1,068,667 $1,221,185 11.60%<br />
Los Indios, TX $203,776 $5,523 $3 $73,867 $2,600,711 $1,853,271 $1,979,937 11.50%<br />
Rio Grande City, TX $73,003 $2,786 $3 $4,451 $1,425,134 $970,472 $1,015,530 11.50%<br />
Beebe Plain, VT $11,183 $519 $3 $45,770 $78,015 $82,603 $89,352 11.50%<br />
Milltown ME $5,320 $561 $26 $13,918 $153,038 $109,963 $113,059 11.40%<br />
Juarez-Lincoln, TX $439,528 $16,811 $3 $241,944 $5,117,020 $3,727,748 $3,995,410 11.40%<br />
Niagra Falls, NY $1,072,720 $209,376 $42,019 $130,237 $1,376,446 $1,818,025 $2,434,955 11.30%<br />
El Paso, TX (out leased) $30,100 $571 $3 $8,528 $1,962,810 $1,289,215 $1,306,938 11.30%<br />
Limestone, ME $35,570 $1,579 $26 $92,393 $89,865 $132,134 $152,936 11.20%<br />
Del Rio, TX $290,567 $14,196 $3 $511,703 $2,221,514 $1,907,529 $2,075,123 11.20%<br />
Portal, ND $14,679 $75 $26 $75,344 $335,560 $266,441 $274,261 11.10%<br />
Eagle Pass, TX $197,038 $9,532 $3 $363,756 $1,160,808 $1,079,835 $1,193,077 11.10%<br />
Blaine, WA $98,235 $3,651 $3 $23,106 $497,621 $400,278 $452,376 11.10%<br />
Grand Portage, MN $75,984 $3,214 $26 $238,514 $392,214 $433,262 $472,420 10.80%<br />
Dunseith, ND $18,542 $1,123 $26 $25,503 $178,013 $141,387 $150,652 10.80%<br />
Laredo TX $60,386 $2,663 $3 $2,360 $945,194 $651,772 $684,557 10.80%<br />
West Berkshire,VT $22,302 $742 $3 $48,128 $136,805 $129,234 $141,205 10.80%<br />
Blaine, WA $165,956 $6,011 $3 $91,783 $671,314 $595,397 $676,405 10.50%<br />
Pembina, ND $201,543 $16,242 $3 $1,367,604 $1,838,664 $2,063,780 $2,158,333 10.40%<br />
Point Robert, WA $143,116 $4,011 $3 $4,787 $413,220 $365,950 $433,903 10.40%<br />
Vanceboro, ME $64,673 $3,087 $26 $145,558 $210,862 $258,888 $289,338 10.30%<br />
Norton, VT $32,233 $1,734 $3 $142,305 $270,974 $273,526 $289,080 10.30%<br />
Highgate Springs 3, VT $14,695 $718 $3 $79,142 $95,113 $114,017 $121,113 10.30%<br />
Roseau, MN $84,598 $3,071 $26 $170,639 $534,961 $494,305 $531,543 10.10%<br />
Alburg Springs, VT $13,186 $542 $3 $54,876 $74,914 $86,841 $92,815 10.00%<br />
Turner, MT $24,024 $336 $26 $0 $19,438 $28,630 $38,749 9.70%<br />
Derby Line, VT $150,958 $215,705 $49,690 $166,701 $254,749 $512,621 $569,725 9.60%<br />
Danville, WA $35,884 $938 $3 $6,817 $152,322 $126,113 $140,495 9.60%<br />
Alexandria Bay, NY $554,584 $22,466 $26 $15,544 $2,055,651 $1,713,705 $1,920,019 9.10%<br />
Admin, TX (leased) $149,034 $9,549 $3 $65,276 $3,126,952 $2,154,097 $2,207,059 9.00%<br />
Convent, TX $103,878 $5,654 $3 $63,705 $2,064,851 $1,436,701 $1,472,631 8.90%<br />
169
Table C-4: Return on Investment for RE Solutions<br />
(with incentives)<br />
Name<br />
Renewable<br />
Energy<br />
Initial Cost<br />
($)<br />
RE Life<br />
Cycle O&M<br />
Cost ($)<br />
Life Cycle<br />
Biomass<br />
Fuel Cost<br />
($)<br />
RE Life<br />
Cycle Gas<br />
Cost ($)<br />
RE Life<br />
Cycle<br />
Electric Cost<br />
($)<br />
Post-Tax RE<br />
Case Life-<br />
Cycle Cost<br />
($)<br />
Post-Tax<br />
Basecase<br />
Life-Cycle<br />
Cost ($)<br />
Return on<br />
investment<br />
(%)<br />
North Troy VT $16,865 $588 $3 $96,563 $3,894 $65,976 $71,772 8.90%<br />
Champlain, NY $632,910 $15,637 $26 $4,129,693 $8,655,304 $8,225,057 $8,426,312 8.50%<br />
Columbia, TX $1,035,618 $335,529 $118,212 $464,794 $1,004,516 $1,851,926 $2,157,089 8.40%<br />
Los Tomates, TX $1,131,314 $39,821 $3 $50,885 $2,041,062 $2,115,756 $2,464,765 8.40%<br />
Trout, River, NY $88,003 $3,463 $26 $88,116 $201,043 $237,329 $260,594 8.00%<br />
Gateway, TX $811,775 $27,144 $26 $59,317 $1,756,132 $1,717,320 $1,939,730 8.00%<br />
Marfa, TX $281,374 $7,681 $3 $94,151 $205,050 $373,681 $435,741 7.50%<br />
RR Inspection, TX $4,523 $47 $3 $3,032 $5,761 $8,364 $9,370 7.50%<br />
El Paso, TX (Leased) $31,415 $1,969 $3 $14,615 $652,472 $450,207 $457,041 7.50%<br />
Highgate Springs 2, VT $362,812 $333,870 $77,549 $1,309,396 $1,206,884 $1,968,643 $2,039,260 7.40%<br />
Intl Bridge, MI $105,452 $75 $184 $605,855 $958,217 $1,012,939 $1,031,382 7.10%<br />
Blaine, WA $217,712 $9 $3 $95,114 $3,427,535 $2,402,906 $2,440,898 7.00%<br />
Kenneth Ward, WA $62,207 $9 $3 $78,985 $387,562 $333,247 $343,875 7.00%<br />
Detroit Cargo, MI $139,995 $75 $26 $1,343,348 $2,572,480 $2,472,189 $2,495,355 6.90%<br />
Intl Falls, MN $19,851 $1,381 $26 $78,214 $216,375 $195,483 $198,572 6.90%<br />
Fort Covington, NY $69,613 $2,862 $26 $71,967 $166,732 $193,996 $205,102 6.80%<br />
Brownsville/<br />
Matamoros, TX<br />
$495,641 $17,276 $184 $25,343 $779,816 $854,874 $928,813 6.70%<br />
Piegan, MT $356,324 $18,270 $26 $863,360 $396,055 $966,914 $1,012,252 6.50%<br />
Kika de la Garza, TX $1,116,990 $43,738 $3 $92,511 $2,841,093 $2,646,591 $2,788,897 6.40%<br />
Mataline Falls. WA $10,634 $383 $3 $133 $31,790 $27,828 $28,899 6.20%<br />
Chief Mt, MT $227,022 $10,910 $26 $466,854 $498,577 $729,432 $741,412 5.60%<br />
Amb. Bridge, MI $471,121 $75 $184 $258,745 $472,024 $754,683 $770,497 5.30%<br />
Highgate Springs 1, VT $1,796 $24 $3 $0 $4,428 $4,056 $4,026 4.70%<br />
Sumas, WA $36,604 $1,771 $3 $226,577 $680,946 $585,852 $585,364 4.70%<br />
The following LPOE sites were not suitable for cost-effective RE solutions with<br />
incentives:<br />
• San Luis, AZ (not built);<br />
• Rooseville, MT;<br />
• Highgate Springs 1,<br />
• VT; Sumas, WA.<br />
170
References<br />
[1] Geological Information System (GIS) database of renewable energy resource<br />
information, http://www.nrel.gov/gis/. Accessed May 2009.<br />
[2] Energy Price Indices and Discount Factors for Life-Cycle Cost Analysis,<br />
Annual Supplement to Handbook 135 (ASHB 135),<br />
http://www1.eere.energy.gov/femp/information/download_blcc.html. Accessed<br />
May 2009.<br />
[3] ANSI/ASHRAE Standard 62.1-2007, Ventilation for Acceptable Indoor Air<br />
Quality American Society of Refrigeration Air Conditioning and Heating<br />
Engineers, GA, http://www.ashrae.org/pressroom/detail/16298. Accessed May<br />
2009.<br />
[4] Energy Information Administration. Commercial Building Energy Consumption<br />
Survey, http://www.eia.doe.gov/emeu/cbecs/. Accessed May 2009.<br />
[5] IES HB-9-2000 IESNA Lighting Handbook, http://www.iesna.org/store/.<br />
Accessed May 2009.<br />
[6] Database of State Incentives for Renewable Energy, North Carolina State<br />
University, www.dsireusa.org. Accessed May 2009.<br />
[7] RS Means Green Building Project Planning and Cost Estimating, 2006,<br />
http://www.rsmeans.com/bookstore/detail.asp?sku=67338A, Accessed May<br />
2009.<br />
[8] Power Technologies Energy Data Book, Edition Four,<br />
http://www.nrel.gov/analysis/power_databook/. Accessed May 2009.<br />
[9] US Dept of Energy Office of Building Technologies, 2008 Building Energy<br />
Databook, http://buildingsdatabook.eren.doe.gov/. Accessed May 2009<br />
[10] Renewable Energy Technology Characterizations, EPRI Topical Report No.<br />
TR-109496, (http://www1.eere.energy.gov/ba/pba/tech_characterizations.html.<br />
Accessed May 2009.<br />
[11] Mortensen, J. Factors Associated with Photovoltaic System Costs, NREL/TP<br />
620.29649, Page 3, June 2001, (They are highly reliable and last 20 years or<br />
longer.)<br />
[12] Christensen, C.; Barker, G. Annual System Efficiencies For Solar Water<br />
Heating, Golden CO: National Renewable Energy Laboratory.<br />
171
[13] Emissions from Integrated MSW Strategies,<br />
http://www.p2pays.org/ref/11/10516/emissions.html. Accessed May 2009.<br />
[14] Volume 2 : Energy Table 2.2 Default Emission Factors for Stationary<br />
Combustion in the Energy Industries (kg of greenhouse gas per TJ on a Net<br />
Calorific Basis), http://www.ipccnggip.iges.or.jp/public/2006gl/pdf/2_Volume2/V2_2_Ch2_Stationary_Combustion<br />
.pdf. Accessed May 2005.<br />
[15] PG&E Available Funding and Program Statistics<br />
http://www.pge.com/mybusiness/energysavingsrebates/selfgenerationincentive/a<br />
vailablefundingandprogramstatistics.shtml. Accessed May 2009<br />
[16] Gas Appliance Manufacturer’s Association, http://www.gamanet.org/ .<br />
Accessed May 2009.<br />
[17] NREL Biomass Plant Costs, Letter Report: Boulder, CO: Econergy<br />
International Agency. November 13, 2007. www.econergy.com. Accessed May<br />
2009.<br />
172