the entire issue - McGill Science Undergraduate Research Journal ...
the entire issue - McGill Science Undergraduate Research Journal ...
the entire issue - McGill Science Undergraduate Research Journal ...

Create successful ePaper yourself
Turn your PDF publications into a flip-book with our unique Google optimized e-Paper software.
Ilya Feige<br />
Discussion<br />
The systematic error in <strong>the</strong> intensity<br />
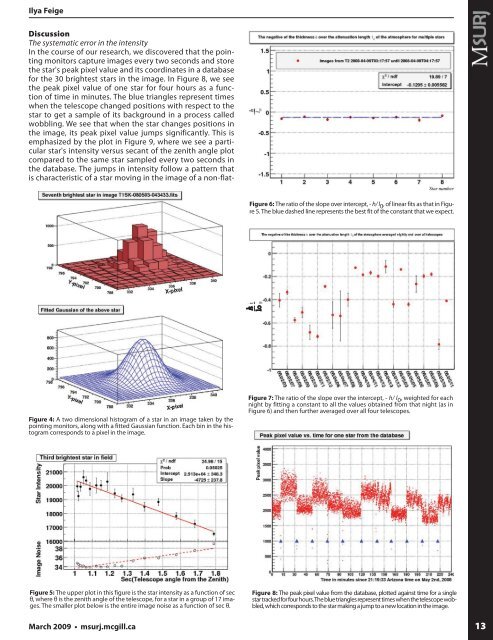
In <strong>the</strong> course of our research, we discovered that <strong>the</strong> pointing<br />
monitors capture images every two seconds and store<br />
<strong>the</strong> star's peak pixel value and its coordinates in a database<br />
for <strong>the</strong> 30 brightest stars in <strong>the</strong> image. In Figure 8, we see<br />
<strong>the</strong> peak pixel value of one star for four hours as a function<br />
of time in minutes. The blue triangles represent times<br />
when <strong>the</strong> telescope changed positions with respect to <strong>the</strong><br />
star to get a sample of its background in a process called<br />
wobbling. We see that when <strong>the</strong> star changes positions in<br />
<strong>the</strong> image, its peak pixel value jumps significantly. This is<br />
emphasized by <strong>the</strong> plot in Figure 9, where we see a particular<br />
star's intensity versus secant of <strong>the</strong> zenith angle plot<br />
compared to <strong>the</strong> same star sampled every two seconds in<br />
<strong>the</strong> database. The jumps in intensity follow a pattern that<br />
is characteristic of a star moving in <strong>the</strong> image of a non-flat-<br />
Figure 6: The ratio of <strong>the</strong> slope over intercept, - h/ l 0 , of linear fits as that in Figure<br />
5. The blue dashed line represents <strong>the</strong> best fit of <strong>the</strong> constant that we expect.<br />
Figure 4: A two dimensional histogram of a star in an image taken by <strong>the</strong><br />
pointing monitors, along with a fitted Gaussian function. Each bin in <strong>the</strong> histogram<br />
corresponds to a pixel in <strong>the</strong> image.<br />
Figure 7: The ratio of <strong>the</strong> slope over <strong>the</strong> intercept, - h/ l 0 , weighted for each<br />
night by fitting a constant to all <strong>the</strong> values obtained from that night (as in<br />
Figure 6) and <strong>the</strong>n fur<strong>the</strong>r averaged over all four telescopes.<br />
Figure 5: The upper plot in this figure is <strong>the</strong> star intensity as a function of sec<br />
θ, where θ is <strong>the</strong> zenith angle of <strong>the</strong> telescope, for a star in a group of 17 images.<br />
The smaller plot below is <strong>the</strong> <strong>entire</strong> image noise as a function of sec θ.<br />
Figure 8: The peak pixel value from <strong>the</strong> database, plotted against time for a single<br />
star tracked for four hours. The blue triangles represent times when <strong>the</strong> telescope wobbled,<br />
which corresponds to <strong>the</strong> star making a jump to a new location in <strong>the</strong> image.<br />
March 2009 • msurj.mcgill.ca<br />
13