Lake Cathie Coastal Hazard Study Appendix D - Hastings Council
Lake Cathie Coastal Hazard Study Appendix D - Hastings Council
Lake Cathie Coastal Hazard Study Appendix D - Hastings Council

You also want an ePaper? Increase the reach of your titles
YUMPU automatically turns print PDFs into web optimized ePapers that Google loves.
<strong>Appendix</strong> D – <strong>Hazard</strong> Assessment<br />
1<br />
<strong>Lake</strong> <strong>Cathie</strong> <strong>Coastal</strong> Zone Management Plan: <strong>Coastal</strong> <strong>Hazard</strong> <strong>Study</strong> Report – <strong>Appendix</strong> D – November 2010
<strong>Lake</strong> <strong>Cathie</strong> <strong>Coastal</strong> <strong>Hazard</strong> <strong>Study</strong> – <strong>Appendix</strong> D<br />
Table of Contents<br />
1 Introduction ............................................................................................... 3<br />
2 <strong>Hazard</strong> Assessment .................................................................................. 4<br />
2.1 Introduction ................................................................................................................ 4<br />
2.2 Short term erosion ..................................................................................................... 4<br />
2.3 Long Term Recession ................................................................................................ 5<br />
2.4 Oceanic Inundation .................................................................................................... 6<br />
2.5 Site observations ....................................................................................................... 7<br />
3 Comparison with Previous Assessments .............................................. 9<br />
3.1 Introduction ................................................................................................................ 9<br />
3.2 Storm Erosion ............................................................................................................ 9<br />
3.3 Long Term Recession ................................................................................................ 9<br />
3.4 Oceanic Inundation .................................................................................................. 10<br />
4 Calculation of <strong>Hazard</strong> Limits.................................................................. 11<br />
5 Summary and Conclusions ................................................................... 12<br />
6 References .............................................................................................. 13<br />
List of Figures<br />
D.1 Dune Stability Schema<br />
D.2 Extreme Storm events vs. Photogrammetry Dates<br />
D.3 Maximum wave runup<br />
D.4 Undercutting of coffee rock platform by wave action, November 2007<br />
D.5 Evidence of stormwater erosion path through coffee rock embankment,<br />
November 2007<br />
D.6 Present Day <strong>Hazard</strong> Zones<br />
D.7 2050 <strong>Hazard</strong> Zones<br />
D.8 2100 <strong>Hazard</strong> Zones<br />
D.9 2100 <strong>Coastal</strong> <strong>Hazard</strong> Planning Area assuming no sea level rise<br />
List of Tables<br />
D.1 Wave Runup levels for <strong>Lake</strong> <strong>Cathie</strong>, 0.1% AEP storm event<br />
2<br />
<strong>Lake</strong> <strong>Cathie</strong> <strong>Coastal</strong> Zone Management Plan: <strong>Coastal</strong> <strong>Hazard</strong> <strong>Study</strong> Report – <strong>Appendix</strong> D – November 2010
1 Introduction<br />
The principal hazards induced by the coastal processes that are pertinent to a coastal<br />
hazard risk assessment of the beach at <strong>Lake</strong> <strong>Cathie</strong> include:<br />
<br />
<br />
<br />
short-term coastal erosion including that resulting from severe storms, the<br />
behaviour of estuary entrances and slope instability;<br />
long term coastline recession including that resulting from aeolian sand<br />
transport and climate change; and<br />
oceanic inundation of low lying areas.<br />
In this <strong>Appendix</strong>, the coastal hazards are synthesised and applied for the present day,<br />
2050 and 2100 planning periods at <strong>Lake</strong> <strong>Cathie</strong>. A sensitivity analysis is carried out to<br />
examine the relative impact of sea level rise on the locations of the coastal hazard zones.<br />
3<br />
<strong>Lake</strong> <strong>Cathie</strong> <strong>Coastal</strong> Zone Management Plan: <strong>Coastal</strong> <strong>Hazard</strong> <strong>Study</strong> Report – <strong>Appendix</strong> D – November 2010
2 <strong>Hazard</strong> Assessment<br />
2.1 Introduction<br />
The delineation of the coastal hazard at <strong>Lake</strong> <strong>Cathie</strong> has been determined in accordance<br />
with the stability criteria in Nielsen et al. (1992), as described in <strong>Appendix</strong> B and illustrated<br />
in Figure D.1.<br />
2.2 Short term erosion<br />
2.2.1 Design Storm Erosion Demand<br />
The design storm erosion demand has been based empirically on the measured erosion<br />
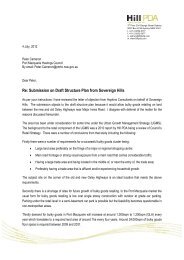
from the photogrammetry data between 1963 and 1983. Several large storms occurred<br />
during the period between 1963 and 1983, as shown in Figure D.2. These storms included<br />
the June 1967 storms which impacted greatly on the NSW north coast, and the storms of<br />
May-June 1974 whose impacts were greatest felt on the NSW central coast. In the current<br />
investigation, photogrammetry data from 1967 or 1974 was not available. For this reason,<br />
volume changes between the photogrammetric data of 1963 and 1983 were analysed to<br />
estimate a storm erosion demand.<br />
The storms of May-June 1974 caused widespread damage to coastal structures and<br />
beaches along the central coast of New South Wales (Foster et al., 1975). These storms<br />
were associated with an intense low pressure cell adjacent to the coast near Sydney.<br />
Because nearshore waves causing dune erosion are depth-limited, wave duration of<br />
moderate wave heights becomes a more important factor for dune erosion than peak<br />
offshore wave heights of short duration. It was the long duration of moderately high waves<br />
that made this particular 1974 storm so destructive. The 1974 storm event was coincident<br />
with maximum spring tides, with a maximum storm surge measured at Fort Denison of<br />
0.59 m and a maximum ocean water level of 1.48 m on AHD (Kulmar and Nalty, 1997).<br />
This makes it suitable for use as a design event for <strong>Lake</strong> <strong>Cathie</strong>.<br />
At other locations in NSW, a relationship between beach erosion and whether an adjacent<br />
river entrance is open or closed has been found – such a relationship was found at<br />
Shoalhaven Heads on the NSW south coast (SMEC Australia, 2007). It was found that<br />
more beach erosion occurred when a coastal storm event coincides with an open<br />
entrance. It is likely that there is a similar relationship between the state of the beach at<br />
<strong>Lake</strong> <strong>Cathie</strong> and whether the lake entrance is open or closed.<br />
Equivalent storm erosion volumes were obtained from the analysis for the beachfront<br />
areas along the entire length of beach fronting the urban areas of <strong>Lake</strong> <strong>Cathie</strong>. Analysis of<br />
the photogrammetric data between 1963 and 1983 showed that up to 160 m 3 /m of erosion<br />
had occurred over this time period. Superimposed onto the storm erosion demand is the<br />
signature of long term erosion, which has been estimated in <strong>Appendix</strong> B at 1.5 m 3 /m/year.<br />
Over the twenty years of data between 1963 and 1983, the impact of long term erosion<br />
would have contributed around 30 m 3 /m to the 160 m 3 /m measured over this time period.<br />
As long term recession is already being considered in quantifying the hazard zones for<br />
<strong>Lake</strong> <strong>Cathie</strong>, approximately 130 m 3 /m of the measured erosion between 1963 and 1983<br />
could therefore be attributed to storm erosion demand. A maximum storm erosion demand<br />
value of 130 m 3 /m was therefore adopted for the June 1967 and May-June 1974 storms<br />
4<br />
<strong>Lake</strong> <strong>Cathie</strong> <strong>Coastal</strong> Zone Management Plan: <strong>Coastal</strong> <strong>Hazard</strong> <strong>Study</strong> Report – <strong>Appendix</strong> D – November 2010
at <strong>Lake</strong> <strong>Cathie</strong>. This value is lower than commonly reported storm erosion demand values<br />
at other open coast sandy beaches along the NSW coast (typically 200 – 250 m 3 /m). The<br />
reason for this is the presence of indurated sands, which are relatively resistant to erosion<br />
when compared with typical unconsolidated beach sand. However, it should be noted that<br />
the indurated sands at <strong>Lake</strong> <strong>Cathie</strong> are generally only weakly consolidated, and they<br />
would still be subject to potential collapse during a storm event. It is considered that a<br />
storm that would lead to the design storm erosion demand has a very low risk of being<br />
exceeded over the next 50 years, given that the measured storm erosion demand was<br />
based on the combined effects of the 1967 and 1974 storm events.<br />
2.2.2 Estuary Entrance Instability <strong>Hazard</strong><br />
Short term beach fluctuations can be enhanced at natural estuary entrances, such as at<br />
the entrance to <strong>Lake</strong> <strong>Cathie</strong>. Estuary entrance instability has been examined in<br />
<strong>Appendix</strong> B, and it was found that this hazard is restricted to the zone along the beach<br />
berm at the entrance to <strong>Lake</strong> <strong>Cathie</strong>. The entrance has tended to open along the northern<br />
side of this zone, where the underlying indurated sand strata acts as a natural barrier<br />
against northward entrance migration. At the southern end of this zone, an embankment<br />
stabilised by dumping of rock in the 1960’s (NSW Public Works, 1990) acts as a barrier to<br />
southward entrance migration. It was found that the lake entrance instability hazard is<br />
confined to the area comprising the existing entrance berm, and the probability that a<br />
major flood or future storm event could cause breakthrough at unexpected locations is<br />
low. Outside of the berm area, the lake entrance dynamics may influence the dune<br />
erosion, though the escarpment crests are above 8m AHD and storm overwash of these<br />
areas is extremely unlikely. Any influences of lake entrance dynamics on storm erosion<br />
are already incorporated in the design storm erosion demand.<br />
2.3 Long Term Recession<br />
2.3.1 Measured Long Term Changes<br />
From examination of the photogrammetric data, on average, there has been a steady<br />
decline in subaerial beach volumes between 1940 and 2004, with an average decline of<br />
90 m 3 /m at Block 1 and 110m 3 /m at Block 2. It can be seen that the changes are relatively<br />
well correlated for both of the photogrammetric blocks. If the beach volume change since<br />
1940 were averaged for all Blocks, a line of best fit drawn through all the data would<br />
indicate that there has been a net volume decrease since 1940 of between 0.8 and 2.1<br />
m 3 /m/year. This indicates, on average, that long term dune recession is occurring at <strong>Lake</strong><br />
<strong>Cathie</strong>. For an average embankment height of 8 m, this represents a long term recession<br />
rate of between 0.1 and 0.26 m/year.<br />
Examination of the rate of migration of the 4.0m and 5.0m AHD contours yielded a<br />
recession rate of 0.14 to 0.20 m/year. Averaged over the whole beach, the recession rate<br />
is approximately 0.17 m/year. For an average escarpment height of 8m, this equates to<br />
around 1.2 to 1.6 m 3 /m/year of volumetric erosion, indicating a good agreement with the<br />
volumetric analysis.<br />
Allowing for long term beach recession due to climate change-induced sea level rise that<br />
has already occurred would reduce the above values by 0.05 m/year (± 0.03 m/year),<br />
giving an upper limiting long term recession value of around 0.2 m/year (refer<br />
<strong>Appendix</strong> B).<br />
5<br />
<strong>Lake</strong> <strong>Cathie</strong> <strong>Coastal</strong> Zone Management Plan: <strong>Coastal</strong> <strong>Hazard</strong> <strong>Study</strong> Report – <strong>Appendix</strong> D – November 2010
Based on the uncertainty associated with limitations in the data, a conservative long term<br />
recession rate estimate of 0.2 m/y was adopted for <strong>Lake</strong> <strong>Cathie</strong>. This long term recession<br />
rate has been assumed to determine the location of hazard lines for future planning for<br />
this hazard study.<br />
2.3.2 Beach Rotation<br />
Beach fluctuations caused by beach rotation over the distance between <strong>Lake</strong> <strong>Cathie</strong><br />
entrance and Middle Rock were estimated to reach 60m over the sandy portion of the<br />
beach – for a beach berm height of 2.0m AHD, this represents a sand volume fluctuation<br />
of approximately ±120 m 3 /m (<strong>Appendix</strong> C). However, beach rotation at <strong>Lake</strong> <strong>Cathie</strong> would<br />
be limited due to the presence of the Pleistocene indurated sand barrier, which cannot<br />
erode as readily as unconsolidated marine sands in response to changes in nearshore<br />
wave direction. In addition, beach rotation would be limited by the presence of the rock<br />
outcrops along the beach, such as at Middle Rock, which control the beach planform; and<br />
the presence of the lake entrance, which acts as a discontinuity for longshore sediment<br />
transport. Beach rotation may also be taking place north of the lake entrance. The<br />
signature of the medium-term oscillations in sub-aerial beach sand store caused by<br />
decadal variations in the SOI and the fluctuations resulting from minor storm events has<br />
been removed from the photogrammetric data record by the signature of long term<br />
recession.<br />
2.3.3 Climate Change<br />
The possibility of increased storm wave heights has been investigated as part of this<br />
study. Hennessy et al. (2004) do not predict any increase in winter storm wind speeds for<br />
the NSW coast. The background to this is provided in <strong>Appendix</strong> C.<br />
Foreshore recession resulting from a Greenhouse-induced sea level rise has been<br />
assessed using the Bruun Rule (<strong>Appendix</strong> C). For an upper-range sea level rise scenario<br />
in line with the Draft NSW Sea Level Rise Policy Statement, the total beach recession<br />
relative to 2005 levels expected would be 17 metres by 2050 and 42 metres by 2100.<br />
This equates to an annual erosion rate of around 3.0 m 3 /m/year to 2050, increasing to 3.5<br />
m 3 /m/year by 2100.<br />
It should be noted that these recession rates assume that the dune is composed of<br />
erodible material – in reality, the Pleistocene indurated sand barrier (coffee rock) is more<br />
resistant to erosion than typical unconsolidated beach sands – so the rates of beach<br />
recession that would actually occur due to sea level rise may be less than what is<br />
estimated above.<br />
2.4 Oceanic Inundation<br />
Design incident wave conditions for the assessment of wave runup were determined for a<br />
maximum deepwater offshore wave height corresponding to the 0.1% AEP (Annual<br />
Exceedence Probability). From long term wave statistics as measured at the Sydney<br />
directional Waverider buoy (which is representative of the study region), this corresponds<br />
to an offshore deepwater significant wave height of around 11 m. As the <strong>Lake</strong> <strong>Cathie</strong><br />
coastline is fairly exposed to swell waves, it can be assumed that the peak wave height<br />
reached offshore at <strong>Lake</strong> <strong>Cathie</strong> would be similar to what could be expected at Sydney.<br />
6<br />
<strong>Lake</strong> <strong>Cathie</strong> <strong>Coastal</strong> Zone Management Plan: <strong>Coastal</strong> <strong>Hazard</strong> <strong>Study</strong> Report – <strong>Appendix</strong> D – November 2010
Wave runup levels at <strong>Lake</strong> <strong>Cathie</strong> were estimated using the Automated <strong>Coastal</strong><br />
Engineering Software (ACES). The wave runup module of ACES was used to determine<br />
the levels, which assumes a smooth slope, linear beach.<br />
The nearshore boundary conditions for ACES that have been adopted for various<br />
locations along the beach are shown in Table D.1. The assumed nearshore beach profile<br />
is measured from approximately 10 m below AHD to the top of the dune, to obtain a<br />
beach slope for use in the wave runup calculation. The runup was added to the nearshore<br />
water level, which included an allowance for wave setup and wind setup. The maximum<br />
expected wave runup and 2% wave runup (runup level exceeded by 2% of waves) is<br />
given in Table D.1.<br />
Table D.1 – Wave Runup levels for <strong>Lake</strong> <strong>Cathie</strong>, 0.1% AEP storm event<br />
Wave Transformation Coefficient 1.0<br />
Deepwater significant Wave Height (m) 11.0<br />
Nearshore Water Level (m AHD) 2.0<br />
Nearshore Beach Slope 1:50<br />
Maximum Wave Runup Level (m AHD) 5.5<br />
2% Wave Runup Level (m AHD) 5.3<br />
Significant Wave Runup Level (m AHD) 4.5<br />
From these results, it can be seen that the maximum expected wave runup level along the<br />
beach is around 5.5 m AHD. From the photogrammetric data and from the Aerial Laser<br />
Scan survey data provided by Port Macquarie-<strong>Hastings</strong> <strong>Council</strong>, this indicates that, at a<br />
maximum, wave runup would not overtop the existing dune embankment and there would<br />
be no impact on dwellings or other infrastructure (except for the stormwater outlets that<br />
drain to the beach). The only area that would experience inundation due to wave runup<br />
would be the sand berm area at the entrance to <strong>Lake</strong> <strong>Cathie</strong>. Figure D.3 shows the<br />
expected limit of maximum wave runup for the 0.1% AEP storm event.<br />
There are no dwellings that may be subject to coastal inundation from <strong>Lake</strong> <strong>Cathie</strong> during<br />
storm events. A flood study of <strong>Lake</strong> <strong>Cathie</strong> carried out by NSW Public Works (1984)<br />
found that peak flood levels at the ocean entrance could reach 2.4m above AHD for an<br />
open entrance, and 2.5m above AHD for a closed entrance. <strong>Council</strong>’s entrance<br />
management policy of opening the entrance when lake water levels reach 1.5m above<br />
AHD ensures that private dwellings are not impacted by coastal inundation.<br />
2.5 Site observations<br />
In addition to the assessment of coastal hazards by analysis of the available<br />
photogrammetric data, site observations were made that indicated further potential<br />
erosion hazards. Site visits in July, August and November of 2007 showed that significant<br />
undercutting of the coffee rock platform was occurring in some locations by wave action,<br />
as shown in Figure D.4. Such undercutting would weaken the structural integrity of the<br />
coffee rock platform and could cause block failure of entire sections along joint<br />
7<br />
<strong>Lake</strong> <strong>Cathie</strong> <strong>Coastal</strong> Zone Management Plan: <strong>Coastal</strong> <strong>Hazard</strong> <strong>Study</strong> Report – <strong>Appendix</strong> D – November 2010
weaknesses through the coffee rock strata. This would lead to sudden failure of large<br />
areas of embankment in some areas.<br />
Further evidence of embankment instability can be seen in Figure D.5, which shows an<br />
area of roadway above the embankment eroding. This would imply that there is loss of<br />
roadway material though the embankment and that there are fractures leading directly<br />
through the coffee rock embankment and onto the beach.<br />
While the long term rate of failure of the embankment and sudden failure of embankment<br />
sections is taken into account in the photogrammetric data analysis and estimated design<br />
storm erosion value, it is difficult to estimate the precise rate of erosion of the coffee rock<br />
and the locations in which sudden embankment failure could occur.<br />
In addition to embankment instability caused by undercutting by wave action, large scour<br />
holes were observed at the locations of stormwater outlets, which appear to be<br />
exacerbating embankment instability.<br />
8<br />
<strong>Lake</strong> <strong>Cathie</strong> <strong>Coastal</strong> Zone Management Plan: <strong>Coastal</strong> <strong>Hazard</strong> <strong>Study</strong> Report – <strong>Appendix</strong> D – November 2010
3 Comparison with Previous Assessments<br />
3.1 Introduction<br />
Previous assessments of photogrammetric data at and around <strong>Lake</strong> <strong>Cathie</strong> have been<br />
carried out by NSW Public Works (1990, 1991). These assessments were purely an<br />
analysis of photogrammetric data, at Bonny Hills (south of Middle Rock) and <strong>Lake</strong> <strong>Cathie</strong><br />
(NSW Public Works, 1990); and at northern Lighthouse Beach (NSW Public Works,<br />
1991).<br />
The Bonny Hills – <strong>Lake</strong> <strong>Cathie</strong> assessment identified long term recession from 1940 to<br />
1988 on a profile-by-profile basis, and found average long term recession rates north of<br />
Middle Rock of around 0.1 – 0.2 m/year. It also found accelerated long term recession of<br />
around 0.3 m/year occurring immediately offshore of Illaroo Road and adjacent to the<br />
<strong>Lake</strong> <strong>Cathie</strong> entrance. This assessment also identified the dumping of rock adjacent to the<br />
southern end of the entrance which may have masked the longer-term recessional trend<br />
for this area. No short-term storm erosion demand values are estimated.<br />
The northern Lighthouse Beach assessment (NSW Public Works, 1991) showed that at<br />
the northern end of the beach (outside the study area), there was no clear trend of long<br />
term erosion or accretion of the dune, though there were localised recession rates of up to<br />
0.3 m/year at individual locations. The frontal dune along parts of north Lighthouse Beach<br />
was subject to sand mining in the late 1950’s and early 1960’s and it is commented that<br />
this may have impacted the results.<br />
The NSW Public Works (1991) assessment assumed a design storm erosion demand<br />
figure of 200 m 3 /m, based on data from other open coast beaches throughout NSW. That<br />
study also noted that there was considerable dune instability due to blow-outs and that a<br />
site specific assessment of storm erosion demand could not be made, due to the fact that<br />
the photographic records for the study area did not adequately capture the effects of<br />
severe storm events. It assumed a long-term recession rate of 0.25m/year, based on a<br />
general recession of the back-dune escarpment by around 11m.<br />
3.2 Storm Erosion<br />
This assessment found a design storm erosion volume for <strong>Lake</strong> <strong>Cathie</strong> of around<br />
130 m 3 /m from photogrammetric data. This value is less than the 200 m 3 /m adopted for<br />
the northern end of Lighthouse Beach in NSW Public Works (1991), due primarily to the<br />
nature of the indurated coffee rock substratum which is more resistant to erosion than<br />
typical unconsolidated beach sands.<br />
3.3 Long Term Recession<br />
3.3.1 Historic Rates<br />
From this assessment, a conservative allowance has been made for historic long term<br />
recession for the beach of 0.2 m/year. This compares with the average rate of recession<br />
of 0.25m/year assessed for northern Lighthouse Beach (NSW Public Works, 1991), and is<br />
similar to the rate of long term recession measured for <strong>Lake</strong> <strong>Cathie</strong> between 1940 and<br />
9<br />
<strong>Lake</strong> <strong>Cathie</strong> <strong>Coastal</strong> Zone Management Plan: <strong>Coastal</strong> <strong>Hazard</strong> <strong>Study</strong> Report – <strong>Appendix</strong> D – November 2010
1988 in NSW Public Works (1990). The rate of dune recession may be slowing, due to the<br />
more resistant nature of the coffee rock sediments to erosion.<br />
3.3.2 Climate Change<br />
There are no previous estimates of the impact of Climate Change on the beach at <strong>Lake</strong><br />
<strong>Cathie</strong>. However, for northern Lighthouse Beach (NSW Public Works, 1991), an estimate<br />
of recession due to sea level rise of between 20 m and 60 m was given. That estimate<br />
used the Bruun Rule with an offshore slope of 1:50, which is the same as that adopted for<br />
this study. However, Intergovernmental Panel for Climate Change (IPCC, 2007) sea level<br />
rise estimates for the next 100 years have been revised downwards since the early<br />
1990’s. This study estimates a beach recession of around 42 metres for an upper-range<br />
sea level rise scenario.<br />
3.4 Oceanic Inundation<br />
The maximum value of wave runup adopted for <strong>Lake</strong> <strong>Cathie</strong> was 5.5m AHD, with 2%<br />
wave runup of 5.3m AHD and significant wave runup of 4.5m AHD. No private property is<br />
at risk of inundation due to wave runup, as the embankment height is well above 7m AHD.<br />
No previous assessments of wave runup have been made.<br />
10<br />
<strong>Lake</strong> <strong>Cathie</strong> <strong>Coastal</strong> Zone Management Plan: <strong>Coastal</strong> <strong>Hazard</strong> <strong>Study</strong> Report – <strong>Appendix</strong> D – November 2010
4 Calculation of <strong>Hazard</strong> Limits<br />
The limits of the Zone of Wave Impact and Slope Adjustment and the Zone of Reduced<br />
Foundation Capacity have been calculated using the values for design storm erosion<br />
demand, with reference to Figure D.1, for the 2050 and 2100 planning periods, adding the<br />
estimated recession allowed for as a result of sea level rise prognoses as advocated by<br />
the Draft Sea Level Rises Policy and measured long term recession.<br />
To obtain the location of the various zones, average values of the different profiles would<br />
normally have been used as the different beaches are accreting. However, the several<br />
anthropogenic influences (sand mining, dune stabilisation, etc.) would have distorted the<br />
average result. Therefore, the most recent profile (2007) has been used for the<br />
determination of the hazard lines. These have been checked using the ALS data, which<br />
provides a greater density of data (although this data is dated from 2005). The immediate<br />
hazard limits due to the design storm erosion volume are shown in Figure D.6. They have<br />
been calculated in terms of chainage along each profile.<br />
The immediate hazard limits due to the design storm erosion volume are shown in Figure<br />
D.6. They have been calculated in terms of chainage along beach profile.<br />
For the 2050 and 2100 planning periods, long term beach recession and sea level rise<br />
limits were added to the design storm recession for several locations along the beach, to<br />
determine the seaward limits of the Zone of Reduced Foundation Capacity and Stable<br />
Foundation Zone. Figures D.7 and D.8 illustrate the hazard limits for 2050 and 2100.<br />
As required by the “Draft <strong>Coastal</strong> Risk Management Guide: Incorporating sea level rise in<br />
coastal risk assessments” we have defined a “coastal hazard planning area” assuming no<br />
sea level rise based on the 2100 underlying long term recession rate. This map is shown<br />
in Figure D.9.<br />
11<br />
<strong>Lake</strong> <strong>Cathie</strong> <strong>Coastal</strong> Zone Management Plan: <strong>Coastal</strong> <strong>Hazard</strong> <strong>Study</strong> Report – <strong>Appendix</strong> D – November 2010
5 Summary and Conclusions<br />
The assessment of coastal hazards has concluded that no private dwelling is at<br />
immediate risk of storm damage. However, parts of the roadway of Illaroo Road lie<br />
seaward of the edge of the Zone of Wave Impact and Slope Adjustment (Figure D.6), as<br />
do parts of the water supply infrastructure for the dwellings on Illaroo Road.<br />
Parts of some of the existing dwellings on Illaroo Road lie within the immediate hazard line<br />
for the Zone of Reduced Foundation Capacity, with around 16 dwellings affected.<br />
There are no properties at risk from coastal inundation due to wave runup.<br />
For the 2050 planning period, the Zone of Reduced Foundation Capacity encroaches onto<br />
the lots behind Illaroo Road. About 10 additional lots are partly subject to reduced<br />
foundation capacity. Some 17 properties along Illaroo Road have a portion of a dwelling<br />
extending into the Zone of Slope Adjustment, and the roadway of Illaroo Road is at risk<br />
(Figure D.7).<br />
For the 2100 planning period, around 32 dwellings located around Illaroo Road may<br />
become at risk with around 15 dwellings behind those fronting Illaroo Road lying within the<br />
Zone of Slope Adjustment. Some 40 dwellings along the northern end of Chepana Street<br />
would lie partially within the Zone of Slope Adjustment. Some 50 lots along Chepana<br />
Street and a few additional lots behind IIIaroo Road may be subject to reduced foundation<br />
capacity. (Figure D.8)<br />
No infrastructure north of the entrance to <strong>Lake</strong> <strong>Cathie</strong> is at risk from coastal hazards<br />
within the next 100 years, except for the viewing platform and walking tracks within the<br />
reserve.<br />
For the 2100 planning period assuming no sea level rise (Figure D.9), the location of the<br />
hazard lines is similar to the 2050 coastal hazard zones which include both long term<br />
beach recession and sea level rise (Figure D.7). Some 17 properties along IIIaroo Road<br />
would lie partly within the Zone of Slope Adjustment, and the roadway of IIIaroo Road<br />
would be at risk. Some lots behind those fronting IIIaroo Road are subject to reduced<br />
foundation capacity. No property along Chepana Street is affected.<br />
12<br />
<strong>Lake</strong> <strong>Cathie</strong> <strong>Coastal</strong> Zone Management Plan: <strong>Coastal</strong> <strong>Hazard</strong> <strong>Study</strong> Report – <strong>Appendix</strong> D – November 2010
6 References<br />
Foster, D.N., Gordon, A.D., Lawson, N.V. (1975) “The Storms of May-June 1974, Sydney,<br />
N.S.W.”, Second Australian Conference on <strong>Coastal</strong> and Ocean Engineering, Gold Coast<br />
Queensland, April 27 – May 1 1975.<br />
Hennessy, K., K. McInnes, D. Abbs, R. Jones, J. Bathols, R. Suppiah, J. Ricketts, T.<br />
Rafter, D. Collins* and D. Jones* (2004). “Climate Change in New South Wales Part 2:<br />
Projected changes in climate extremes” Consultancy report for the New South Wales<br />
Greenhouse Office by Climate Impact Group, CSIRO Atmospheric Research and<br />
*National Climate Centre, Australian Government Bureau of Meteorology, November 2004<br />
Kulmar, M. and Nalty, C. (1997), “New South Wales Coast, May 1997 Storm Analysis”<br />
Report MHL886, December 1997.<br />
IPCC (2007). “Climate Change 2007 – The Physical Science Basis, Fourth Assessment<br />
Report of Working Group 1 of the Intergovernmental Panel on Climate Change”,<br />
Cambridge University Press, Cambridge, United Kingdom and New York, NY, USA. 2007.<br />
Nielsen, A.F., D.B.Lord & H.G. Poulos (1992). “Dune Stability Considerations for Building<br />
Foundations”, ", IEAust., Aust. Civ. Eng. Trans., Vol. CE 34, No. 2 pp 167-173.<br />
NSW Public Works (1984). “<strong>Lake</strong> <strong>Cathie</strong> Flood <strong>Study</strong>”, Report no. 84010,<br />
September 1984.<br />
NSW Public Works (1990). “Bonny Hills – <strong>Lake</strong> <strong>Cathie</strong> Photogrammetric Analyses”,<br />
Contract 89022, May 1990.<br />
NSW Public Works (1991). “Lighthouse Beach (north) Photogrammetric Analysis”,<br />
Contract 89023, February 1991.<br />
SMEC Australia (2007). “Shoalhaven Heads <strong>Hazard</strong> Definition <strong>Study</strong>”, Report no.<br />
3001209-017 prepared by Adamantidis, C. and Nielsen, A., August 2007.<br />
13<br />
<strong>Lake</strong> <strong>Cathie</strong> <strong>Coastal</strong> Zone Management Plan: <strong>Coastal</strong> <strong>Hazard</strong> <strong>Study</strong> Report – <strong>Appendix</strong> D – November 2010
Figures<br />
Figure D.1 – Dune stability schema (after Nielsen et al., 1992)<br />
14<br />
<strong>Lake</strong> <strong>Cathie</strong> <strong>Coastal</strong> Zone Management Plan: <strong>Coastal</strong> <strong>Hazard</strong> <strong>Study</strong> Report – <strong>Appendix</strong> D – November 2010
Peak Hs (m)<br />
1940<br />
1941<br />
1942<br />
1943<br />
1944<br />
1945<br />
1946<br />
1947<br />
1948<br />
1949<br />
1950<br />
1951<br />
1952<br />
1953<br />
1954<br />
1955<br />
1956<br />
1957<br />
1958<br />
1959<br />
1960<br />
1961<br />
1962<br />
1963<br />
1964<br />
1965<br />
1966<br />
1967<br />
1968<br />
1969<br />
1970<br />
1971<br />
1972<br />
1973<br />
1974<br />
1975<br />
1976<br />
1977<br />
1978<br />
1979<br />
1980<br />
1981<br />
1982<br />
1983<br />
1984<br />
1985<br />
1986<br />
1987<br />
1988<br />
1989<br />
1990<br />
1991<br />
1992<br />
1993<br />
1994<br />
1995<br />
1996<br />
1997<br />
1998<br />
1999<br />
2000<br />
2001<br />
2002<br />
2003<br />
2004<br />
2005<br />
2006<br />
2007<br />
2008<br />
2009<br />
12<br />
11<br />
10<br />
9<br />
CENTRAL COAST<br />
NORTH COAST<br />
CROWDY HEAD<br />
COFFS HARBOUR<br />
Phorogrammetry Dates<br />
Estimated Hs <strong>Lake</strong> <strong>Cathie</strong><br />
Photogrammetry Dates Public Works 1990<br />
8<br />
7<br />
6<br />
Year<br />
Figure D.2 – Extreme Storm events vs. Photogrammetry Dates<br />
15<br />
<strong>Lake</strong> <strong>Cathie</strong> <strong>Coastal</strong> Zone Management Plan: <strong>Coastal</strong> <strong>Hazard</strong> <strong>Study</strong> Report – <strong>Appendix</strong> D – November 2010
16<br />
<strong>Lake</strong> <strong>Cathie</strong> <strong>Coastal</strong> Zone Management Plan: <strong>Coastal</strong> <strong>Hazard</strong> <strong>Study</strong> Report – <strong>Appendix</strong> D – November 2010
Figure D.4 – Undercutting of coffee rock platform by wave action, November 2007<br />
17<br />
<strong>Lake</strong> <strong>Cathie</strong> <strong>Coastal</strong> Zone Management Plan: <strong>Coastal</strong> <strong>Hazard</strong> <strong>Study</strong> Report – <strong>Appendix</strong> D – November 2010
Figure D.5 – Evidence of stormwater erosion path through coffee rock embankment, November 2007<br />
18<br />
<strong>Lake</strong> <strong>Cathie</strong> <strong>Coastal</strong> Zone Management Plan: <strong>Coastal</strong> <strong>Hazard</strong> <strong>Study</strong> Report – <strong>Appendix</strong> D – November 2010
19<br />
<strong>Lake</strong> <strong>Cathie</strong> <strong>Coastal</strong> Zone Management Plan: <strong>Coastal</strong> <strong>Hazard</strong> <strong>Study</strong> Report – <strong>Appendix</strong> D – November 2010
\ <strong>Lake</strong> <strong>Cathie</strong> <strong>Coastal</strong> Zone Management Plan: <strong>Coastal</strong> <strong>Hazard</strong> <strong>Study</strong> Report – <strong>Appendix</strong> D – November 2010<br />
20
21<br />
<strong>Lake</strong> <strong>Cathie</strong> <strong>Coastal</strong> Zone Management Plan: <strong>Coastal</strong> <strong>Hazard</strong> <strong>Study</strong> Report – <strong>Appendix</strong> D – November 2010
\ <strong>Lake</strong> <strong>Cathie</strong> <strong>Coastal</strong> Zone Management Plan: <strong>Coastal</strong> <strong>Hazard</strong> <strong>Study</strong> Report – <strong>Appendix</strong> D – November 2010<br />
22