Lake Cathie Coastal Hazard Study Appendix D - Hastings Council
Lake Cathie Coastal Hazard Study Appendix D - Hastings Council
Lake Cathie Coastal Hazard Study Appendix D - Hastings Council

You also want an ePaper? Increase the reach of your titles
YUMPU automatically turns print PDFs into web optimized ePapers that Google loves.
Wave runup levels at <strong>Lake</strong> <strong>Cathie</strong> were estimated using the Automated <strong>Coastal</strong><br />
Engineering Software (ACES). The wave runup module of ACES was used to determine<br />
the levels, which assumes a smooth slope, linear beach.<br />
The nearshore boundary conditions for ACES that have been adopted for various<br />
locations along the beach are shown in Table D.1. The assumed nearshore beach profile<br />
is measured from approximately 10 m below AHD to the top of the dune, to obtain a<br />
beach slope for use in the wave runup calculation. The runup was added to the nearshore<br />
water level, which included an allowance for wave setup and wind setup. The maximum<br />
expected wave runup and 2% wave runup (runup level exceeded by 2% of waves) is<br />
given in Table D.1.<br />
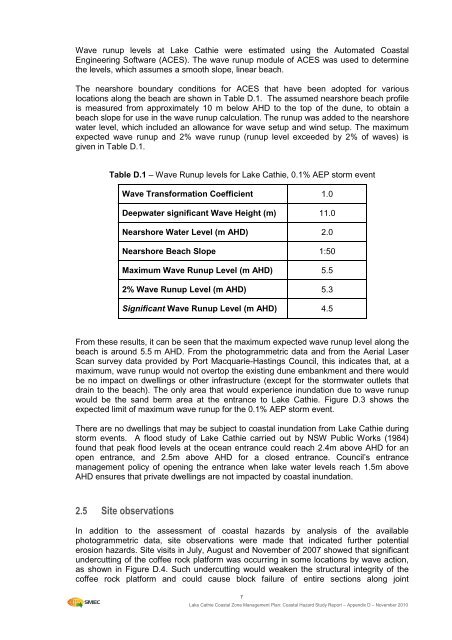
Table D.1 – Wave Runup levels for <strong>Lake</strong> <strong>Cathie</strong>, 0.1% AEP storm event<br />
Wave Transformation Coefficient 1.0<br />
Deepwater significant Wave Height (m) 11.0<br />
Nearshore Water Level (m AHD) 2.0<br />
Nearshore Beach Slope 1:50<br />
Maximum Wave Runup Level (m AHD) 5.5<br />
2% Wave Runup Level (m AHD) 5.3<br />
Significant Wave Runup Level (m AHD) 4.5<br />
From these results, it can be seen that the maximum expected wave runup level along the<br />
beach is around 5.5 m AHD. From the photogrammetric data and from the Aerial Laser<br />
Scan survey data provided by Port Macquarie-<strong>Hastings</strong> <strong>Council</strong>, this indicates that, at a<br />
maximum, wave runup would not overtop the existing dune embankment and there would<br />
be no impact on dwellings or other infrastructure (except for the stormwater outlets that<br />
drain to the beach). The only area that would experience inundation due to wave runup<br />
would be the sand berm area at the entrance to <strong>Lake</strong> <strong>Cathie</strong>. Figure D.3 shows the<br />
expected limit of maximum wave runup for the 0.1% AEP storm event.<br />
There are no dwellings that may be subject to coastal inundation from <strong>Lake</strong> <strong>Cathie</strong> during<br />
storm events. A flood study of <strong>Lake</strong> <strong>Cathie</strong> carried out by NSW Public Works (1984)<br />
found that peak flood levels at the ocean entrance could reach 2.4m above AHD for an<br />
open entrance, and 2.5m above AHD for a closed entrance. <strong>Council</strong>’s entrance<br />
management policy of opening the entrance when lake water levels reach 1.5m above<br />
AHD ensures that private dwellings are not impacted by coastal inundation.<br />
2.5 Site observations<br />
In addition to the assessment of coastal hazards by analysis of the available<br />
photogrammetric data, site observations were made that indicated further potential<br />
erosion hazards. Site visits in July, August and November of 2007 showed that significant<br />
undercutting of the coffee rock platform was occurring in some locations by wave action,<br />
as shown in Figure D.4. Such undercutting would weaken the structural integrity of the<br />
coffee rock platform and could cause block failure of entire sections along joint<br />
7<br />
<strong>Lake</strong> <strong>Cathie</strong> <strong>Coastal</strong> Zone Management Plan: <strong>Coastal</strong> <strong>Hazard</strong> <strong>Study</strong> Report – <strong>Appendix</strong> D – November 2010