Attachment 1 to Item 53 - Roadside Vegetation Management Plan
Attachment 1 to Item 53 - Roadside Vegetation Management Plan
Attachment 1 to Item 53 - Roadside Vegetation Management Plan

You also want an ePaper? Increase the reach of your titles
YUMPU automatically turns print PDFs into web optimized ePapers that Google loves.
H AW K E S B U R Y C IT Y C O U N C IL R O AD S ID E V E G E T AT IO N M AN AG E M E N T P L AN<br />
NSW Threatened Species Conservation Act 1995<br />
The TSC Act identifies and protects animals and plants within NSW at risk of becoming extinct. Section<br />
2.2.2 outlines the TSC Act in more detail.<br />
Digital data on the extent of vegetation communities listed on the TSC Act were obtained from the HCC<br />
Updated <strong>Vegetation</strong> Mapping Project (HCC 2007a). Individual threatened species records were<br />
obtained from the NSW Wildlife Atlas. As with the EPBC species records older than 1980 were<br />
excluded from the analysis.<br />
The method used for incorporating State-listed EECs in<strong>to</strong> the priority matrix was based on a score<br />
system. Incorporation of threatened species in<strong>to</strong> the priority matrix was based on a counting system<br />
(Section 4.2.4).<br />
4.2.3 Polygon and Point Data<br />
The methodology used two GIS data types: polygon data layers (vegetation types and CSA), and point<br />
data layers (threatened flora and fauna species).<br />
The final conservation priority data layer was a polygon data layer. Therefore, the following rule was<br />
followed when working with point data sources:<br />
• A threatened species record (buffered point data) was considered <strong>to</strong> be located on a road<br />
when any part of the buffered 100 m or 500 m point was within a road polygon.<br />
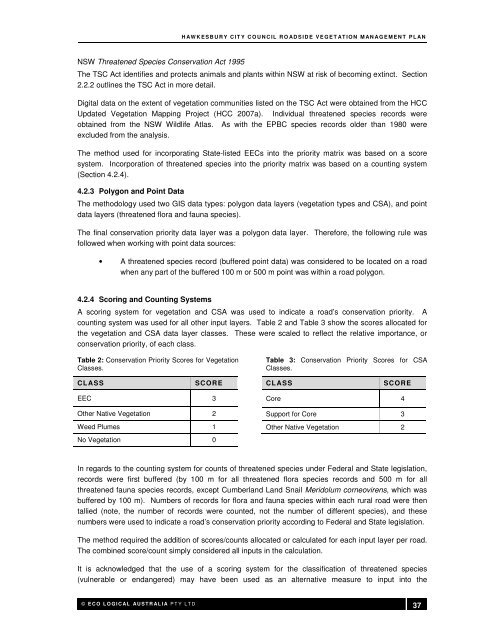
4.2.4 Scoring and Counting Systems<br />
A scoring system for vegetation and CSA was used <strong>to</strong> indicate a road’s conservation priority. A<br />
counting system was used for all other input layers. Table 2 and Table 3 show the scores allocated for<br />
the vegetation and CSA data layer classes. These were scaled <strong>to</strong> reflect the relative importance, or<br />
conservation priority, of each class.<br />
Table 2: Conservation Priority Scores for <strong>Vegetation</strong><br />
Classes.<br />
Table 3: Conservation Priority Scores for CSA<br />
Classes.<br />
CLASS<br />
SCORE<br />
CLASS<br />
SCORE<br />
EEC 3<br />
Other Native <strong>Vegetation</strong> 2<br />
Weed Plumes 1<br />
No <strong>Vegetation</strong> 0<br />
Core 4<br />
Support for Core 3<br />
Other Native <strong>Vegetation</strong> 2<br />
In regards <strong>to</strong> the counting system for counts of threatened species under Federal and State legislation,<br />
records were first buffered (by 100 m for all threatened flora species records and 500 m for all<br />
threatened fauna species records, except Cumberland Land Snail Meridolum corneovirens, which was<br />
buffered by 100 m). Numbers of records for flora and fauna species within each rural road were then<br />
tallied (note, the number of records were counted, not the number of different species), and these<br />
numbers were used <strong>to</strong> indicate a road’s conservation priority according <strong>to</strong> Federal and State legislation.<br />
The method required the addition of scores/counts allocated or calculated for each input layer per road.<br />
The combined score/count simply considered all inputs in the calculation.<br />
It is acknowledged that the use of a scoring system for the classification of threatened species<br />
(vulnerable or endangered) may have been used as an alternative measure <strong>to</strong> input in<strong>to</strong> the<br />
© E C O L O G I C AL AU S T R AL I A P T Y L T D<br />
37