Attachment 1 to Item 53 - Roadside Vegetation Management Plan
Attachment 1 to Item 53 - Roadside Vegetation Management Plan
Attachment 1 to Item 53 - Roadside Vegetation Management Plan

Create successful ePaper yourself
Turn your PDF publications into a flip-book with our unique Google optimized e-Paper software.
H AW K E S B U R Y C IT Y C O U N C IL R O AD S ID E V E G E T AT IO N M AN AG E M E N T P L AN<br />
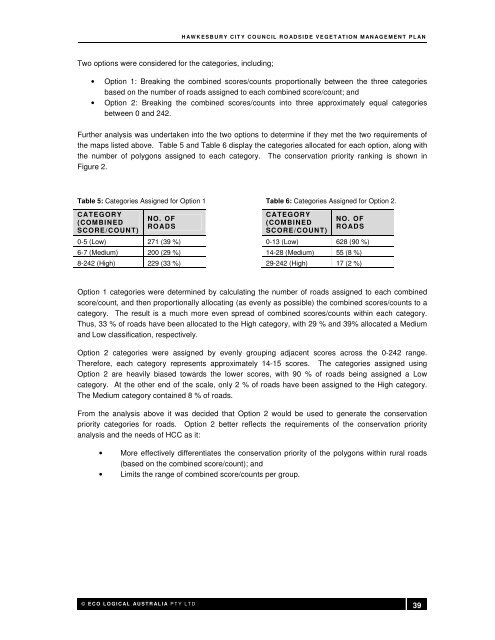
Two options were considered for the categories, including;<br />
• Option 1: Breaking the combined scores/counts proportionally between the three categories<br />
based on the number of roads assigned <strong>to</strong> each combined score/count; and<br />
• Option 2: Breaking the combined scores/counts in<strong>to</strong> three approximately equal categories<br />
between 0 and 242.<br />
Further analysis was undertaken in<strong>to</strong> the two options <strong>to</strong> determine if they met the two requirements of<br />
the maps listed above. Table 5 and Table 6 display the categories allocated for each option, along with<br />
the number of polygons assigned <strong>to</strong> each category. The conservation priority ranking is shown in<br />
Figure 2.<br />
Table 5: Categories Assigned for Option 1<br />
CATEGORY<br />
(COMBINED<br />
SCORE/COUNT)<br />
NO. OF<br />
ROADS<br />
0-5 (Low) 271 (39 %)<br />
6-7 (Medium) 200 (29 %)<br />
8-242 (High) 229 (33 %)<br />
Table 6: Categories Assigned for Option 2.<br />
CATEGORY<br />
(COMBINED<br />
SCORE/COUNT)<br />
NO. OF<br />
ROADS<br />
0-13 (Low) 628 (90 %)<br />
14-28 (Medium) 55 (8 %)<br />
29-242 (High) 17 (2 %)<br />
Option 1 categories were determined by calculating the number of roads assigned <strong>to</strong> each combined<br />
score/count, and then proportionally allocating (as evenly as possible) the combined scores/counts <strong>to</strong> a<br />
category. The result is a much more even spread of combined scores/counts within each category.<br />
Thus, 33 % of roads have been allocated <strong>to</strong> the High category, with 29 % and 39% allocated a Medium<br />
and Low classification, respectively.<br />
Option 2 categories were assigned by evenly grouping adjacent scores across the 0-242 range.<br />
Therefore, each category represents approximately 14-15 scores. The categories assigned using<br />
Option 2 are heavily biased <strong>to</strong>wards the lower scores, with 90 % of roads being assigned a Low<br />
category. At the other end of the scale, only 2 % of roads have been assigned <strong>to</strong> the High category.<br />
The Medium category contained 8 % of roads.<br />
From the analysis above it was decided that Option 2 would be used <strong>to</strong> generate the conservation<br />
priority categories for roads. Option 2 better reflects the requirements of the conservation priority<br />
analysis and the needs of HCC as it:<br />
• More effectively differentiates the conservation priority of the polygons within rural roads<br />
(based on the combined score/count); and<br />
• Limits the range of combined score/counts per group.<br />
© E C O L O G I C AL AU S T R AL I A P T Y L T D<br />
39