SECTION ONE SALARY OVERVIEW - Hays
SECTION ONE SALARY OVERVIEW - Hays
SECTION ONE SALARY OVERVIEW - Hays

Create successful ePaper yourself
Turn your PDF publications into a flip-book with our unique Google optimized e-Paper software.
<strong>SECTION</strong> <strong>ONE</strong><br />
<strong>SALARY</strong> <strong>OVERVIEW</strong><br />
Confidence is returning to the market -<br />
two thirds of employers surveyed intend to<br />
award salary increases in the next 12 months.<br />
Oil & Gas Salary Guide 2010 | 06
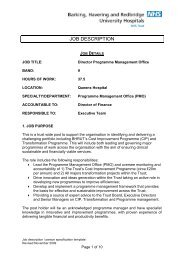
Salary overview<br />
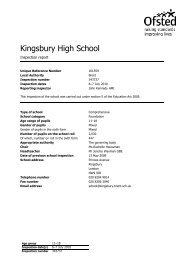
Average annual salary for permanent staff by country<br />
Results from our survey indicate those working in oil and gas are well<br />
paid. With an average permanent staff salary of more than $75,000<br />
globally (based on the combined total of local and imported labour)<br />
those in this industry are earning a premium compared to most other<br />
industries. There is however still a vast divide between those countries at<br />
the top of the table and those at the bottom and for this reason it’s not<br />
hard to understand why easily transferrable skills continue to migrate<br />
around the world in search of higher returns.<br />
Of all the countries on the list only three pay less for skills they import<br />
compared with what they pay their local resident employees - Norway,<br />
Canada and Australia. All other countries import skills from overseas at a<br />
premium, and in some cases at a significant premium. There does not<br />
however appear to be any correlation between home salaries and those<br />
imported, with Indonesia being at the bottom of the scale in terms of the<br />
average salary for local workforce, however it is the second highest payer<br />
for those it imports. The same can be found in Azerbaijan.<br />
At the other end of the spectrum, Oman pays its local workforce an<br />
average ‘mid table’ rate of just over $58,000. However it is the lowest<br />
payer of imported labour on the list. (With a highly concentrated<br />
number of employers there is some evidence that this is a reflection of<br />
an efficient overseas recruitment policy).<br />
If we combine both figures for each country - the five highest paying<br />
countries are Australia, USA, Azerbaijan, Canada and Netherlands. Those<br />
paying the least are Kuwait, Oman, Libya, India and Kazakhstan.<br />
Background<br />
Only where the sample size is large enough have we listed countries in<br />
this table.<br />
Permanent staff salaries are the figures returned by respondents as their<br />
package in US dollar equivalent figures excluding one-off bonuses,<br />
pension, share options and other non-cash benefits, and for those<br />
working on a monthly or yearly payroll. Those on a weekly or daily<br />
payroll are extracted and included in the figures for contracting overleaf.<br />
The first column represents the average salary for respondents based in<br />
their country of origin, the second column for those who are working in<br />
that country although originate from another. Where not enough<br />
responses were received, entries are returned as N/A.<br />
Salaries<br />
Country<br />
Local Labour<br />
Imported Labour<br />
Average annual salary<br />
Average annual salary<br />
Europe<br />
UK<br />
Norway<br />
Netherlands<br />
92,200 94,200<br />
114,700 101,000<br />
104,200 112,000<br />
Russia & CIS<br />
Russia<br />
Kazakhstan<br />
Azerbaijan<br />
65,600 105,700<br />
30,700 88,100<br />
53,300 144,500<br />
Middle East<br />
UAE<br />
Saudi Arabia<br />
Qatar<br />
Oman<br />
Kuwait<br />
Iraq<br />
Iran<br />
50,200 88,500<br />
67,600 86,400<br />
35,900 91,400<br />
58,400 67,800<br />
N/A 83,500<br />
32,600 N/A<br />
37,300 89,300<br />
Africa<br />
Libya<br />
Angola<br />
Algeria<br />
46,000 78,700<br />
53,600 118,900<br />
33,800 107,800<br />
North America<br />
USA<br />
Canada<br />
117,900 128,100<br />
112,800 112,500<br />
South America<br />
Venezuela<br />
Brazil<br />
Argentina<br />
72,300 113,700<br />
72,500 125,200<br />
65,000 N/A<br />
Asia<br />
Vietnam<br />
Singapore<br />
Malaysia<br />
Korea<br />
Japan<br />
Indonesia<br />
India<br />
China<br />
N/A<br />
N/A<br />
56,700 102,900<br />
43,100 131,000<br />
N/A 144,100<br />
N/A<br />
N/A<br />
32,000 136,300<br />
50,000 77,800<br />
51,600 102,900<br />
Australasia<br />
Australia<br />
New Zealand<br />
Notes: All figures are base salaries, quoted in US dollars.<br />
138,100 133,700<br />
99,700 112,700<br />
Oil & Gas Salary Guide 2010 | 07
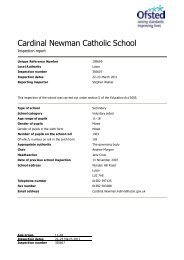
Salary overview<br />
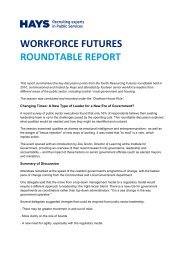
Average annual salary for contract staff by country<br />
With an average annual contractor salary of more than $95,000 for<br />
those working locally and more than $168,000 for imported labour, there<br />
is a considerable premium placed by employers on this method of<br />
working. However it should be noted that this figure and all other<br />
salaries listed assume that the individual works a full 240 days a year (or<br />
48 weeks) which is clearly not always possible, or in many cases desired.<br />
Clearly the trade off between security and guarantee of work versus an<br />
increase in rate for contracting is very much at work in the oil and gas<br />
industry. This is further accentuated where candidates work overseas on<br />
contract with the average return increasing to an impressive $168,500<br />
per annum. In all but two cases, countries are employing contractors<br />
from overseas at a premium (it can be assumed the skills required do<br />
not exist or are not available in the local workforce).<br />
The other observation from the figures shows that the discrepancy<br />
between contracting rates and equivalent permanent salaries is most<br />
pronounced in those countries with extensive permanent employment<br />
legislation i.e. The Netherlands. Here we can assume that this valuation<br />
of contractors is driven by employers avoiding expensive permanent<br />
employment costs.<br />
Background<br />
Contractor salaries are those working on daily or weekly payroll. The<br />
annual salary equivalent assumes they work for 240 days a year, or 48<br />
weeks respectively. Where not enough responses were received, entries<br />
are returned as N/A.<br />
Whilst Australia’s imported rate for labour is marginally below that for<br />
local staff, the UK shows a clear differentiation between the two. This<br />
may reflect a trend in the UK to import cheaper labour to combat<br />
margin decline in a difficult market. As the market improves however, it<br />
will be interesting to see whether the UK remains in a group of its own,<br />
or if they are joined by other nations seeking similar savings.<br />
Salaries<br />
Country<br />
Local Labour<br />
Imported Labour<br />
Average<br />
annual salary<br />
Average<br />
daily rate<br />
Average<br />
annual salary<br />
Average<br />
daily rate<br />
Europe<br />
UK<br />
Norway<br />
Netherlands<br />
163,800 630 134,900 520<br />
222,300 850 226,900 870<br />
186,500 720 210,300 810<br />
Russia & CIS<br />
Russia<br />
Kazakhstan<br />
Azerbaijan<br />
146,000 560 203,600 780<br />
76,300 290 191,500 740<br />
129,200 500 202,500 780<br />
Middle East<br />
UAE<br />
Saudi Arabia<br />
Qatar<br />
Oman<br />
Kuwait<br />
Iraq<br />
Iran<br />
78,600 300 123,900 480<br />
55,100 210 103,700 400<br />
N/A N/A 166,300 640<br />
60,500 230 183,200 700<br />
N/A N/A 125,700 480<br />
53,000 200 178,500 690<br />
60,800 230 159,000 610<br />
Africa<br />
Libya<br />
Angola<br />
Algeria<br />
83,800 320 188,000 720<br />
73,200 280 169,100 650<br />
84,000 320 166,300 640<br />
North America<br />
USA<br />
Canada<br />
214,300 820 220,800 850<br />
205,400 790 206,700 790<br />
South America<br />
Venezuela<br />
Brazil<br />
Argentina<br />
106,300 410 154,000 590<br />
159,000 610 176,000 680<br />
N/A N/A N/A N/A<br />
Asia<br />
Vietnam<br />
Singapore<br />
Malaysia<br />
Korea<br />
Japan<br />
Indonesia<br />
India<br />
China<br />
82,800 320 163,500 630<br />
71,700 280 175,800 680<br />
134,500 520 160,200 620<br />
N/A N/A 201,500 770<br />
N/A N/A 84,400 320<br />
51,900 200 203,200 780<br />
58,400 220 166,200 640<br />
78,600 300 189,800 730<br />
Australasia<br />
Australia<br />
New Zealand<br />
Notes: All figures are base salaries, quoted in US dollars.<br />
207,400 800 204,000 780<br />
155,300 600 182,700 700<br />
Oil & Gas Salary Guide 2010 | 08
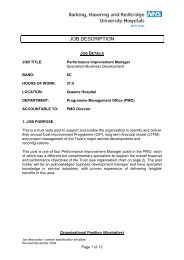
Salary overview<br />
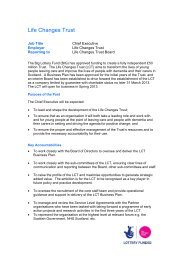
Average annual salary by experience<br />
By discipline area<br />
Those working within subsea/pipelines, production management and<br />
geoscience came out on top in this survey, with subsea leading the way<br />
on an average of $109,000 per annum. Downstream operations<br />
management, reservoir/petroleum engineering, piping, mechanical and<br />
technical safety were the lowest paid, with an average annual salary for<br />
downstream operations management of $65,800 per annum.<br />
Apart from the abovementioned, all other discipline areas came in with<br />
an average salary between $70,000 and $90,000.<br />
These figures also allowed us to track how experience is valued, and in<br />
some disciplines it is greatly; notably, subsea, production management,<br />
marine/naval, estimating/cost engineering and logistics. These areas all<br />
showed accelerated salaries as the experience grew.<br />
Project controls, reservoir engineering and HSE showed less than<br />
average growth in salaries as experience levels increased.<br />
By company type<br />
When comparing by company type, figures were consistently between<br />
an average salary ranging from $78,000 to $87,000. Equipment<br />
manufacturers and suppliers fell below this level, with an average annual<br />
salary of $63,700.<br />
Those working with a contractor were rewarded most for their increasing<br />
experience while those in their first four years with an operator were<br />
remunerated above their peers in other company types when first<br />
embarking on their career.<br />
Background<br />
These figures are based on permanent staff salaries returned by<br />
respondents as their package in US dollar equivalent figures excluding<br />
one-off bonuses, pension, share options and other non-cash benefits,<br />
and for those working on a monthly or yearly payroll. Those on a weekly<br />
or daily payroll have been extracted from this comparison.<br />
Salaries<br />
Years of experience<br />
0 to 4 5 to 9<br />
10 to 19 20 +<br />
Discipline area<br />
Business development<br />
Construction/installation<br />
Downstream operations management<br />
Drilling<br />
Electrical<br />
Estimating/cost engineering<br />
Geoscience<br />
HSE<br />
Logistics<br />
Marine/Naval<br />
Mechanical<br />
Piping<br />
Process<br />
Production management<br />
Project controls<br />
QA/QC<br />
Reservoir/petroleum engineering<br />
Structural<br />
Subsea/pipelines<br />
Supply chain/procurement<br />
Technical safety<br />
47,800 61,900 98,500 126,600<br />
47,200 76,900 100,500 119,900<br />
40,000 53,600 79,100 90,500<br />
43,500 55,100 91,500 135,500<br />
46,800 58,800 85,800 122,900<br />
37,500 53,700 110,600 140,400<br />
52,300 73,700 110,700 138,900<br />
49,400 62,300 91,900 121,500<br />
45,000 59,500 85,700 133,700<br />
54,100 68,600 99,900 140,400<br />
42,700 60,600 94,400 107,700<br />
48,900 56,500 80,200 111,900<br />
43,900 60,000 93,200 122,600<br />
50,500 77,600 133,800 154,200<br />
45,000 58,000 99,300 120,100<br />
41,700 60,600 90,600 127,200<br />
39,700 59,200 79,700 109,000<br />
39,900 53,700 94,200 136,200<br />
57,300 75,800 141,300 162,700<br />
43,500 56,800 90,900 121,800<br />
46,800 66,800 83,800 113,600<br />
Company type<br />
Consultancy<br />
Contractor<br />
EPCM<br />
Equipment manufacturer/supplier<br />
Global Super Major<br />
Oil Field Services<br />
Operator<br />
47,000 73,300 96,400 114,200<br />
39,600 53,100 100,600 145,800<br />
37,100 64,900 83,300 131,400<br />
34,300 48,300 75,600 96,800<br />
51,800 65,900 102,500 119,000<br />
50,500 66,400 82,300 115,500<br />
60,700 78,400 88,100 121,600<br />
Notes: All figures are base salaries, quoted in US dollars. EPCM - Engineering, procurement and construction management;<br />
HSE - Health, safety and environment; QA/QC - Quality assurance/quality control.<br />
Oil & Gas Salary Guide 2010 | 09
Salary overview<br />
Salary trends<br />
The last 12 months<br />
The recession of 2009 was clearly reflected in the fact that 12 per cent<br />
of respondents indicated their salaries were reduced over the last 12<br />
months. Those most affected worked with consultancies and contractors,<br />
were in the 0 to 4 years experience bracket and had been in their<br />
current role for less than one year.<br />
Whilst the majority of employers preferred to keep salaries static (44%),<br />
there were some signs of market improvement with an equal number of<br />
employees receiving an increase (16% + 28%).<br />
Of those that received an increase of more than 5 per cent over half were<br />
permanently employed and have been in their current role for 3 to 5 years.<br />
The next 12 months<br />
A more positive trend is appearing in the forecasted salaries returned by<br />
employers for 2010 with two thirds expecting to increase salaries, and<br />
very few expecting any decrease. Those working within oil field services<br />
could be the big winners with many employers in this area indicating<br />
they expect salaries to increase by more than 10 per cent.<br />
Retention of key staff through careful salary management is likely to<br />
become a prominent issue for employers this year.<br />
Background<br />
Only employers were asked to provide their intentions with regard to<br />
salaries in the next 12 months, whereas the figures for the previous 12<br />
months were taken from the employees experience.<br />
Salary trends<br />
In the last 12 months has<br />
your salary:<br />
12%<br />
28%<br />
16%<br />
44%<br />
Reduced<br />
Remained static<br />
Risen less than 5%<br />
Risen more than 5%<br />
In the next 12 months, do you<br />
expect salaries to:<br />
19%<br />
4%<br />
28%<br />
23%<br />
26%<br />
Decrease<br />
Remain static<br />
Increase up to 5%<br />
Increase more than<br />
5% but less than 10%<br />
Increase more<br />
than 10%<br />
Oil & Gas Salary Guide 2010 | 10