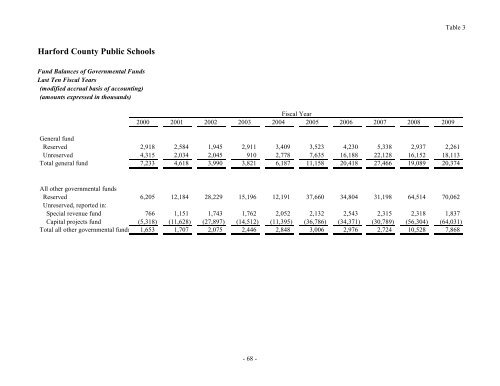
Table 3 <strong>Harford</strong> <strong>County</strong> Public Schools Fund Balances of Governmental Funds Last Ten Fiscal Years (modified accrual basis of accounting) (amounts expressed in thousands) Fiscal Year 2000 2001 2002 2003 2004 2005 2006 2007 2008 <strong>2009</strong> General fund Reserved 2,918 2,584 1,945 2,911 3,409 3,523 4,230 5,338 2,937 2,261 Unreserved 4,315 2,034 2,045 910 2,778 7,635 16,188 22,128 16,152 18,113 Total general fund 7,233 4,618 3,990 3,821 6,187 11,158 20,418 27,466 19,089 20,374 All other governmental funds Reserved 6,205 12,184 28,229 15,196 12,191 37,660 34,804 31,198 64,514 70,062 Unreserved, reported in: Special revenue fund 766 1,151 1,743 1,762 2,052 2,132 2,543 2,315 2,318 1,837 Capital projects fund (5,318) (11,628) (27,897) (14,512) (11,395) (36,786) (34,371) (30,789) (56,304) (64,031) Total all other governmental funds 1,653 1,707 2,075 2,446 2,848 3,006 2,976 2,724 10,528 7,868 - 68 -
Table 4 <strong>Harford</strong> <strong>County</strong> Public Schools Changes in Fund Balances of Governmental Funds Last Ten Fiscal Years (modified accrual basis of accounting) (amounts expressed in thousands) Fiscal Year 2000 2001 2002 2003 2004 2005 2006 2007 2008 <strong>2009</strong> Revenues Intergovernmental revenues Local 131,034 140,346 154,360 164,163 167,880 177,486 224,683 228,930 278,735 299,449 State 121,076 123,533 124,525 136,685 144,371 168,141 183,301 205,345 245,316 241,878 Special state and federal programs 2,954 3,212 25,508 26,744 22,839 21,833 23,558 24,835 24,881 24,357 Federal 16,320 19,552 3,608 3,870 4,401 4,711 5,036 5,177 5,358 5,907 Earnings on investments 1,017 860 350 159 137 501 1,066 1,530 1,348 235 Charges for services 4,977 5,559 6,084 6,328 6,658 7,186 7,666 8,132 8,348 8,059 Donation of land from county - - - - - 3,063 - - - - Miscellaneous revenues 938 3,351 2,771 1,325 2,545 3,574 7,432 7,271 8,709 4,878 Total revenues 278,316 296,413 317,206 339,274 348,831 386,495 452,742 481,220 572,695 584,763 Expenditures Current Adminstrative services 5,129 5,367 5,687 5,615 6,205 6,781 8,381 9,906 10,732 11,044 Mid level adminstrative services 14,531 15,889 17,154 17,707 17,428 18,638 21,411 23,592 25,282 25,556 Instructional salaries 101,918 107,187 114,172 118,502 122,904 126,644 143,325 158,371 167,938 168,953 Instructional textbooks and supplie 4,478 4,445 5,471 5,596 5,512 6,070 8,584 9,885 9,962 8,405 Other instructional costs 2,043 1,222 1,554 1,640 1,912 2,208 2,409 2,103 2,848 3,406 Special education 17,423 18,223 19,627 20,329 22,459 23,921 27,764764 31,751 35,782 38,054 Student personnel services 948 1,030 1,083 1,123 1,131 1,180 1,373 1,524 1,621 1,629 Health services 1,613 1,793 1,903 1,934 2,124 2,272 2,512 3,047 3,222 3,400 Pupil transportation services 14,277 14,763 15,442 16,293 17,103 18,642 20,632 22,617 26,889 27,321 Operation of plant 15,643 17,581 17,239 18,307 19,238 21,128 23,603 26,036 28,859 29,063 Maintenance of plant and equipmen 6,038 7,214 7,047 7,483 8,089 8,511 9,239 10,096 11,269 10,701 Fixed charges 50,077 53,197 52,589 58,769 67,459 72,732 80,122 88,247 112,856 107,605 Community services 275 277 283 328 293 377 398 455 450 429 Special state and federal programs 16,321 19,552 25,508 26,744 22,839 21,833 23,558 24,835 24,880 24,357 Costs of operations - food services 7,678 8,197 8,870 9,601 10,709 11,600 12,652 13,517 13,977 14,435 Capital outlay 22,854 23,108 23,744 29,092 20,846 41,242 66,404 48,395 96,663 111,844 Total expenditures 281,246 299,045 317,373 339,063 346,251 383,779 452,367 474,377 573,230 586,202 Excess (deficit) of revenues over expenditures (2,930) (2,632) (167) 211 2,580 2,716 375 6,843 (535) (1,439) Other financing sources (uses) Proceeds from capital lease - - - - - 2,475 8,893 32 - - Increase (decrease) in reserve for inventory (13) 70 (92) (10) 188 (62) (38) - (38) - Net change in fund balances (2,943) (2,562) (259) 201 2,768 5,129 9,230 6,875 (573) (1,439) - 69 -