Table 5 <strong>Harford</strong> <strong>County</strong> Public Schools Enrollment by School and Student to Teacher Ratio Last Ten Years At September 30, 2008 Percent of 1999 2000 2001 2002 2003 2004 2005 2006 2007 2008 Capacity Capacity Abingdon Elementary 855 859 833 853 836 841 822 751 769 795 821 96.83% Bakersfield Elementary 501 530 551 506 510 507 463 447 463 477 455 104.84% Bel Air Elementary 638 537 567 577 525 533 524 505 487 512 500 102.40% Church Creek Elementary 811 800 743 730 733 754 778 755 736 743 789 94.17% Churchville Elementary 374 367 408 384 398 383 383 371 359 363 388 93.56% Darlington Elementary 164 165 145 123 141 137 139 130 126 125 192 65.10% Deerfield Elementary 592 594 589 639 687 670 584 569 545 520 555 93.69% Dublin Elementary 295 280 266 258 260 268 239 250 246 247 295 83.73% Edgewood Elementary 466 421 447 442 458 506 473 422 419 393 511 76.91% Emmorton Elementary 561 544 544 576 580 617 617 653 667 676 549 123.13% Forest Hill Elementary - 609 710 536 580 603 579 585 575 564 581 97.07% Forest Lakes Elementary 708 523 525 684 675 679 714 707 695 664 548 121.17% Fountain Green Elementary 601 611 605 616 647 616 664 643 662 651 571 114.01% George D. Lisby Elementary at Hillsdale 449 446 440 391 383 378 347 333 311 350 432 81.02% Halls Cross Roads Elementary 427 431 401 401 359 364 383 415 437 430 632 68.04% Havre de Grace Elementary 490 470 505 481 487 461 413 368 373 393 574 68.47% Hickory Elementary 819 613 674 693 693 667 696 664 693 702 622 112.86% Homestead-Wakefield Elementary 1,128 1,035 992 982 992 970 958 934 919 905 907 99.78% Jarrettsville Elementary 531 517 480 480 470 455 455 423 443 414 520 79.62% Joppatowne Elementary 552 528 568 593 564 567 581 522 515 546 484 112.81% Magnolia Elementary 602 610 596 589 566 574 515 512 526 536 499 107.41% Meadowvale Elementary 652 647 577 588 602 574 603 571 549 545 568 95.95% Norrisville Elementary 239 206 192 191 194 184 207 221 206 192 252 76.19% North Bend Elementary 551 522 503 500 481 470 449 428 399 402 513 78.36% North <strong>Harford</strong> Elementary 497 499 498 532 539 534 551 518 502 469 487 96.30% Prospect Mill Elementary 900 879 839 911 879 907 976 1,008 980 951 680 139.85% Ring Factory Elementary 653 675 619 596 567 555 541 530 527 500 549 91.07% Riverside Elementary 584 562 559 544 564 559 554 568 547 504 522 96.55% Roye-Williams Elementary 651 654 630 620 563 641 577 546 493 426 752 56.65% William Paca/Old Post Road Elementary 1,086 1,071 1,066 1,055 1,033 1,026 1,052 1,044 1,010 1,020 940 108.51% William S. James Elementary 605 600 589 560 526 520 498 496 501 487 476 102.31% Youths Benefit Elementary 1,079 1,068 1,014 1,003 985 1,008 1,029 1,044 1,067 1,072 890 120.45% Total Elementary Schools 19,061 18,873 18,675 18,634 18,477 18,528 18,364 17,933 17,747 17,574 18,054 97.34% Aberdeen Middle 1,236 1,228 1,265 1,299 1,293 1,301 1,247 1,207 1,095 1,120 1,709 65.54% Bel Air Middle 1,225 1,218 1,265 1,429 1,461 1,402 1,434 1,403 1,244 1,249 1,318 94.76% Edgewood Middle 1,179179 1,228 1,331 1,349 1,346 1,275 1,216 1,164164 1,151151 1,028 1,370 75.04% Fallston Middle 1,152 1,145 1,118 1,274 1,228 1,224 1,212 1,180 925 905 1,105 81.90% Havre de Grace Middle 607 599 624 657 650 605 589 599 609 613 775 79.10% Magnolia Middle 871 882 912 935 903 913 916 869 874 785 1,073 73.16% North <strong>Harford</strong> Middle 1,078 1,063 1,129 1,226 1,200 1,118 1,123 1,085 1,153 1,134 1,243 91.23% Patterson Mill Middle - - - - - - - - 735 763 733 104.09% Southampton Middle 1,823 1,951 2,008 1,613 1,541 1,528 1,535 1,549 1,252 1,295 1,540 84.09% Total Middle Schools 9,171 9,314 9,652 9,782 9,622 9,366 9,272 9,056 9,038 8,892 10,866 81.83% Aberdeen High 1,173 1,204 1,220 1,250 1,250 1,357 1,543 1,589 1,569 1,504 1,370 109.78% Bel Air High 1,556 1,587 1,573 1,573 1,649 1,636 1,639 1,683 1,403 1,380 1,423 96.98% C. Milton Wright High 1,763 1,788 1,840 1,793 1,789 1,911 1,834 1,850 1,746 1,587 1,678 94.58% Edgewood High 1,143 1,093 1,183 1,226 1,327 1,357 1,316 1,261 1,177 1,123 1,380 81.38% Fallston High 1,554 1,618 1,651 1,656 1,672 1,635 1,643 1,606 1,453 1,365 1,529 89.27% <strong>Harford</strong> Technical High 901 935 1,014 1,054 1,070 1,069 1,052 1,056 1,056 1,040 920 113.04% Havre de Grace High 661 639 663 690 687 705 721 717 769 764 850 89.88% Joppatowne High 1,019 1,069 1,074 1,052 1,051 1,108 1,118 1,063 1,004 969 1,105 87.69% North <strong>Harford</strong> High 1,187 1,233 1,270 1,370 1,425 1,447 1,445 1,437 1,385 1,367 1,603 85.28% Patterson Mill High - - - - - - - - 436 701 1,030 68.06% Total High Schools 10,957 11,166 11,488 11,664 11,920 12,225 12,311 12,262 11,998 11,800 12,888 91.56% Total Secondary Schools 20,128 20,480 21,140 21,446 21,542 21,591 21,583 21,318 21,036 20,692 23,754 87.11% Alternative Education 18 54 15 20 30 17 113 139 155 106 250 42.40% Restoration Academy (Charter) - - - - - - - 21 78 79 75 105.33% John Archer 141 155 165 164 154 158 152 160 159 159 210 75.71% Total Special Schools 159 209 180 184 184 175 265 320 392 344 535 64.30% Total All Schools 39,348 39,562 39,995 40,264 40,203 40,294 40,212 39,571 39,175 38,610 42,343 91.18% Teachers & Therapists Staff (1) 2,370 2,442 2,486 2,579 2,590 2,357 2,437 2,589 2,809 2,835 Student/Teacher Ratio 16.60 16.20 16.09 15.61 15.52 17.10 16.50 15.28 13.95 13.62 Source: Monthly <strong>Report</strong> on Enrollment at September 30. Source (1): Maryland State Department of Education Fact Book for relevant year Note: September 30 is the State's official enrollment date for the school year. - 70 -
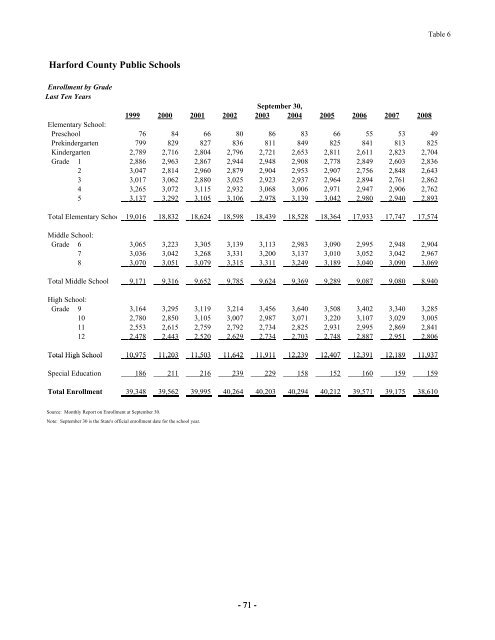
Table 6 <strong>Harford</strong> <strong>County</strong> Public Schools Enrollment by Grade Last Ten Years September 30, 1999 2000 2001 2002 2003 2004 2005 2006 2007 2008 Elementary School: Preschool 76 84 66 80 86 83 66 55 53 49 Prekindergarten 799 829 827 836 811 849 825 841 813 825 Kindergarten 2,789 2,716 2,804 2,796 2,721 2,653 2,811 2,611 2,823 2,704 Grade 1 2,886 2,963 2,867 2,944 2,948 2,908 2,778 2,849 2,603 2,836 2 3,047 2,814 2,960 2,879 2,904 2,953 2,907 2,756 2,848 2,643 3 3,017 3,062 2,880 3,025 2,923 2,937 2,964 2,894 2,761 2,862 4 3,265 3,072 3,115 2,932 3,068 3,006 2,971 2,947 2,906 2,762 5 3,137 3,292 3,105 3,106 2,978 3,139 3,042 2,980 2,940 2,893 Total Elementary Schoo 19,016 18,832 18,624 18,598 18,439 18,528 18,364 17,933 17,747 17,574 Middle School: Grade 6 3,065 3,223 3,305 3,139 3,113 2,983 3,090 2,995 2,948 2,904 7 3,036 3,042 3,268 3,331 3,200 3,137 3,010 3,052 3,042 2,967 8 3,070 3,051 3,079 3,315 3,311 3,249 3,189 3,040 3,090 3,069 Total Middle School 9,171 9,316 9,652 9,785 9,624 9,369 9,289 9,087 9,080 8,940 High School: Grade 9 3,164 3,295 3,119 3,214 3,456 3,640 3,508 3,402 3,340 3,285 10 2,780 2,850 3,105 3,007 2,987 3,071 3,220 3,107 3,029 3,005 11 2,553 2,615 2,759 2,792 2,734 2,825 2,931 2,995 2,869 2,841 12 2,478 2,443 2,520 2,629 2,734 2,703 2,748 2,887 2,951 2,806 Total High School 10,975 11,203 11,503 11,642 11,911 12,239 12,407 12,391 12,189 11,937 Special Education 186 211 216 239 229 158 152 160 159 159 Total Enrollment 39,348 39,562 39,995 40,264 40,203 40,294 40,212 39,571 39,175 38,610 Source: Monthly <strong>Report</strong> on Enrollment at September 30. Note: September 30 is the State's official enrollment date for the school year. - 71 -