Postgraduate Research Experience Survey (PRES) 2011 - Higher ...
Postgraduate Research Experience Survey (PRES) 2011 - Higher ...
Postgraduate Research Experience Survey (PRES) 2011 - Higher ...

You also want an ePaper? Increase the reach of your titles
YUMPU automatically turns print PDFs into web optimized ePapers that Google loves.
<strong>Postgraduate</strong> <strong>Research</strong> <strong>Experience</strong> <strong>Survey</strong><br />
<strong>2011</strong> results<br />
Dr Laura Hodsdon<br />
and<br />
Dr Alex Buckley<br />
September <strong>2011</strong>
<strong>PRES</strong> <strong>2011</strong> Results – September <strong>2011</strong><br />
Contents<br />
Foreword 2<br />
Executive summary 3<br />
Introduction 6<br />
1. Profile of respondents 9<br />
2. <strong>PRES</strong> scales and items 17<br />
3. Detailed analysis<br />
3.1 Focus on domicile and disability 31<br />
3.2 Focus on skills and professional development 35<br />
Conclusion 54<br />
References 55<br />
Glossary of acronyms 56<br />
Appendix A 57<br />
Appendix B 61<br />
Appendix C 70<br />
1
<strong>PRES</strong> <strong>2011</strong> Results – September <strong>2011</strong><br />
Foreword<br />
The <strong>Postgraduate</strong> <strong>Research</strong> <strong>Experience</strong> <strong>Survey</strong> (<strong>PRES</strong>), along with the <strong>Postgraduate</strong> Taught <strong>Experience</strong><br />
<strong>Survey</strong> (PTES), are part of the <strong>Higher</strong> Education Academy’s distinctive services allowing higher education<br />
institutions (HEIs) to collect feedback from their postgraduate students in a comprehensive and userfriendly<br />
manner. The surveys have become an increasingly valued tool across the UK higher education<br />
sector and are unique data sources on the postgraduate experience, with the (2010) Smith report for the<br />
Department of Business, Innovation and Skills noting that they are “the main source of information about<br />
students’ motivations” 1 .<br />
This report on the <strong>2011</strong> survey, marks the fourth year that <strong>PRES</strong> has run, meaning that we now have<br />
valuable trend data to provide insights into the nature of the postgraduate experience over time as well<br />
as to situate individual years’ results within a wider, more robust context. There has been a rise in<br />
participation over the four years both in the number of HEIs running the survey and the number of<br />
students responding, with <strong>PRES</strong> <strong>2011</strong> seeing a 20% increase in the number of HEIs and nearly 13,000<br />
more respondents since 2009. Not only does this mean that the <strong>2011</strong> survey is built on a more<br />
comprehensive dataset than previous years, but also that more postgraduate research students than ever<br />
before have had the opportunity to give feedback on their experiences. This year <strong>PRES</strong> and PTES between<br />
them have collected the views of almost 70,000 students, meaning that the surveys are unparalleled<br />
within Europe in their scope and breadth.<br />
<strong>PRES</strong> is now entering year two of its alternate-yearly cycle, meaning that, rather than the survey running<br />
again next Spring, <strong>2011</strong>-12 will be an enhancement year allowing HEIs the space to analyse, interpret and<br />
act upon their results. The <strong>Higher</strong> Education Academy will continue to provide support to the sector in the<br />
form of events and resources, and will work with individual institutions to help them to use <strong>PRES</strong> for<br />
enhancement. The HEA remains committed to this important area and looks forward to continuing to<br />
work with HEIs to improve the postgraduate experience.<br />
Thanks are due to all the HEA colleagues who have contributed to this report: in particular, to Gosia<br />
Turner for undertaking the analysis, and to Professor Chris Park and Dr Pam Wells for their input into and<br />
comments on earlier drafts. In addition, we are grateful to Dr Rachel Segal for her input on <strong>PRES</strong>, and the<br />
HEA’s work on student surveys more generally.<br />
Any colleagues wishing to know more about <strong>PRES</strong> can contact the team at surveys@heacademy.ac.uk or<br />
keep up to date via the HEA’s website at http://www.heacademy.ac.uk/pres.<br />
Craig Mahoney<br />
Chief Executive<br />
<strong>Higher</strong> Education Academy<br />
1 Smith et al. (2010), p.37.<br />
2
<strong>PRES</strong> <strong>2011</strong> Results – September <strong>2011</strong><br />
Executive summary<br />
This report provides national results from the <strong>Postgraduate</strong> <strong>Research</strong> <strong>Experience</strong> <strong>Survey</strong> (<strong>PRES</strong>) for <strong>2011</strong>. <strong>PRES</strong><br />
is a UK-wide survey that collects the views of current postgraduate researchers in order to target, design and<br />
evaluate work to enhance the learning experiences of postgraduate students on research programmes.<br />
This was the fourth time the survey was run (previous surveys ran in 2007, 2008 and 2009). One hundred and<br />
two UK institutions took part in <strong>PRES</strong> <strong>2011</strong>. With 31,202 students completing the survey, there was a national<br />
response rate of 32%. These figures mark a substantial increase in engagement with the survey from 2009,<br />
when 82 institutions took part and 18,644 students responded: a national response rate of 28.6%. <strong>PRES</strong> will<br />
run again in 2013, giving HEIs the space in <strong>2011</strong>-12 to analyse, interpret and act upon their results.<br />
Key findings<br />
The trend of increasing positivity seen in <strong>PRES</strong> results each year continues with the <strong>2011</strong> results, with 86% of<br />
respondents stating that the overall experience of their research programme met or exceeded their<br />
expectations, compared with 81% in 2007, 83% in 2008 and 84% in 2009.<br />
Supervision<br />
As with previous years, Supervision was the scale that was rated as most important by respondents, as well as<br />
the area about which they were most positive. Of all the items in this scale, respondents were least positive<br />
about guidance about literature searches, but even that showed a substantial improvement from 2009,<br />
increasing from 65% to 70% 2 .<br />
Skills Development<br />
The Skills Development scale was the third most positive area of <strong>PRES</strong> <strong>2011</strong>. As with previous years, the lowest<br />
scoring item in this scale concerned opportunities to develop transferable skills, although that item did show<br />
the largest change from 2009, increasing from 65% to 72%. It was also rated by respondents as being markedly<br />
less important than other areas. Conversely, the development of research skills was rated as one of the most<br />
important issues. Despite these differences between transferable and research skills development, they were<br />
the two areas where respondents most felt that their expectations had been met or exceeded (87% for<br />
transferable skills, 88% for research skills).<br />
Infrastructure<br />
This was one of the least positive scales. Within this scale respondents were least positive, by some margin,<br />
about the availability of financial support, at only 57%. They were most positive about library, IT facilities and<br />
other equipment, and the availability of a working space. Satisfaction with technical support increased notably<br />
from 2009, from 64% to 71%.<br />
Intellectual Climate<br />
This was the second least positive scale for respondents. Ratings were particularly low for the extent to which<br />
respondents felt integrated into their department’s community, at only 54%. The highest rated items, both at<br />
2 This, and the other results cited in this summary (unless otherwise stated), is the percentage of respondents who<br />
selected ‘agree’ or ‘strongly agree’ in response to a positive statement.<br />
3
<strong>PRES</strong> <strong>2011</strong> Results – September <strong>2011</strong><br />
65%, concerned the opportunities for social contact with other research students, and the departmental<br />
seminar programme.<br />
Goals and Standards<br />
This was a scale that had relatively little importance to respondents. They were most positive about<br />
understanding the standard of work expected (79%), while they expressed most concern about understanding<br />
the requirements of the thesis examination (67%).<br />
Thesis Examination<br />
Only students who had sat their final viva voce examination responded to these items: less than one<br />
respondent in 20. Those that did respond were very positive about the fairness of the examination process,<br />
and this positivity was a clear improvement on 2009, an increase from 78% to 84%. They were least positive<br />
about support for preparation in advance of the viva voce, but again this was an increase from 2009, from 62%<br />
to 71%. The item in the survey that received the greatest increase in positivity compared with 2009 was in this<br />
area: positivity about the support received for post-viva voce thesis corrections increased from 67% to 77%.<br />
Professional Development and Career<br />
Since it was introduced in 2008 this has been the least positive scale of the survey. Respondents were<br />
considerably more positive about encouragement to think about career opportunities than in 2009, an<br />
increase from 37% to 44%, but that was still the issue about which they expressed most concern.<br />
Roles and Responsibilities<br />
Respondents felt clear about their responsibilities as postgraduate researchers (80%), but they were<br />
unconvinced that their institution values and responds to student feedback (57%).<br />
Teaching Opportunities<br />
While not very many respondents felt they had adequate opportunities to gain teaching experience (although<br />
the proportion increased from 49% in 2009 to 58% in <strong>2011</strong>), those that had had the opportunity generally felt<br />
it was worthwhile (71%). There was a marked lack of positivity, however, about the support and guidance they<br />
had received (51%).<br />
Personal Factors<br />
Within this diverse group of items, most positivity was expressed about support from friends and family: this<br />
received the most agreement of all the items on the survey, at 89%.<br />
Motivations<br />
As with previous years of <strong>PRES</strong>, the two most common motivations to pursue a research degree programme<br />
were an interest in the subject (37%), and improving academic or research career prospects (31%).<br />
Anticipated Career<br />
Nearly half of respondents anticipated a career in higher education consisting of either teaching alone, or<br />
research and teaching (44%). 13% of respondents anticipated a research-only career in HE, and 43%<br />
anticipated a career outside HE.<br />
4
<strong>PRES</strong> <strong>2011</strong> Results – September <strong>2011</strong><br />
Disability<br />
Respondents who identified themselves as having a disability were less positive across all areas of the survey,<br />
with a particularly large difference for the overall experience of their programme (78% felt that their overall<br />
experience had met or exceeded their expectations, compared with 87% for those respondents without a<br />
disability). For most areas of the survey, those with two or more impairments and/or disabling mental<br />
conditions, and those with a mental health condition, were least positive.<br />
Domicile<br />
Students from Africa and Asia were in general most positive about their experience, while those from the UK,<br />
North America and the Middle East were less positive. Areas of notable difference included skills development,<br />
which students from Africa rated more positively, and provision of guidance on standards and expectations,<br />
for which Non EU students were much more likely to state that their expectations had been met or exceeded.<br />
Skills and Professional Development<br />
More detailed analysis was carried out on the relevant items in this area, against selected demographic<br />
variables.<br />
- By discipline<br />
Respondents from Arts & Humanities were more motivated by an interest in the subject than respondents<br />
from other discipline groups, while Health respondents were most likely to be motivated by career prospects.<br />
Arts & Humanities and Social Sciences respondents were most interested in an academic career. Health and<br />
STEM respondents were most positive about skills development opportunities. Health students were also<br />
most convinced about the importance of skills development, and were most likely to feel they had been<br />
encouraged to reflect on their professional and career development needs.<br />
- By gender<br />
Female respondents were more convinced about the importance of transferable skills than men, although<br />
they were no more or less positive about the opportunities available to them. Women were in general less<br />
positive about the encouragement they had received to reflect on their professional and career development.<br />
- By age<br />
Younger and older students were most motivated by an interest in the subject, while those in the middle age<br />
ranges were most motivated by improving career prospects in HE. Younger respondents were more positive<br />
about their skills development, while those in the middle age ranges were most likely to feel that transferable<br />
skills development was important. Those in the middle range were most positive about professional and<br />
career development.<br />
- Source of funding<br />
Students funded by <strong>Research</strong> Councils UK – who have been required in recent years to undertake a certain<br />
amount of skills training – were, unsurprisingly, more positive about the provision of opportunities to develop<br />
research and transferable skills. However, what is striking is that RCUK-funded respondents seem to be<br />
markedly less positive than non-RCUK-funded students about the encouragement they had received to reflect<br />
on their professional and career development.<br />
5
<strong>PRES</strong> <strong>2011</strong> Results – September <strong>2011</strong><br />
Introduction<br />
This report presents national aggregate results from the <strong>Postgraduate</strong> <strong>Research</strong> <strong>Experience</strong> <strong>Survey</strong> (<strong>PRES</strong>)<br />
<strong>2011</strong>. It is divided into three sections. Section 1 presents demographic information about the <strong>PRES</strong> <strong>2011</strong><br />
sample. Section 2 provides results and commentary for all the <strong>PRES</strong> items and scales. Section 3 includes<br />
detailed analysis focusing on two specific areas: a) disability and domicile effects; and b) items relevant to<br />
skills and professional development. Appendix A includes full tables for all items and a table of year-byyear<br />
comparisons; Appendix B includes tables relating to the detailed analyses in Section 3; and Appendix<br />
C contains the full <strong>PRES</strong> <strong>2011</strong> questionnaire.<br />
The report provides data about the educational experiences of postgraduate researchers (PGRs). It will<br />
therefore be useful to anyone connected with supporting PGRs in their studies and development:<br />
particularly <strong>PRES</strong> officers running the surveys in institutions (whether or not they are engaged in analysing<br />
the survey data), postgraduate student managers, postgraduate students and higher education policy<br />
makers.<br />
Gathering information about PGRs’ views of their programmes is an essential part of understanding the<br />
nature and diversity of their experiences and informing activities to improve the provision of<br />
postgraduate research degrees. For this reason, the Smith review into postgraduate education in the UK<br />
recommended that <strong>PRES</strong> should be extended to more institutions and more students. The Government<br />
has endorsed this recommendation. The <strong>2011</strong> survey included many more institutions and students than<br />
in 2009, thus satisfying the need for greater coverage by the survey, and providing a useful picture of the<br />
postgraduate research landscape 3 .<br />
Methodology<br />
As in previous years, <strong>PRES</strong> <strong>2011</strong> ran to a fixed survey period, this year from 1 March until 31 May <strong>2011</strong>. All<br />
higher education institutions (HEIs) in the United Kingdom that have PGRs were invited to take part, with<br />
102 participating this year. <strong>PRES</strong> is a census survey and is sent to all eligible PGRs, which this year<br />
comprised 97,571, of whom 31,202 replied, equating to a 32% response rate: the highest in the history of<br />
<strong>PRES</strong> to date. These figures constitute an increase from 2009, when 82 institutions took part, there was a<br />
response rate of 28.6%, and in total 18,644 students responded.<br />
<strong>PRES</strong> is an online survey run via Bristol Online <strong>Survey</strong>s (BOS). The BOS website allows <strong>PRES</strong> officers (the<br />
HEA’s primary contact within an HEI, responsible for administering the survey) to monitor their own<br />
institutional results and the aggregate results in real time while the survey is open, and to explore their<br />
results in detail after it closes. Each participating institution was given an electronic template of the <strong>PRES</strong><br />
questionnaire before the survey went live, which they could modify by adding institution-specific<br />
questions; each institution was then responsible for contacting its postgraduate research students to<br />
invite them to take part in <strong>PRES</strong>. Respondents’ details are confidential, and institutional-level data are<br />
kept confidential to that institution. Participating institutions are able to benchmark their results against<br />
the national sector aggregate and those of similar institutions by joining benchmarking clubs. There are<br />
no institutional rankings or individual institutional results contained in this report.<br />
Changes in <strong>2011</strong><br />
‘Not Applicable’ (‘N/A’) option<br />
One key change in the <strong>PRES</strong> questionnaire this year has been the addition of the option ‘N/A’ to a greater<br />
range of items than in previous years. Adding ‘N/A’ as a response option to most of the items in <strong>PRES</strong><br />
allows students who do not have firm opinions about those items to refrain from giving an answer on the<br />
five-point scale if they feel that the item does not apply to them.<br />
3 See Smith et al. (2010). The Government has published a response to the recommendations, see BIS (<strong>2011</strong>).<br />
6
<strong>PRES</strong> <strong>2011</strong> Results – September <strong>2011</strong><br />
An analysis of responses suggests that students select this option only when relevant, as the profile of<br />
‘N/A’ responses is highly variable throughout the survey (ranging from 0.4% to 51.9%). Extra analysis has<br />
been carried out comparing the national response profiles of <strong>PRES</strong> <strong>2011</strong> and <strong>PRES</strong> 2009, the results of<br />
which suggest that for most items the addition of this option has not had a significant impact on the<br />
response profile. The general increase in positivity that is apparent in the results for <strong>2011</strong> (see Section 2<br />
below) appears not to be a direct product of the introduction of the N/A option: the increases in positivity<br />
occur regardless of the proportion of N/A responses for each item, and also occur for items where the<br />
option existed in 2009. More detailed analysis will be required to gain more information about the effect<br />
of the introduction of the N/A option, but there is no evidence thus far that it has any important effect on<br />
the key findings of the <strong>2011</strong> survey 4 .<br />
Demographic response options<br />
The disability response options (Q23) were updated to those currently used by the <strong>Higher</strong> Education<br />
Statistics Agency (HESA). A selection list of countries was also added for Q31, to enable more fine-grained<br />
demographic analyses where relevant. Finally, the ‘paid employment’ item (Q33) was added: this has<br />
always been asked in the <strong>Postgraduate</strong> Taught <strong>Experience</strong> Questionnaire (PTES), but was introduced to<br />
<strong>PRES</strong> this year for possible comparison between taught and research students in relation to working<br />
outside their degree programmes.<br />
<strong>Survey</strong> Access Control<br />
In order to further ensure the robustness of the survey, in <strong>2011</strong> a new security procedure was made<br />
mandatory to all institutions participating in <strong>PRES</strong> and PTES. <strong>Survey</strong> Access Control requires each<br />
respondent to enter a username and password to complete the survey in order to ensure that it is only<br />
completed by members of the target population, and that no student is able to complete the survey more<br />
than once. Some institutions additionally purchased the ‘passing parameters’ module from BOS, which<br />
allowed them to run the survey via an existing portal or an embedded hyperlink, thus removing the need<br />
for students to explicitly type in (or copy-and-paste from their invitation email) their username and<br />
password. This additional measure was intended to remove any potential barriers to student<br />
participation, and participating institutions will be encouraged to use this module in future<br />
administrations of the survey.<br />
Participation<br />
Out of 97,571 students surveyed, 31,202 (32%) in total responded to <strong>PRES</strong> <strong>2011</strong>. This covers roughly 30%<br />
of the total PGR population in the UK according to comparisons with HESA data for 2009-10 5 .<br />
Table (i): Participation across the four years of <strong>PRES</strong><br />
<strong>PRES</strong> 2007 <strong>PRES</strong> 2008 <strong>PRES</strong> 2009 <strong>PRES</strong> <strong>2011</strong><br />
No. of HEIs 58 73 82 102<br />
No. of respondents 10,544 16,524 18,644 31,202<br />
National response rate 25.2% 28.9% 28.6% 32.0%<br />
As noted above, participation in <strong>PRES</strong>, both in number of institutions and number of student respondents,<br />
has risen over the four years of its administration. <strong>2011</strong> has been particularly encouraging in relation to<br />
increased engagement, with a 20% rise in the number of institutions taking part and nearly 13,000 more<br />
postgraduate students responding to the survey. This should give good assurance to those wishing to use<br />
4 One item where the introduction of N/A may have had an effect is Q10, referring to teaching opportunities. See<br />
Section 2.2.9 for comment.<br />
5 It should be noted, however, that the true proportion of all UK PGRs included in <strong>PRES</strong> <strong>2011</strong> will depend on the<br />
HESA figures for 2010-11, which are not yet available.<br />
7
<strong>PRES</strong> <strong>2011</strong> Results – September <strong>2011</strong><br />
the national level results for benchmarking their institutional performance, since the high response and<br />
participation rates mean that this year the survey is more robust than in any previous year.<br />
Enhancement year<br />
<strong>PRES</strong> is currently running on a two-year cycle, with survey years alternating with enhancement years.<br />
<strong>2011</strong>-12 will be an enhancement year, allowing HEIs the space to analyse, interpret and act upon their<br />
results, before running the survey again in Spring 2013. During this enhancement year, the HEA will<br />
provide support to the sector through events and resources, as well as to individual institutions. For more<br />
information about this support please visit our website: http://www.heacademy.ac.uk/postgraduateenhancement.<br />
8
<strong>PRES</strong> <strong>2011</strong> Results – September <strong>2011</strong><br />
Section 1<br />
Profile of respondents<br />
1.1 Demographics<br />
1.1.1 Gender<br />
The <strong>2011</strong> survey saw an almost exactly equal split between male respondents (N=15,314) and female<br />
(N=15,336) 6 . This makes the sample more representative in relation to gender (compared with HESA data)<br />
than in previous years.<br />
Table 1.1: Respondents by gender<br />
<strong>PRES</strong> 2009 <strong>PRES</strong> <strong>2011</strong> HESA 09-10<br />
Male 47% 50% 54%<br />
Female 53% 50% 46%<br />
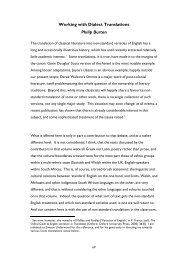
1.1.2 Age<br />
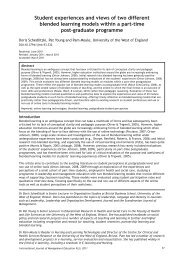
Nearly 60% of respondents were aged 30 or under (59.4%, compared with 57.8% in 2009), and 16.5%<br />
were over 40 (compared to 18.5% in 2009) (Figure 1.1). Nearly a third of respondents were in their first<br />
year of study, with the proportion of those further along in their studies decreasing progressively (Figure<br />
1.2).<br />
Figure 1.1: Respondents by age<br />
6 Throughout this report ‘N’ is used to indicate the number of respondents.<br />
9
<strong>PRES</strong> <strong>2011</strong> Results – September <strong>2011</strong><br />
Figure 1.2: Year on the programme<br />
1.1.3 Country of residence<br />
Nearly 60% of respondents identified their country of residence for fees purposes as UK (Table 1.2), with<br />
nearly 30% being Non EU and the remainder EU, which is roughly in line with HESA statistics for 2009-10<br />
(though it should be noted that this does not necessarily mean that they fall in the ‘UK’ category in<br />
relation to their normal place of residence) 7 . This is similar to 2009.<br />
Table 1.2: Country of residence<br />
<strong>PRES</strong> 2009 <strong>PRES</strong> <strong>2011</strong> HESA 09-10<br />
UK 58.2% 58.8% 58.1%<br />
Other EU 13.9% 12.3% 13.1%<br />
Non EU 27.8% 29.0% 28.8%<br />
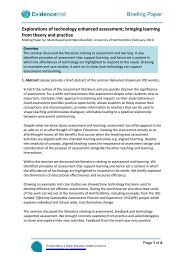
1.1.4 Disability<br />
5.0% of respondents said that they considered themselves to have a disability (this is a decrease from<br />
5.5% in 2009), 29.0% of whom identified this as a specific learning difficulty such as dyslexia, dyspraxia or<br />
AD(H)D (Figures 1.3 and 1.4).<br />
Figure 1.3: Q23 Respondents by disability<br />
7 Analysis of Q31 (‘What is your normal place of residence?’) is in Section 3.1.2.<br />
10
<strong>PRES</strong> <strong>2011</strong> Results – September <strong>2011</strong><br />
Figure 1.4: Q23 Respondents by type of disability<br />
As shown in Figure 1.5, when broken down by discipline a higher proportion of Arts & Humanities and<br />
Social Sciences students reported having a disability than those in science subjects.<br />
11
<strong>PRES</strong> <strong>2011</strong> Results – September <strong>2011</strong><br />
Figure 1.5: Differences in disability profile between disciplines<br />
Further analysis of the scales by disability is presented in Section 3.1.1.<br />
1.1.5 Ethnicity<br />
68.1% of respondents identified themselves as being of white background. This was the group with the<br />
largest change from 2009, decreasing by 4%.<br />
12
<strong>PRES</strong> <strong>2011</strong> Results – September <strong>2011</strong><br />
White: British/Irish/Any other<br />
white background<br />
8.4%<br />
3.9%<br />
8.7%<br />
2.9%<br />
8.0%<br />
Mixed: White and Black<br />
Caribbean/White and Black/White<br />
and Asian/Any other mixed<br />
background<br />
Asian or Asian British:<br />
Indian/Pakistani/Bangladeshi/Any<br />
other West or South Asian<br />
Background<br />
Black or Black British:<br />
Caribbean/African/Any other<br />
Black background<br />
68.1%<br />
Chinese: Chinese/Any other East<br />
Asian background<br />
Other<br />
Figure 1.6: Q32 Respondents by ethnicity<br />
1.2 Nature and type of programme<br />
1.2.1 Registered programme of study<br />
The majority of respondents were working towards a PhD: 73.3% were enrolled on a PhD already, and a<br />
further 14.0% were registered as MPhil with transfer to PhD. 7.0% were studying for an MPhil only<br />
(compared to 2.6% in 2009), and research Masters students comprised 2.4% of the total respondents.<br />
Figure 1.7: Q18 Respondents by type of course<br />
13
<strong>PRES</strong> <strong>2011</strong> Results – September <strong>2011</strong><br />
1.2.2 Mode of study and delivery<br />
The proportion of part-time students within the sample was smaller than in 2009 (see Table 1.3 below),<br />
with 81.1% of respondents this year being full-time and 18.9% part-time. There were similar proportions<br />
of face-to-face versus distance learners (82.5% and 17.5% respectively).<br />
Table 1.3: Q26 Respondents by mode of study<br />
<strong>PRES</strong> 2009 <strong>PRES</strong> <strong>2011</strong> HESA 09-10<br />
Full-time 78% 81% 71%<br />
Part-time 22% 19% 29%<br />
Figure 1.8: Q29 Respondents by mode of delivery<br />
1.2.3 Source of funding<br />
The percentage of students funding their PhDs themselves has fallen slightly from 2009, from 29.3% to<br />
28.5%. The proportion funded by their institution has risen slightly (25.4% as opposed to 23.9% in 2009),<br />
as has the proportion of those funded overseas (11.6% as opposed to 10.4% in 2009). The other<br />
categories have remained approximately the same.<br />
Figure 1.9: Q34 Source of funding<br />
Note: Respondents could choose more than one category hence percentages do not add up to 100%.<br />
14
<strong>PRES</strong> <strong>2011</strong> Results – September <strong>2011</strong><br />
1.2.4 Employment<br />
In this newly added item, 36.4% of respondents said that they were currently in paid employment, of<br />
whom 43.5% reported working more than 30 hours per week (Figure 1.11).<br />
Figure 1.10: Currently in paid employment<br />
Figure 1.11: Hours worked<br />
1.2.5 Activity in previous year<br />
35.1% of respondents had just completed a postgraduate course of study, and 18.1% an undergraduate<br />
degree – this is roughly similar to 2009.<br />
Figure 1.12: Q35 Activity in previous year<br />
1.2.6 Discipline<br />
The largest proportion of respondents by discipline was accounted for by Biology and related sciences<br />
(12.7%), followed by Physical sciences (8.2%) and Psychology (5%) 8 . The table below shows those<br />
disciplines for which there were more than 4.0% of respondents in the total sample.<br />
8 Analysis of the skills, professional development and motivations and careers items by discipline is in Section 3.2.<br />
15
<strong>PRES</strong> <strong>2011</strong> Results – September <strong>2011</strong><br />
Table 1.4: Q24 Discipline<br />
Discipline N % of respondents<br />
Biology and related sciences 3791 12.7%<br />
Physical sciences 2447 8.2%<br />
Psychology 1497 5.0%<br />
Civil, chemical and other engineering 1332 4.5%<br />
Computer science 1316 4.4%<br />
History and archaeology 1289 4.3%<br />
Electronic and electrical engineering 1280 4.3%<br />
16
<strong>PRES</strong> <strong>2011</strong> Results – September <strong>2011</strong><br />
Section 2<br />
<strong>PRES</strong> scales and items<br />
2.1 <strong>PRES</strong> scales<br />
2.1.1 Scale scores <strong>2011</strong><br />
Many of the individual items on specific themes within <strong>PRES</strong> can be grouped together to form scales,<br />
which provide a useful way of comparing the different elements of the survey 9 . Mean scale scores are<br />
presented in Table 2.1 for the <strong>2011</strong> <strong>PRES</strong> results. As with <strong>PRES</strong> 2009, the highest scoring scales were<br />
Supervision, Thesis Examination and Skills Development, while the scales with the lowest mean scores<br />
were Intellectual Climate and Professional Development and Career.<br />
The items within these scales utilise “Likert” scales; individuals are asked to select an option on a 5-point<br />
scale ranging from ‘strongly disagree’ to ‘strongly agree’, in response to positive statements about various<br />
aspects of their experience. Likert scales employ emotive terms (“agree” and “disagree”) and the options<br />
on the scale can thus not straightforwardly be treated as equally spaced. For instance, the difference in<br />
experience prompting responses of ‘agree’ and ‘strongly agree’ may not be as large as the difference in<br />
experience prompting responses of ‘neutral’ and agree’. As a Likert scale cannot be taken as a scale of<br />
equally-spaced options, it is not usually appropriate to average responses on a Likert scale into a mean<br />
response. This report uses mean responses solely for scales (see Table 2.1), and for the multiple<br />
regression analysis (see Section 2.1.3). For these purposes the report makes the assumption that the<br />
items on the Likert scale are equally-spaced (a common practice in reporting survey data). For all other<br />
purposes, the report uses the proportion of respondents who selected ‘agree’ or ‘strongly agree’; and<br />
whilst this does entail a loss of detail about those who selected other options, it is more appropriate given<br />
the non-equal nature of the options on the Likert scale. 10 . The practice of averaging scale scores into<br />
mean responses will be reviewed in advance of the publication of the next <strong>PRES</strong> report.<br />
Table 2.1: Mean scale scores<br />
Scale<br />
Items N Mean Rank<br />
Std.<br />
Deviation*<br />
Supervision 1a;1b;1c;1d;1e;1f 30896 4.18 1 .880<br />
Skills development 2a;2b;2c;2d 30689 4.08 3 .760<br />
Infrastructure 3a;3b;3c;3d;3e;3f 29857 3.91 5 .867<br />
Intellectual climate 4a;4b;4c;4d;4e 29847 3.65 6 .978<br />
Goals and standards 5a;5b;5c 30410 3.95 4 .912<br />
Thesis examination 6a;6b;6c;6d 1390 4.12 2 .988<br />
Professional development and career 7a;7b;7c 27874 3.31 7 1.094<br />
* Standard deviation is a measurement indicating amount of variation from the mean. A low number indicates that<br />
the scores tend to be closer to the mean; a high number indicates that the scores are more spread out.<br />
2.1.2 Scale scores over time<br />
<strong>PRES</strong> has been running since 2007, which allows us to observe trends in the data over the different<br />
years it has run (2007, 2008, 2009 and <strong>2011</strong>). As can be seen from Table 2.2 and Figure 2.1, there has<br />
9 The appropriateness of grouping these <strong>PRES</strong> items into scales has been validated by factor analysis, see Park<br />
(2009). These results are supported by factor analysis carried out for the <strong>Postgraduate</strong> <strong>Research</strong> <strong>Experience</strong><br />
Questionnaire in Australia, upon which <strong>PRES</strong> is based, see Marsh et al. (2002).<br />
10 For background about this common issue in statistical reporting, see Knapp (1990). Data regarding disagreement<br />
and neutrality are included in the full tables in Appendix A.<br />
17
<strong>PRES</strong> <strong>2011</strong> Results – September <strong>2011</strong><br />
been a general upward trend in scale scores over the four years, with the most notable increase being<br />
between 2009 and <strong>2011</strong>.<br />
Table 2.2: Mean scale scores 2007-<strong>2011</strong><br />
Scale <strong>PRES</strong> 2007 <strong>PRES</strong> 2008 <strong>PRES</strong> 2009 <strong>PRES</strong> <strong>2011</strong><br />
Supervision 3.93 4.02 4.03 4.18<br />
Skills development 3.86 3.96 3.97 4.08<br />
Infrastructure 3.62 3.70 3.75 3.91<br />
Intellectual climate 3.40 3.45 3.50 3.65<br />
Goals and standards 3.80 3.79 3.81 3.95<br />
Thesis examination 3.96 4.01 3.92 4.12<br />
Professional development and career N/A* 3.00 3.14 3.31<br />
* This scale was not used in <strong>PRES</strong> 2007.<br />
Figure 2.1: Mean scale scores 2007-<strong>2011</strong><br />
2.1.3 Multiple regression<br />
Multiple regression analysis has been used to determine which of the scales included in <strong>PRES</strong> have the<br />
strongest impact on overall experience (Q15g). The seven scales combined accounted for just under half<br />
of the variance (49.4%) in overall experience. This is considered to be a medium effect: the individual<br />
scales capture about half of what impacts on PGRs’ responses to the overall experience item.<br />
Table 2.3: Effect of scales on overall experience, Q15g<br />
Scale<br />
Beta coefficient<br />
Supervision 0.290<br />
Intellectual climate 0.209<br />
Professional development and career 0.185<br />
Thesis examination 0.110<br />
Skills development 0.096<br />
Table 2.3 shows the results of the multiple regression analysis for individual scales, with respect to overall<br />
experience. Only five scales are included, as neither the Infrastructure nor the Goals and Standards scales<br />
were found to have a statistically significant relationship with overall experience. The strength of each<br />
scale in explaining the variance in the students’ overall experience evaluations is expressed by the beta<br />
18
<strong>PRES</strong> <strong>2011</strong> Results – September <strong>2011</strong><br />
coefficient: the higher the beta value, the more important the scale. The analysis shows that – as in<br />
previous years of <strong>PRES</strong> – the Supervision scale had the strongest impact on how research students rated<br />
their overall experience, followed by the Intellectual Climate scale, and the Professional Development and<br />
Career scale. The only other two statistically significant factors were the Thesis Examination and Skills<br />
Development scales. These results are consistent with similar analysis carried out for <strong>PRES</strong> 2007 and<br />
2008, which also showed that Supervision and Intellectual Climate were the strongest predictors of<br />
overall experience 11 .<br />
2.2 Responses to <strong>PRES</strong> by item<br />
The figures below present responses to the individual items, both those included in the scales described<br />
above and other items that do not comprise scales (such as the items relating to teaching opportunities<br />
(Q10-Q12), importance of various factors (Q9), and experience against expectations (Q15)). Full tables<br />
containing percentage responses to each item and numbers of respondents are contained in Appendix<br />
A.<br />
The <strong>PRES</strong> questionnaire uses a five-point scale for most items (with 1 being ‘strongly disagree’ and 5 being<br />
‘strongly agree’), which has been converted for this report into a three-point scale comprising ‘disagree’<br />
(responses 1 and 2), ‘neutral’ (response 3) and ‘agree’ (responses 4 and 5). The locution ‘% agree’ has<br />
been used in the charts and tables below to indicate the aggregation of responses 4 and 5 on the fivepoint<br />
scale.<br />
2.2.1 Supervision (Q1)<br />
The supervision items comprise the highest scoring scale in <strong>PRES</strong>: in particular, 87.5% of respondents<br />
said that their supervisor had the skills and subject knowledge to adequately support their research<br />
(Q1a). This is especially encouraging given that, as described above, the Supervision scale is the<br />
strongest predictor of overall experience. Respondents were less positive in response to Q1d regarding<br />
guidance given for the literature search (although it could be argued that this is not necessarily overly<br />
problematic given the nature of doctoral study); nevertheless, this item showed the largest change from<br />
2009 of all the items in the scale, the % agree increasing by 5.6%. The ranking of items within this scale<br />
by % agree is consistent over all years of the survey.<br />
11 Preliminary multi-level modelling also indicates that the institutional effect on overall experience (Q15g) is<br />
remarkably small: only 0.9% of the variance for that item. In comparison, when experience of supervision is added<br />
to the model 27% of the total variance is accounted for. Further analysis would be required to confirm the<br />
suggestion that institution has only a minimal effect on a PGR’s experience of their research programme, but this<br />
would be consistent with findings from the National Student <strong>Survey</strong> (see Surridge 2009).<br />
19
<strong>PRES</strong> <strong>2011</strong> Results – September <strong>2011</strong><br />
Figure 2.2: Supervision items, % agree, Q1<br />
2.2.2 Skills Development (Q2)<br />
Skills Development is also a high scoring scale, with respondents being particularly positive that their<br />
experience so far has improved their ability to learn independently (Q2d) and their analytical skills (Q2b),<br />
these items ranking first and second highest respectively by % agree, as was the case in all previous years.<br />
Not only has Q2d been the highest ranked item for every year, it also has the most consistent result: the<br />
average change in score between years of the survey for that item is only 1.43%. The only important<br />
change in ranking is for Q2e, which was fifth (second to last) in % agree (by some distance) in 2007 and<br />
2008, but is ranked third in <strong>2011</strong>. This change is largely due to an abrupt 9.2% change between 2008 and<br />
2009. The change for that item between 2009 and <strong>2011</strong> was 5.3%. The largest change in % agree between<br />
2009 and <strong>2011</strong> was for Q2f, the lowest scoring item, which nevertheless increased by 6.7%. There is more<br />
clustering in the <strong>2011</strong> results for the different items in Q2 than in previous years, evident in the fact that<br />
the gap between the highest and lowest scoring item (Q2d and Q2f respectively) has narrowed markedly<br />
over the years of the survey, decreasing from 22.2% in 2007 to 12.8% in <strong>2011</strong>.<br />
Figure 2.3: Skills Development items, % agree, Q2<br />
20
<strong>PRES</strong> <strong>2011</strong> Results – September <strong>2011</strong><br />
2.2.3 Infrastructure (Q3)<br />
Respondents were relatively positive in response to the Infrastructure items; markedly less so for Q3c<br />
about appropriate financial support for research activities, although this is perhaps unsurprising given<br />
the inevitable competition for funding. The ranking of these items by % agree is consistent for the years<br />
2008, 2009 and <strong>2011</strong>. The biggest increase from 2009 is for Q3f, for which % agree has increased by<br />
7.1%.<br />
Figure 2.4: Infrastructure items, % agree, Q3<br />
2.2.4 Intellectual Climate (Q4)<br />
Intellectual Climate scored the second lowest of all the scales in <strong>PRES</strong>. Just under a third of respondents<br />
agreed that their department provided opportunities for social contact with other research students<br />
(Q4a), to become involved in the broader research culture (Q4b), or a good seminar programme for<br />
research students (Q4e), while only just over half agreed that they felt integrated into their department’s<br />
community, and nearly a quarter disagreed (Q4d). As with the other scales, there is a high level of<br />
consistency between the years in ranking by positivity; the ranking of the intellectual climate items, by %<br />
agree, is consistent over all years of the survey. The biggest change between 2009 and <strong>2011</strong> is for Q4a, for<br />
which % agree increased by 6%.<br />
21
<strong>PRES</strong> <strong>2011</strong> Results – September <strong>2011</strong><br />
Figure 2.5: Intellectual Climate items, % agree, Q4<br />
2.2.5 Goals and Standards (Q5)<br />
This was the fourth highest scale in <strong>PRES</strong>: responses were generally positive, with between 75% and 78%<br />
agreeing on all items except for understanding the requirements of thesis examination (Q5c), for which<br />
below 70% agreed. The ranking of these items by % agree is consistent across all years of the survey. The<br />
biggest change from 2009 is for Q5c, for which % agree increased by 5.5%.<br />
Figure 2.6: Goals and standards items, % agree, Q5<br />
2.2.6 Thesis Examination (Q6)<br />
This scale yields a much smaller set of data, due to the small numbers of respondents who had completed<br />
their final examination: only 4.6% (N=1,401) of the total respondents responded to these items. The most<br />
positive results were for Q6a(i), and the least positive were for Q6a(iii). The ranking of these items by %<br />
agree is consistent over all years of the survey. The largest change from 2009 is for Q6a(iv), for which %<br />
agree increased by 10.5%. % agree for Q6a(ii) only increased by 1.8%.<br />
22
<strong>PRES</strong> <strong>2011</strong> Results – September <strong>2011</strong><br />
Figure 2.7: Thesis Examination items, % agree, Q6<br />
2.2.7 Professional Development and Career (Q7)<br />
This has been the least positive scale since it was introduced in 2008, and that trend continues with the<br />
<strong>2011</strong> results. Despite being the least positive scale, however, it has the third largest effect on overall<br />
experience. Within the scale, Q7a is the least positive, and in fact is the least positive of all items in the<br />
survey, whether rated by % agree (as it has the lowest level) or % disagree (as it has the highest level) 12 . It<br />
has been the most negative item in the scale for all years of the survey, and the ranking of all these items<br />
by % agree is consistent over all years. % agree for Q7a has increased by 6.8% from 2009. The largest<br />
increase in % agree from 2009 for the scale, however, is for Q7c, which increased by 7.3%.<br />
Figure 2.8: Professional Development and Career items, % agree, Q7<br />
12 While Q14c does technically have both a higher result for % disagree and a lower result for % agree, this does not<br />
express greater ‘negativity’ than Q7a as Q14c is phrased negatively in the first place.<br />
23
<strong>PRES</strong> <strong>2011</strong> Results – September <strong>2011</strong><br />
2.2.8 Roles and responsibilities (Q8)<br />
While respondents were generally less positive about these items, Q8c is markedly more positive than the<br />
other items in this group, with a % agree that is 15.6% higher than the next most positive item (Q8a). The<br />
fact that the difference between Q8c and Q8d is 16.3% is interesting given that they address two sides of<br />
the same issue: the responsibilities of the students themselves, and the responsibilities of institutions.<br />
The largest change from 2009 is for Q8b, for which % agree has increased by 6%. The ranking of % agree is<br />
reasonably consistent over the years of the survey.<br />
Figure 2.9: Roles and responsibilities items, % agree, Q8<br />
2.2.9 Teaching opportunities (Q10, Q11, Q12)<br />
As with the items on roles and responsibilities, there is a divergence of scores for these items, with Q12<br />
having a % agree that is 13.4% higher than the next most positive item (Q10). That difference has been<br />
roughly consistent since these items were included in the survey in 2008, and the ranking of the three<br />
items by % agree has been consistent in that time. It is interesting to note the greater positivity that<br />
respondents expressed about the experience of teaching, compared to the opportunities and support for<br />
that teaching. The largest change from 2009 has been for Q10, for which the % agree has increased by<br />
8.2%. The N/A option was introduced for Q10 in <strong>2011</strong>, and the number selecting that option was high<br />
(22.5%): caution is thus required when drawing conclusions about the increase from 2009 for that item.<br />
24
<strong>PRES</strong> <strong>2011</strong> Results – September <strong>2011</strong><br />
Figure 2.10: Teaching opportunities items, % agree, Q10, Q11, Q12<br />
2.2.10 Personal factors (Q14)<br />
The scores for these items vary greatly, which is perhaps unsurprising given that they cover very different<br />
issues. With a % agree of 88.9%, Q14a receives the most positivity out of all the items on the survey. It is<br />
inappropriate to compare Q14c with scores for other items, as the item is the only one in the survey<br />
where the phrasing is negative, thus reversing the normal implication of greater positivity where there is<br />
a higher % agree. While the % agree for Q14c has decreased by 2% since 2009, given the negative<br />
phrasing of the statement this is consistent with the general trend of increased positivity apparent in the<br />
<strong>2011</strong> results. The ranking of the items in this group by % agree is consistent over all years (Q14c was<br />
introduced in 2008). The largest change from 2009 is for Q14b, for which % agree increased by 3.3%. The<br />
change for Q14a is only 0.3%, and this is the smallest change in % agree for any of the items in the survey.<br />
Figure 2.11: Personal factors items, % agree, Q14<br />
25
<strong>PRES</strong> <strong>2011</strong> Results – September <strong>2011</strong><br />
2.2.11 Importance of aspects of degree programme (Q9)<br />
Figure 2.12: Ratings of importance, Q9<br />
Note: This item uses a five-point scale where 1 = not important and 5 = very important. Figure 2.12 uses an<br />
‘importance’ rating, which is an aggregation of options 4 and 5.<br />
The results for these items show very clearly the importance of supervision to respondents. The lowest<br />
importance score was for the development of transferable skills. It is interesting to compare the results<br />
for this section with the multiple regression data discussed above, which looks at the effect of the scales<br />
on the overall experience of respondents (see Section 2.1.3). While the options Q9a-Q9f do not map<br />
directly on to the scales of the survey, there are enough similarities to make comparisons.<br />
<strong>Experience</strong> of supervision (Q9a) is both the highest scoring of the options in Q9 and also the scale that has<br />
the largest effect on overall experience, which is encouraging. The second highest scoring option was on<br />
research skills (Q9b), to which there are two scales most relevant: Skills Development (Q2) and<br />
Professional Development and Career (Q7). Despite the importance of research skills to respondents, the<br />
Skills Development scale was found to have the least effect on overall experience, although the<br />
Professional Development and Career scale did have the third largest effect. The Intellectual Climate scale<br />
(Q4) had the second largest effect on overall experience according to the multiple regression analysis, but<br />
as Figure 2.12 shows the research environment option (Q9e) only received the fourth highest score for<br />
importance.<br />
The ranking of these aspects by importance is consistent over all the years of the survey, apart from 2007<br />
when access to facilities was rated as more important than developing research skills. There has been<br />
little change in rating of importance since 2009: none of the importance ratings changed by more than<br />
0.6%.<br />
26
<strong>PRES</strong> <strong>2011</strong> Results – September <strong>2011</strong><br />
2.2.12 Expectations versus experience (Q15a-Q15f)<br />
Figure 2.13: Expectations versus experience, Q15a-Q15f<br />
Note: This item uses a seven-point scale from -3 to +3, where: -3 = ‘it is much more negative’, 0 = ‘it has met my<br />
expectations’, and +3 = ‘it is much more positive’. Figure 2.13 uses an ‘expectations met or exceeded’ rating, which<br />
is an aggregation of options 0, +1, +2 and +3.<br />
The results for meeting or exceeding expectations are less diverse than for ratings of importance. The<br />
highest rated area is developing research skills (Q15b), with 87.7%, and the lowest is guidance on<br />
standards and expectations (Q15f), with 79.8%. This difference of 7.9% contrasts with a gap of 25.7%<br />
between the highest and lowest rated items for importance (Q9). The ranking of the different areas over<br />
all the years of the survey shows some consistency: developing research skills (Q15b) has been the top<br />
rated area for every year, and research environment (Q15e) and the provision of guidance on standards<br />
have been the two lowest rated areas for every year (Q15f). The biggest change from 2009 is for research<br />
environment (Q15e), for which expectations met or exceeded has increased by 3.3%.<br />
Comparing the ratings for importance with those for experience against expectations, the two areas<br />
where there is a marked discrepancy are for supervision and the development of transferable skills. For<br />
supervision, respondents felt that the area was particularly important to the completion of their studies,<br />
but did not especially feel that their expectations had been met or exceeded, possibly raising an area of<br />
concern (especially given the fact that supervision has the most powerful impact of all the scales on<br />
overall experience), although the Supervision scale was the most positive scale of the survey. With regard<br />
to developing transferable skills, respondents felt to a reasonably high degree that their expectations had<br />
been met or exceeded (it was the second most positive area), but this was an area that they felt was<br />
markedly less important to their studies than other areas.<br />
27
<strong>PRES</strong> <strong>2011</strong> Results – September <strong>2011</strong><br />
2.2.13 Importance versus positivity<br />
We can draw together some of the data already presented in this report to give a useful overview of the<br />
different scales. Given the broad similarity in focus between the scales and the options in Q9 and Q15, we<br />
can compare the following properties of the scales: i) effect on overall experience; ii) rating of importance<br />
by respondents; iii) positivity; and iv) extent to which it has met or exceeded expectations. While (i) and<br />
(ii) address the importance that is attached to the particular elements of respondents’ experiences, (iii)<br />
and (iv) address the level of favourability they express towards those elements.<br />
Table 2.4: Importance versus positivity<br />
Scale<br />
Supervision<br />
Most similar<br />
option from Q9<br />
Supervisory<br />
support and<br />
guidance (Q9a)<br />
The research<br />
environment (Q9e)<br />
Scales by effect<br />
on overall<br />
experience a<br />
Q9 by<br />
importance<br />
Ranking<br />
Scales by<br />
positivity<br />
b<br />
Q15 by<br />
expectations<br />
met or exceeded<br />
1 1 1 3<br />
Intellectual<br />
climate<br />
2 4 6 5<br />
Professional<br />
development N/A c 3 N/A 7 N/A<br />
and career<br />
Thesis<br />
examination d N/A c 4 N/A 2 N/A<br />
Skills<br />
development e<br />
Infrastructure<br />
Goals and<br />
standards<br />
Opportunities to<br />
develop a range of<br />
research skills<br />
(Q9b)<br />
Opportunities to<br />
develop a range of<br />
transferable skills<br />
(Q9c)<br />
Access to<br />
appropriate<br />
facilities (Q9d)<br />
Provision of<br />
guidance on<br />
institutional<br />
standards and<br />
expectations for<br />
your research<br />
degree programme<br />
(Q9f)<br />
5 2 3 1<br />
5 6 3 2<br />
6 f 3 5 4<br />
6 f 5 4 6<br />
a According to multiple regression analysis on Q15g (see Section 2.1.3).<br />
b According to mean scores for scales (see Section 2.1.2).<br />
c There are no suitably similar options in Q9.<br />
d Only a small proportion of respondents submitted responses for this scale (4.6%).<br />
e There are two options in Q9 that are similar to the skills scale, relating to research skills (Q9b) and transferable<br />
skills (Q9c).<br />
f These two scales were shown by the multiple regression analysis to have no effect on overall experience (see<br />
Section 2.1.3.).<br />
28
<strong>PRES</strong> <strong>2011</strong> Results – September <strong>2011</strong><br />
Table 2.4 shows that not only is supervision the most important element of their experience (rated either<br />
by effect on overall experience or reported importance) it is also an area where respondents are broadly<br />
happy, although there is some room for improvement in relation to meeting or exceeding their<br />
expectations. The development of research skills, about which respondents are positive, is rated as<br />
relatively important by them, but multiple regression analysis shows that their views on that scale have a<br />
relatively small effect on their ratings of their overall experience. This phenomenon – a difference<br />
between reported importance and the results of multiple regression analysis – is also seen with regard to<br />
infrastructure. The table suggests that the provision of clear goals and standards is an area that may<br />
require attention if it is to have impact, as it is not important to respondents (either by rating or by impact<br />
on overall experience), nor are they particularly positive about that element of their experience.<br />
2.2.14 Overall experience of research programme (Q15g)<br />
The results for this overall item have increased over every year of <strong>PRES</strong>. The change from 2009 (in<br />
expectations met or exceeded) is 2.2%. This comprised an increase in ‘met expectations’ of 1.2% and an<br />
increase in ‘exceeded expectations’ of 1%. The increase for Q15g from 2009 is in line with the other<br />
elements Q15a-Q15f, which increased (for ‘expectations met or exceeded’) from between 1.8% to 3.3%.<br />
The increase from 2009 to <strong>2011</strong> is the largest of any of the increases between years of <strong>PRES</strong>; again, this is<br />
in line with the general trend for the survey 13 .<br />
Figure 2.14: Overall experience versus expectations, Q15g<br />
13 The average increase for items Q15a-Q15g for 2009 to <strong>2011</strong> is 2.53%, as compared with 1.03% for 2007 to 2008,<br />
and 1.93% for 2008 to 2009.<br />
29
<strong>PRES</strong> <strong>2011</strong> Results – September <strong>2011</strong><br />
2.2.15 Completion within timescale (Q16)<br />
The results for this item have increased every year since 2007. The change from last year is 4.7%.<br />
Figure 2.15: Confidence about completion within timescale, % agree, Q16<br />
30
<strong>PRES</strong> <strong>2011</strong> Results – September <strong>2011</strong><br />
Section 3<br />
Detailed analysis<br />
This section contains detailed analysis of aspects of the national-level <strong>PRES</strong> results using two different and<br />
complementary approaches. The first approach focuses on two demographic variables – domicile and<br />
disability – and considers responses to scales in relation to those variables. The second approach focuses<br />
on a particular set of items, those that relate to skills and professional development, and considers what<br />
the responses to those items show, particularly when broken down by age, gender and discipline.<br />
Tables of selected results for Section 3 are included in Appendix B 14 .<br />
This section looks at associations between responses to items (and scales) in <strong>PRES</strong> <strong>2011</strong> and particular<br />
demographic characteristics of the respondents (e.g. age, gender etc.). All the associations investigated<br />
are statistically significant unless otherwise stated, meaning that, for example, there is a genuine<br />
association between discipline group and response to Q19 (main motivation for pursuing a research<br />
degree programme, see Figure 3.9), an association that is not just due to random fluctuations in the<br />
data 15 .<br />
While all such associations are statistically significant, that does not mean that all displayed differences<br />
between all sub-groups are statistically significant. Where such differences are small, caution should be<br />
exercised when drawing conclusions.<br />
3.1 Focus on domicile and disability<br />
By analysing the results through the lens of demographic variables, a rich picture of the experiences of<br />
students in particular groups can be drawn. By, for example, exploring the responses of students from<br />
different domicile backgrounds across all of the items, it is possible to identify potential areas of interest<br />
to institutions in supporting their students. Disability and domicile have been selected as they are key<br />
areas of interest for institutions. Both the identification of oneself as having a disability – as well as the<br />
type of that disability – and the domicile background can have a powerful effect on students’ experiences,<br />
their expectations, and their needs.<br />
3.1.1 Disability<br />
5% of students in the <strong>PRES</strong> dataset considered themselves to have a disability. This is in line with national<br />
HESA figures as well as the <strong>Postgraduate</strong> Taught <strong>Experience</strong> <strong>Survey</strong> (PTES). As can be seen from Table 3.1<br />
below, mean scale scores for those who identified themselves as having a disability are uniformly lower<br />
than those with no disability, although the rank order of the scales remains the same, with Supervision<br />
top and Professional Development and Career at the bottom (the Thesis Examination scale is not<br />
statistically significant when filtered by disability so is not included in the rank order).<br />
Table 3.1: Average scale scores by disability/no disability<br />
Disability No disability Overall average<br />
Supervision scale 4.04 4.19 4.18<br />
Skills development scale 3.94 4.09 4.08<br />
14 Tables have been included in Appendix B where the corresponding charts in Section 3 do not include data labels.<br />
15 Statistical significance of associations between variables was tested using Pearson’s chi -square or ANOVA, and all<br />
attained a significance level of 0.01 or lower (indicating that the probability of the association b eing a chance effect<br />
is 1 in 100 or less). For more information about statistical significance and other statistical concepts used in this<br />
report, see Statsoft (<strong>2011</strong>).<br />
31
<strong>PRES</strong> <strong>2011</strong> Results – September <strong>2011</strong><br />
Infrastructure scale 3.71 3.92 3.91<br />
Intellectual climate scale 3.51 3.66 3.66<br />
Goals and standards scale 3.83 3.96 3.95<br />
Thesis examination scale* 4.09 4.12 4.12<br />
Professional development and career scale 3.06 3.33 3.31<br />
*Differences for this scale are not statistically significant.<br />
The differences are much more pronounced than for the scales listed above, however, when the two<br />
groups are compared on the experience versus expectations items (Q15), which do not comprise a scale.<br />
On all items in Q15, the expectations of those who did not consider themselves to have a disability were<br />
met or exceeded 4.7% to 8.4% more than those who did, with the largest difference for Q15g, which asks<br />
about overall experience.<br />
Figure 3.1: <strong>Experience</strong> against expectations items by disability/no disability, % expectations met or<br />
exceeded, Q15<br />
Note: The ‘N’ is the total number of respondents to the item. Where more than one item is grouped within a chart,<br />
the N is approximate as there are small differences in the number of respondents for each of the items.<br />
Figure 3.2 shows the difference on scale scores between different types of disability (though while they<br />
have been included for the sake of completeness, it should be noted that differences for the Supervision<br />
and Infrastructure scales are not statistically significant 16 ).<br />
16 The thesis examination scale was removed due to a very small number of respondents to those items.<br />
32
<strong>PRES</strong> <strong>2011</strong> Results – September <strong>2011</strong><br />
Figure 3.2: Differences on scale scores between types of disability, mean scale score<br />
*Differences for these two scales are not statistically significant. For the full wording of each category, please refer<br />
to Figure 1.4.<br />
3.1.2 Domicile<br />
Nearly half (47.2%) of respondents to <strong>PRES</strong> identified their normal place of residence as England, with the<br />
next most common country being Scotland (6.8%), followed by China (4.2%) and Wales (3.3%). Having<br />
indicated the country of their normal place of residence, respondents were organised into ‘country<br />
groups’ following HESA’s classification:<br />
Figure 3.3: Students across country groups (by normal place of residence)<br />
33
<strong>PRES</strong> <strong>2011</strong> Results – September <strong>2011</strong><br />
Figure 3.4: Differences in mean scale scores between major country groups (by normal place of<br />
residence) 17<br />
There are no particularly large differences between country groups on the mean scale scores, although<br />
students from Africa were in general most positive about their experience, followed by those from Asia.<br />
Students from North America, UK and the Middle East were generally less positive. This is also borne out<br />
quite strikingly in Q15g ‘overall experience of my research programme’, in response to which the<br />
expectations of students from Africa and Asia exceeded by about 13% those from the UK 18 :<br />
Figure 3.5: Overall experience of my research programme by country group (by normal place of<br />
residence), Q15g<br />
17 Major country groups are those with 3.7% share or more.<br />
18 There are no statistically significant differences for Q15g between UK countries.<br />
34
<strong>PRES</strong> <strong>2011</strong> Results – September <strong>2011</strong><br />
Separating responses to Q15 by country of residence for fees purposes 19 shows that ‘Other EU’ was the<br />
least positive group for all items except Q15f (relating to guidance on institutional standards and<br />
expectations), and ‘Non EU’ was the most positive group for all items except those relating to skills (Q15b<br />
and Q15c) 20 .<br />
Figure 3.6: <strong>Experience</strong> against expectations items by country of residence for fee status, Q15<br />
3.2 Focus on skills and professional development<br />
This section adopts a different approach to Section 3.1 (which took particular demographic variables as<br />
the primary focus) by exploring the skills and professional development scales (Q2 and Q7), and the<br />
items focused on motivations and anticipated career (Q19 and Q20). The issue of skills and professional<br />
development is particularly relevant to HEIs at the current time, when dedicated ‘Roberts’ funding has<br />
ceased, yet the <strong>Research</strong> Councils still expect institutions to continue to take forward the Roberts<br />
agenda 21 .<br />
Given the continued importance of the Roberts agenda in the face of increased funding constraints,<br />
more information regarding research students’ perceptions of the training and support they receive<br />
could be of use to institutions in ensuring that their provision is targeted, well attended, and has the<br />
greatest impact possible. In that context, it is worrying that the Professional Development and Career<br />
scale consistently yields the least positive responses of all the scales in <strong>PRES</strong>. This section focuses on this<br />
19 As noted in Section 1, this is different to normal place of residence.<br />
20 When aggregated into ‘below my expectations’, ‘met my expec tations’ and ‘exceeded my expectations’, Home<br />
students’ expec tations were exceeded less than those of the other groups, and Other EU students’ experiences were<br />
below expectations more than any other group.<br />
21 The ‘Roberts’ funding derived from the Roberts Review of 2002, which made recommendations relating to the<br />
employability and career planning of PhD students and research staff and funding for their career development and<br />
transferable skills training; see Roberts (2002). For the expectations of the <strong>Research</strong> Councils around researcher<br />
development see RCUK (2010).<br />
35
<strong>PRES</strong> <strong>2011</strong> Results – September <strong>2011</strong><br />
area aiming to contribute to an understanding of students’ motivations, aspirations, what they consider<br />
important and unimportant, and what they think of their current provision.<br />
In the following sections, 3.2.1 to 3.2.3, the items in <strong>PRES</strong> relating to motivations, career aspirations, skills<br />
and professional development are broken down by particular variables: discipline, gender, age, and<br />
source of funding 22 . The analyses are of necessity only snapshots of particular groups of postgraduate<br />
researchers’ perceptions of their skills and professional development, but they suggest that there are<br />
differences between demographic groups that it may be useful for institutions to explore further, using<br />
their own results and through other methods (such as focus groups) in order to establish effective ways of<br />
engaging researchers in skills and professional development training and to continue to promote the<br />
Roberts agenda.<br />
3.2.1 Motivations and career aspirations<br />
As with previous years of <strong>PRES</strong>, across the whole sample interest in the subject was the most commonly<br />
selected main motivation for pursuing a research degree (36.9%) followed by improving career prospects<br />
for an academic/research career (30.5%).<br />
Figure 3.7: The main motivation for me pursuing a research degree programme was..., Q19<br />
Regarding anticipated career, 57.7% of respondents said that they anticipated a career in higher<br />
education (44.3% teaching only and/or teaching and research, and 13.4% research only). It is notable that<br />
42.3% did not have a career in HE in mind given the presumption commonly made that PhD students<br />
overwhelmingly intend to enter academic careers. It is also interesting to compare the 44.3% of <strong>PRES</strong><br />
respondents who were intending to have a career as lecturers with research from Vitae that suggested<br />
only 14% of doctoral graduates from the period 2003-2007 have actually gone on to hold that post 23 .<br />
22 A general rule of thumb has been adopted in which a difference of 5% between respondents of different types<br />
who agree (agree + strongly agree) with each item is considered to be of potential practical significance and has<br />
been explored. Where the word ‘significant’ is used in the following text this is to indicate practical significance in<br />
that sense, unless otherwise indicated, rather than statistical significance.<br />
23 See Vitae (2009).<br />
36
<strong>PRES</strong> <strong>2011</strong> Results – September <strong>2011</strong><br />
Figure 3.8: What type of career do you have in mind for when you complete your research degree? Q20<br />
This item also allows respondents to enter a free-text comment. Frequent response types included: a<br />
combination of all the factors (with the combination of interest and career being common); a long-held<br />
ambition; a desire to help people; to exercise the brain and expand knowledge; and the lack of other<br />
options 24 .<br />
3.2.1.1 Discipline<br />
<strong>Research</strong> on the National Student <strong>Survey</strong> has found that, for that survey, subject of study has a large<br />
effect on overall experience 25 . Similar effects are suggested by analyses performed on data from the<br />
<strong>Postgraduate</strong> <strong>Research</strong> <strong>Experience</strong> Questionnaire in Australia, upon which <strong>PRES</strong> is based 26 . These findings<br />
from other surveys provide a rationale for splitting <strong>PRES</strong> data into separate discipline clusters.<br />
There are indeed some interesting differences when responses to Q19 (motivations for undertaking<br />
postgraduate research) are broken down by discipline area (see Figure 3.9). A larger proportion of Arts &<br />
Humanities students were motivated by an interest in the subject (43.5% of Arts & Humanities<br />
respondents chose this option, as opposed to 36.4% STEM, 34.8% Social Sciences and 28.2% Health). The<br />
largest proportion of students motivated by improving academic career prospects was in Health<br />
disciplines (37.4%) closely followed by Social Sciences (35.7%), with Arts & Humanitie s (30.2%) and STEM<br />
(27.7%) much lower.<br />
24 Analysis has not at this time been performed on the fr ee-text data; this is an initial assessment of responses only.<br />
It is hoped that participating institutions will obtain valuable information at local level from the free-text data.<br />
25 See Surridge (2009).<br />
26 See Marsh et al. (2002).<br />
37
<strong>PRES</strong> <strong>2011</strong> Results – September <strong>2011</strong><br />
Figure 3.9: Main motivation by discipline group, Q19<br />
Regarding anticipated career (Q20), larger proportions of Arts & Humanities and Social Sciences students<br />
than those from STEM and Health anticipated a career in higher education teaching or research and<br />
teaching (59.6% and 55.6% for Arts & Humanities and Social Sciences respectively, and 37.1% and 36.4%<br />
for Health and STEM). Perhaps unsurprisingly given the greater range of career options in the se areas,<br />
STEM and Health students were more likely than Social Sciences and Arts & Humanities students to<br />
anticipate purely research careers, whether inside or outside of higher education.<br />
Figure 3.10: Anticipated career by discipline group, Q20<br />
38
<strong>PRES</strong> <strong>2011</strong> Results – September <strong>2011</strong><br />
3.2.1.2 Gender<br />
When disaggregated by gender, there are some pronounced differences in the motivations expressed by<br />
men and women. As Figure 3.11 below shows, a larger proportion of men were motivated by their<br />
interest in the subject than women (38.9% male versus 34.6% female), while women were more<br />
motivated than men by improving their prospects for a career in academia (52% female versus 48%<br />
male). However, this is likely to be a feature of the proportions of men and women within each discipline<br />
group. There are no large differences for Q19 for different genders within each discipline (though male<br />
students are marginally more motivated by an interest in the subject). The overall gender difference for<br />
Q19 is therefore likely to be due to discipline differences for Q19 (see Figure 3.9) combined with differing<br />
gender proportions within those discipline groups 27 .<br />
Figure 3.12 shows that a roughly equal proportion of men and women anticipated a career in higher<br />
education teaching and/or teaching and research, while a slightly greater proportion of women than men<br />
said that they anticipated a career in higher education research only (14.1% female versus 12.6% male).<br />
Figure 3.11: Main motivation by gender, Q19<br />
27 In particular, Health students are more motivated by improving academic career prospects than other students,<br />
and Health has a disproportionately large number of female students (63%).<br />
39
<strong>PRES</strong> <strong>2011</strong> Results – September <strong>2011</strong><br />
Figure 3.12: Anticipated career by gender, Q20<br />
Comparison between the <strong>PRES</strong> results and the HESA data for academic staff 2009-10 is shown in Figure<br />
3.13. In this figure the percentages shown for the <strong>PRES</strong> results are not (as has been the case with the<br />
other figures) the proportions within each gender who selected the option, but the proportions for each<br />
gender within the group that selected the option. This provides a better comparison with the HESA data,<br />
by showing the proportions of total <strong>PRES</strong> respondents by gender who anticipated particular careers,<br />
compared to the proportions of individuals with those careers. As Figure 3.13 shows, for both types of<br />
career there are more men than women in that role in HE. This contrasts with the <strong>PRES</strong> results, which<br />
show that for an academic career (teaching, or teaching and research) the proportions anticipating that<br />
career are equal, whereas for an HE research career only the difference is even more stark 28 .<br />
28 The HESA data is available here: http://www.hesa.ac.uk/dox/dataTables/staff/download/staff0910.xls?v=1.0 .<br />
40
<strong>PRES</strong> <strong>2011</strong> Results – September <strong>2011</strong><br />
Figure 3.13: Comparison of anticipated career (Q20) versus actual employment, by gender<br />
Figure 3.14 below shows the percentages which chose each option for motivation to undertake a<br />
research degree, for male and female students, broken down by place of residence for fees purposes<br />
(Q30) (e.g. 41.7% of Home male students were motivated by their interest in the subject).<br />
Figure 3.14: Main motivation by country of residence for fee status and gender, Q19<br />
41
<strong>PRES</strong> <strong>2011</strong> Results – September <strong>2011</strong><br />
Figure 3.14 shows that larger proportions of Home and Other EU male students than any other group<br />
were motivated by their interest in the subject, while Non EU students both male and female were far<br />
more motivated by improving their prospects for an academic/research career than Home or Other EU of<br />
either gender (over 40% of Non EU respondents chose this option compared to under 30% for all other<br />
categories).<br />
3.2.1.3 Age<br />
Younger and older students were most motivated by an interest in the subject, while those in the middle<br />
age ranges (especially aged 30-40) were most motivated by improving academic/research career<br />
prospects; although for a career outside higher education the likelihood of selecting this option decreased<br />
with age. This pattern (the middle groups being most motivated by an academic career and younger being<br />
more motivated than older for a career outside HE) is also borne out by the anticipated career item (see<br />
Figure 3.16 below). In particular, those aged below 30 anticipated a research career outside higher<br />
education to a greater extent than those over 30 (20.7% and 17.7% for 25 years old or younger and 26-30,<br />
with 11.9% for 31-35 decreasing as the age range increases).<br />
Figure 3.15: Main motivation by age, Q19<br />
42
<strong>PRES</strong> <strong>2011</strong> Results – September <strong>2011</strong><br />
Figure 3.16: Anticipated career by age, Q20<br />
3.2.2 Skills items<br />
Q2 of <strong>PRES</strong> contains six items about skills development. As noted in Section 2.2.2, respondents are<br />
relatively positive about these items and it is the second highest scoring scale in <strong>PRES</strong> (as it has been in<br />
previous years). It is also a predictor of overall experience, although the lowest of the five scales that are<br />
predictors (see multiple regression analysis in Section 2.1.3).<br />
As well as Q2, there are additional items in <strong>PRES</strong> that can be used to build up a picture of researchers’<br />
perceptions of their skills training. Items 9b and 9c ask about the importance that respondents attach to<br />
research and transferable skills respectively, while Q15b and Q15c ask about experience of research and<br />
transferable skills development relative to prior expectations. This section draws together these different<br />
items and provides demographic breakdowns by discipline, gender, age and source of funding.<br />
43
<strong>PRES</strong> <strong>2011</strong> Results – September <strong>2011</strong><br />
3.2.2.1 Discipline<br />
Figure 3.17 shows the scores for each item in the skills scale broken down by discipline.<br />
Figure 3.17: Skills Development items by % agree by discipline area, Q2<br />
As can be seen, respondents from Health and STEM disciplines were more positive about skills<br />
development than those in Social Sciences, Arts & Humanities, or Combined disciplines. The least<br />
positive discipline, for all items, was Combined. For all discipline areas, the least positive item was Q2f<br />
(‘there are adequate opportunities available for me to further develop my transferable skills’),<br />
although the proportion of respondents who agreed for that low-scoring item was still at least 5%<br />
higher for Health and STEM respondents than for Social Sciences, Arts & Humanities and Combined<br />
respondents. Those differences may reflect a greater emphasis on the vocational aspects of a research<br />
degree among Health and STEM students.<br />
Figure 3.18 below shows the greater positivity of Health and STEM respondents towards research and<br />
transferable skills training in relation to experience versus expectations, although the difference is less<br />
marked than for Q2. Comparison between responses to Q15b and Q15c reveals that while the general<br />
level of positivity for the two items, measured by expectations met or exceeded, is roughly similar, this<br />
masks a clear difference in the distribution: a greater proportion of respondents had their expectations<br />
met by the transferable skills development than for research skills development. This is most striking in<br />
the case of Arts & Humanities: for that discipline, while the general level of positivity is similar for<br />
Q15b and Q15c (87% and 85% respectively for expectations met or exceeded), this masks a difference<br />
in expectations met of 9.1% (with Q15c being higher) and expectations exceeded of 11.1% (with Q15b<br />
being higher); in contrast, the difference in expectations not met was only 1.8% (with Q15c being<br />
higher).<br />
44
<strong>PRES</strong> <strong>2011</strong> Results – September <strong>2011</strong><br />
Figure 3.18: Opportunities to develop a range of research and transferable skills by discipline, Q15b and<br />
Q15c<br />
It is interesting to disaggregate by discipline, and compare respondents’ positivity about skills training<br />
with their perceptions of the importance of that training (Figure 3.19). Arts & Humanities students were<br />
the least convinced about the importance of skills development (both research and transferable).<br />
Mirroring their greater positivity, respondents from both Health and STEM subjects yielded the largest<br />
proportions deeming research skills development to be important (Q9b). For perceptions of the<br />
importance of transferable skills development (Q9c) the results are somewhat different. There is a<br />
general perception across all disciplines that the development of transferable skills is less important than<br />
the development of research skills; the proportion deeming them important was 19.4% lower for<br />
transferable than for research skills. As with research skills, students in Health disciplines felt most<br />
strongly that transferable skills development was important. Again, this is perhaps unsurprising given a<br />
greater emphasis on vocational issues for Health students. However, STEM students did not display the<br />
greater sense of importance of transferable skills that they displayed for research skills; their results were<br />
very similar to those of Social Sciences and Combined.<br />
45
<strong>PRES</strong> <strong>2011</strong> Results – September <strong>2011</strong><br />
Figure 3.19: Importance of developing a range of research and transferable skills by discipline, Q9b and<br />
Q9c<br />
3.2.2.2 Gender<br />
When looking at the Skills Development scale by gender, for most items there is no significant difference.<br />
There are, however, a number of areas where the perceptions of men and women differ in notable ways.<br />
In response to Q2a, male respondents expressed greater confidence about managing a research project,<br />
with a % agree score 5.3% higher (72.0% for female versus 77.3% for male).<br />
Female respondents attached a greater sense of importance to the development of transferable skills<br />
(Q9c) with an importance score 10.1% higher (65.1% for male versus 75.2% for female) 29 . However, there<br />
was no significant gender difference in positivity about available opportunities to develop transferable<br />
skills (Q2f), or in expectations met or exceeded (Q15c). This suggests that, despite the apparently greater<br />
importance placed on transferable skills by women, by and large they are equally as positive as male<br />
respondents about the training on offer.<br />
29 This difference is fairly consistent within each of the discipline groups, suggesting that the gender difference for<br />
Q9c is not a direct feature of discipline differences combined with disproportionate numbers of men and women<br />
within disciplines, as was the case with Q19, see Section 3.2.1.2.<br />
46
<strong>PRES</strong> <strong>2011</strong> Results – September <strong>2011</strong><br />
3.2.2.3 Age<br />
Figure 3.20 below shows a breakdown of the percentages agreeing with the skills items by age group.<br />
Figure 3.20: Skills Development items by % agree by age, Q2<br />
In general, younger students were more likely to be positive about their skills development, except in<br />
response to Q2a (‘as a result of my experience so far I feel confident about managing a research<br />
project’), for which those 25 years old or younger were markedly less positive than other groups (the<br />
difference ranging from 3% to 7%).<br />
As Figure 3.21 below shows, the perceived importance of research skills training (Q9b) was roughly<br />
similar across all ages. However, there were clear age differences for transferable skills training (Q9c),<br />
with those in the middle age ranges feeling more strongly that such training is important. This is<br />
consistent with the motivation item (Q19, see Section 3.2.1.3), in which the middle age ranges were<br />
more motivated by improving academic/research career prospects (although no more motivated by<br />
improving non-academic/research career prospects).<br />
The relatively low results for the younger age groups for Q9c perhaps help to explain the positive<br />
responses from younger students to Q2f. As the wording of Q2f (‘there are adequate opportunities<br />
available for me to further develop my transferable skills’) most directly addresses frequency rather<br />
than perceived quality of the opportunities, perhaps those for whom the development of transferable<br />
skills is less important are more likely to be satisfied with a lower number of opportunities available to<br />
them.<br />
47
<strong>PRES</strong> <strong>2011</strong> Results – September <strong>2011</strong><br />
Figure 3.21: Importance of opportunities to develop a range of research and transferable skills by age, Q9b<br />
and Q9c<br />
3.2.2.4 Source of funding<br />
Figure 3.22 below shows % agree on the skills development scale broken down into those with<br />
<strong>Research</strong> Councils UK funding and those without 30 . While the differences here do not qualify for the<br />
5% cut-off for practical significance used elsewhere in Section 3, the findings have been included<br />
here because of the current interest in the impact of Roberts funding. Unlike students funded from<br />
most other sources, all RCUK-funded postgraduates have been required to undertake a certain<br />
amount of skills training 31 and so it is particularly interesting to see whether those students are<br />
more or less positive in response to the items about skills development. As anticipated, the % agree<br />
for RCUK-funded students is marginally higher for all of the items on the skills development scale<br />
except Q2a, which refers to running research projects. As might be expected given the emphasis on<br />
training provision for RCUK-funded students, the largest differences are for the items relating to the<br />
adequacy of opportunities, Q2e and Q2f.<br />
30 Comparisons for all funding types are not included as differences were statistically significant for only some of the<br />
items.<br />
31 See the RCUK Joint Skills Statement (2001). It has now been replaced by the <strong>Research</strong>er Development Framework ,<br />
see Vitae (2010).<br />
48
<strong>PRES</strong> <strong>2011</strong> Results – September <strong>2011</strong><br />
Figure 3.22: Skills Development by % agree by source of funding, Q2<br />
*Difference not statistically significant.<br />
In response to Q15b (experience versus expectations of research skills development) RCUK-funded<br />
students were less likely to say their expectations about research skills had been exceeded (3.9%<br />
difference); however, they were also less likely to say they were below expected (1.4%), and much more<br />
likely to say that their expectations had been met (5.3%). The pattern of higher levels of neutrality for<br />
RCUK-funded students is the same for the transferable skills item (Q15c).<br />
Figure 3.23: Opportunities to develop a range of research and transferable skills by source of funding,<br />
Q15b and Q15c<br />
49
<strong>PRES</strong> <strong>2011</strong> Results – September <strong>2011</strong><br />
Attitudes towards the importance of opportunities to develop research skills did not differ for RCUKfunded<br />
students and other students. However, there was a marked difference in their attitudes towards<br />
the importance of opportunities to develop transferable skills, with the proportion of RCUK-funded<br />
students feeling that it is important being over 10% lower than for other students.<br />
Figure 3.24: Importance of opportunities to develop a range of research and transferable skills by source<br />
of funding, Q9b and Q9c<br />
*Difference not statistically significant.<br />
3.2.3 Professional Development scale<br />
3.2.3.1 Discipline<br />
As with the skills items (see Section 3.2.2.1), Health students are more positive than those in other<br />
disciplines about professional development opportunities, although all areas scored low across this scale<br />
(it is the least positive of all the scales in <strong>PRES</strong> (see Section 2.1.1)). There were particularly marked<br />
disciplinary differences for Q7b and Q7c, with Health scoring 5-7% and 5-8% respectively more than other<br />
areas. Again, this is perhaps to be expected given the more vocational nature of Health disciplines,<br />
although it is interesting that there is no significant difference between the responses from STEM, Social<br />
Sciences and Arts & Humanities students given the varied nature of career options in those disciplines.<br />
50
<strong>PRES</strong> <strong>2011</strong> Results – September <strong>2011</strong><br />
Figure 3.25: Professional development items by % agree by discipline, Q7<br />
3.2.3.2 Gender<br />
As can be seen in Figure 3.26, women were generally less positive than men about professional and<br />
career development. Most notably, their % agree score for Q7a, regarding encouragement to think about<br />
the range of available career opportunities, was 5.2% lower than the equivalent score for men 32 .<br />
Figure 3.26: Professional development items by % agree by gender, Q7<br />
32 This gender difference was fairly consistent within discipline groups.<br />
51
<strong>PRES</strong> <strong>2011</strong> Results – September <strong>2011</strong><br />
3.2.3.3 Age<br />
As with the skills items (see Section 3.2.2.2) those in the middle age groups were more likely to agree with<br />
the professional development and career items than those under 30 or over 46. It could be hypothesised<br />
that given the higher importance that the middle age groups give to skills training, they are more<br />
proactive in seeking out advice and encouragement and thus more likely to be positive about the<br />
opportunities.<br />
Figure 3.27: Professional development items by % agree by age, Q7<br />
3.2.3.4 Source of funding<br />
Responses for the Professional Development and Career scale when split into RCUK-funded and non-<br />
RCUK-funded yield interesting results. There are clear differences in % agree between the two groups,<br />
with RCUK-funded students significantly less in agreement with all three items than those who were not<br />
RCUK-funded. Given the targeted provision aimed at RCUK-funded students, it is striking that the<br />
proportions of respondents agreeing that they were encouraged to reflect on their career and<br />
professional development was 4.4% (Q7a), 7.6% (Q7b) and 6.5% (Q7c) lower for the group funded by<br />
RCUK than for the group that was not. This runs counter to the natural expectation, and is somewhat in<br />
tension with the results for the skills development items, where RCUK-funded students were generally<br />
more positive.<br />
52
<strong>PRES</strong> <strong>2011</strong> Results – September <strong>2011</strong><br />
Figure 3.28: Professional development items by % agree by source of funding, Q7<br />
53
<strong>PRES</strong> <strong>2011</strong> Results – September <strong>2011</strong><br />
Conclusion<br />
As the Smith report noted in March 2010, the <strong>Postgraduate</strong> <strong>Research</strong> <strong>Experience</strong> <strong>Survey</strong> is the primary<br />
source of data on postgraduate researchers’ experiences in the UK 33 . This report has presented headline<br />
results from the <strong>2011</strong> survey, along with more detailed analysis in specific areas, in order to both provide<br />
an overall picture and to complement the institutional level data held by individual HEIs. These findings<br />
from <strong>PRES</strong> <strong>2011</strong> demonstrate that research students largely consider their experience to be a positive<br />
one: nearly nine out of ten (86%) of the students who took part in the <strong>2011</strong> survey rated their experience<br />
as having met or exceeded their expectations 34 .<br />
Perhaps more important than the simple level of positivity is the fact that <strong>PRES</strong> results are continuing to<br />
improve year-on-year. There are various possible explanations for this, most obviously an underlying<br />
improvement in the postgraduate research student experience as HEIs continue to develop facilities,<br />
policies and practices. It might also reflect rising awareness among research students in the value of<br />
providing feedback on their experiences 35 .<br />
This national report is a useful tool to help institutions to benchmark their own <strong>PRES</strong> results, and it is<br />
recommended that they use these top-level numbers, along with their own <strong>PRES</strong> data, as a starting point<br />
to explore the experiences of their own postgraduate researchers. Are they generally as positive as the<br />
national picture suggests about supervision? Are they as positive overall – and, even if they are, what of<br />
the 14% whose experiences were below their expectations? Are their motivations and career aspirations<br />
different, and what effect does that have on their perceptions of other aspects of their experience?<br />
Tailored internal surveys, focus groups, and general engagement with students and their representatives<br />
can all help to build a detailed picture of the experiences of postgraduate researchers within an<br />
institution, using these <strong>PRES</strong> results as a basis.<br />
The <strong>Higher</strong> Education Academy will continue to run <strong>PRES</strong> on an alternate-yearly basis – so it will run again<br />
in 2012-13. <strong>2011</strong>-12 will be an ‘enhancement year’, and the HEA will provide extensive support to<br />
institutions in analysing, interpreting and using their results to enhance their postgraduate research<br />
provision. Information about this activity will be available on the HEA’s website throughout the coming<br />
months: http://www.heacademy.ac.uk/postgraduate-enhancement.<br />
33 Smith et al. (2010), p. 37<br />
34 This is roughly in line with results from the National Student <strong>Survey</strong> (82% in 2010) and the <strong>Postgraduate</strong> Taught<br />
<strong>Experience</strong> <strong>Survey</strong> (88% in <strong>2011</strong>).<br />
35 The apparent improvement in the <strong>2011</strong> results may also in part be a product of introducing the ‘Not Applicable’<br />
option to a wider range of items, though analysis indicates that this is unlikely. See ‘Introduction’.<br />
54
<strong>PRES</strong> <strong>2011</strong> Results – September <strong>2011</strong><br />
References<br />
BIS (<strong>2011</strong>) The Government’s Response to the <strong>Postgraduate</strong> Review. London: Department for Business,<br />
Innovation and Skills. Available from: http://www.bis.gov.uk/assets/biscore/highereducation/docs/g/11-1049-government-response-to-postgraduate-review<br />
[24 August <strong>2011</strong>].<br />
Knapp, T.R. (1990) Treating ordinal scales as interval scales: an attempt to resolve the controversy.<br />
Nursing <strong>Research</strong>. 39 (2), 121-123.<br />
Marsh, H.W., Rose, K.J. and Martin, A. (2002) PhD Students Evaluations of <strong>Research</strong> Supervision: Issues,<br />
complexities, and challenges in a nationwide Australian experiment in benchmarking universities.<br />
The Journal of <strong>Higher</strong> Education. 73 (3), 313-348.<br />
Park, C. (2009) The <strong>Research</strong> Student <strong>Experience</strong>: Lessons from <strong>PRES</strong>. York: The <strong>Higher</strong> Education<br />
Academy. Available from:<br />
http://www.heacademy.ac.uk/assets/documents/postgraduate/<strong>PRES</strong>2009.pdf [30 August <strong>2011</strong>].<br />
RCUK (2001) Joint Statement of the Skills training requirements for research students. Swindon: <strong>Research</strong><br />
Councils UK. Available from:<br />
http://www.rcuk.ac.uk/documents/researchcareers/jsstrainingrequirements.pdf [26 August<br />
<strong>2011</strong>].<br />
RCUK (2010) RCUK statement of expectation regarding researcher development activities. Swindon:<br />
<strong>Research</strong> Councils UK. Available from:<br />
http://www.rcuk.ac.uk/documents/international/statementofexpectations.pdf [24 August <strong>2011</strong>].<br />
Roberts, G. (2002) SET for Success: The supply of people with science, technology, engineering, and<br />
mathematics skills. London: Department of Trade and Industry and Department for Education and<br />
Skills. Available from: http://webarchive.nationalarchives.gov.uk/+/http:/www.hmtreasury.gov.uk/set_for_success.htm<br />
[24 August <strong>2011</strong>].<br />
Smith, A., Bradshaw, T., Burnett, K., Docherty, D., Purcell, W. and Worthington, S. (2010) One Step<br />
Beyond: Making the most of postgraduate education. London: HMSO. Available from:<br />
http://www.bis.gov.uk/assets/BISCore/corporate/docs/P/10-704-one-step-beyond-postgraduateeducation.pdf<br />
[24 August <strong>2011</strong>].<br />
Statsoft (<strong>2011</strong>) Electronic Statistics Textbook. Tulsa, OK: Statsoft. Available from:<br />
http://www.statsoft.com/textbook/ [24 August <strong>2011</strong>].<br />
Surridge, P. (2009) The National Student <strong>Survey</strong> Three Years On: What have we learned. York: The <strong>Higher</strong><br />
Education Academy. Available from:<br />
http://www.heacademy.ac.uk/assets/documents/nss/NSS_three_years_on_surridge_02.06.09.pd<br />
f [24 August <strong>2011</strong>].<br />
Vitae (2009) What Do <strong>Research</strong>ers Do? London: Vitae. Available from: www.vitae.ac.uk/wdrd [24 August<br />
<strong>2011</strong>].<br />
55
<strong>PRES</strong> <strong>2011</strong> Results – September <strong>2011</strong><br />
Vitae (2010) <strong>Research</strong>er Development Framework. London: Vitae. Available from: www.vitae.ac.uk/rdf [26<br />
August <strong>2011</strong>].<br />
<strong>Higher</strong> Education Academy resources<br />
Copies of annual reports for <strong>PRES</strong> 2007, 2008, and 2009 are available for download from the HEA website:<br />
http://www.heacademy.ac.uk/pres. The website also contains other useful resources, and details of<br />
upcoming enhancement events.<br />
Glossary of acronyms<br />
BOS – Bristol Online <strong>Survey</strong>s<br />
HEA – <strong>Higher</strong> Education Academy<br />
HEI – higher education institution<br />
HESA – <strong>Higher</strong> Education Statistics Agency<br />
PGR – postgraduate researcher<br />
<strong>PRES</strong> – <strong>Postgraduate</strong> <strong>Research</strong> <strong>Experience</strong> <strong>Survey</strong><br />
PTES – <strong>Postgraduate</strong> Taught <strong>Experience</strong> <strong>Survey</strong><br />
RCUK – <strong>Research</strong> Councils UK<br />
56
<strong>PRES</strong> <strong>2011</strong> Results – September <strong>2011</strong><br />
Appendix A<br />
This appendix includes results for all non-demographic items in <strong>PRES</strong> <strong>2011</strong>, and a table containing yearon-year<br />
comparisons.<br />
1.a My supervisor/s have the skills and subject knowledge to<br />
adequately support my research<br />
1.b My supervisor/s make a real effort to understand any difficulties<br />
I face<br />
1.c I have been given good guidance in topic selection and<br />
refinement by my supervisor/s<br />
1.d I have received good guidance in my literature search from my<br />
supervisor/s<br />
Disagree Neutral Agree N<br />
5.4% 7.0% 87.5% 30923<br />
8.2% 11.3% 80.4% 30830<br />
9.3% 12.9% 77.8% 30569<br />
11.5% 18.0% 70.4% 30551<br />
1.e My supervisor/s provide helpful feedback on my progress 8.7% 12.8% 78.5% 30679<br />
1.f My supervisor/s are available when I need them 8.7% 12.1% 79.2% 30833<br />
2.a As a result of my experience so far I feel confident about<br />
managing a research project<br />
Disagree Neutral Agree N<br />
7.3% 18.2% 74.5% 30795<br />
2.b My experience so far has improved my analytical skills 5.1% 12.9% 82.0% 30724<br />
2.c My experience so far has helped me to develop a range of<br />
communication skills<br />
2.d As a result of my experience so far I have improved my ability to<br />
learn independently<br />
2.e There are adequate opportunities available for me to further<br />
develop my research skills<br />
2.f There are adequate opportunities available for me to further<br />
develop my transferable skills<br />
7.0% 19.5% 73.5% 30489<br />
4.6% 11.0% 84.4% 30563<br />
7.9% 17.0% 75.1% 30630<br />
8.0% 20.3% 71.6% 30206<br />
3.a I have adequate access to the equipment necessary for my<br />
research<br />
Disagree Neutral Agree N<br />
9.7% 15.4% 74.9% 29578<br />
3.b I have a suitable working space 14.1% 13.6% 72.4% 29373<br />
3.c There is appropriate financial support for research activities 22.9% 19.7% 57.4% 28890<br />
3.d There is adequate provision of computing resources and<br />
facilities<br />
12.0% 15.1% 72.9% 29779<br />
3.e There is adequate provision of library facilities 9.9% 13.7% 76.4% 30261<br />
3.f I have the technical support I need 10.3% 18.7% 71.0% 29404<br />
4.a My department provides opportunities for social contact with<br />
other research students<br />
4.b My department provides opportunities for me to become<br />
involved in the broader research culture<br />
4.c The research ambience in my department or faculty stimulates<br />
my work<br />
Disagree Neutral Agree N<br />
14.8% 20.0% 65.1% 30151<br />
15.3% 22.6% 62.1% 30162<br />
17.9% 23.9% 58.2% 29746<br />
4.d I feel integrated into my department's community 22.0% 23.9% 54.0% 29933<br />
14.4% 20.3% 65.2% 30013<br />
4.e My department provides a good seminar programme for<br />
research students<br />
57
<strong>PRES</strong> <strong>2011</strong> Results – September <strong>2011</strong><br />
Disagree Neutral Agree N<br />
5.a I understand the required standard for the thesis 8.2% 16.8% 75.0% 30736<br />
5.b I understand the standard of work expected 7.1% 14.4% 78.5% 30778<br />
5.c I understand the requirements of thesis examination 11.2% 21.5% 67.4% 30496<br />
5.d I understand the requirements and deadlines for formal<br />
monitoring of my progress<br />
8.6% 14.9% 76.5% 30685<br />
Disagree Neutral Agree N<br />
6.a.i The thesis examination process was fair 9.5% 6.5% 84.0% 1392<br />
6.a.ii The examination of my thesis was completed in a reasonable<br />
timescale<br />
6.a.iii I was given adequate support and guidance in preparation for<br />
my viva voce<br />
6.a.iv I was given adequate support and guidance to make any<br />
changes to my thesis following my viva voce<br />
Note: There were 1,401 students (4.6%) who ha d sat their final viva.<br />
7.a I am encouraged to think about the range of career opportunities<br />
that are available to me<br />
7.b I am encouraged to reflect on my professional development<br />
needs<br />
13.0% 8.8% 78.2% 1398<br />
16.1% 12.4% 71.4% 1378<br />
11.7% 10.9% 77.4% 1301<br />
Disagree Neutral Agree N<br />
25.5% 30.5% 43.9% 28113<br />
21.5% 28.4% 50.1% 29046<br />
7.c I am encouraged to reflect on my career development needs 23.3% 29.4% 47.2% 28660<br />
8.a I know who to approach, or where to find this out, if I am<br />
dissatisfied with any element of my research degree programme<br />
8.b My institution values and responds to feedback from research<br />
degree students<br />
Disagree Neutral Agree N<br />
14.9% 20.5% 64.6% 30677<br />
14.6% 28.2% 57.3% 29267<br />
8.c I understand my responsibilities as a research degree student 5.8% 14.1% 80.2% 30742<br />
13.1% 24.1% 62.8% 30625<br />
8.d I am aware of my institution's responsibilities towards me as a<br />
research degree student<br />
Not Neutral Import N<br />
important<br />
ant<br />
9.a Supervisory support and guidance 1.7% 2.3% 95.9% 31009<br />
9.b Opportunities to develop a range of research skills 2.4% 7.9% 89.6% 30958<br />
9.c Opportunities to develop a range of transferable skills 8.4% 21.4% 70.2% 30913<br />
9.d Access to appropriate facilities 2.8% 8.8% 88.4% 30928<br />
9.e The research environment 3.5% 12.5% 84.0% 30847<br />
4.9% 18.5% 76.7% 30852<br />
9.f Provision of guidance on institutional standards and<br />
expectations for your research degree programme<br />
10. I have had adequate opportunity to gain experience of teaching<br />
[e.g., lectures, seminars or workshops] whilst doing my research<br />
degree programme<br />
11. I have been given adequate support and guidance for my<br />
teaching<br />
58<br />
Disagree Neutral Agree N<br />
25.3% 17.0% 57.6% 23959<br />
23.9% 25.0% 51.1% 19786
<strong>PRES</strong> <strong>2011</strong> Results – September <strong>2011</strong><br />
12. I think the experience that I have gained through teaching has<br />
been a worthwhile aspect of my research degree programme<br />
13.9% 15.1% 71.0% 18619<br />
14.a My friends and family are supportive of my research degree<br />
programme<br />
Disagree Neutral Agree N<br />
3.7% 7.4% 88.9% 30528<br />
14.b My employer is supportive of my research degree programme 9.6% 13.1% 77.3% 14838<br />
34.1% 17.4% 48.4% 27093<br />
14.c The financing of my research degree programme places a<br />
strain on my personal finances<br />
Below my Met my<br />
Exceeded my N<br />
expectations expectations expectations<br />
15.a Supervisory support and guidance 16.8% 17.3% 65.8% 30966<br />
15.b Opportunities to develop a range of<br />
12.3% 28.0% 59.7% 30937<br />
research skills<br />
15.c Opportunities to develop a range of<br />
transferable skills<br />
12.9% 34.6% 52.6% 30898<br />
15.d Access to appropriate facilities 17.1% 31.9% 51.1% 30899<br />
15.e The research environment 19.6% 28.2% 52.2% 30669<br />
15.f Provision of guidance on institutional<br />
standards and expectations for your research<br />
degree programme<br />
15.g Overall experience of my research<br />
programme<br />
20.2% 40.2% 39.6% 30661<br />
13.8% 22.1% 64.1% 30814<br />
16. I am confident that I will complete my research degree<br />
programme more or less within the planned timescale<br />
Disagree Neutral Agree N<br />
10.1% 16.7% 73.3% 29665<br />
The following table shows score comparisons for all years of the survey. All scores are % agree except Q9<br />
(importance) and Q15 (met or exceeded expectations).<br />
Item a 2007 2008 2009 <strong>2011</strong> Change<br />
2007-<strong>2011</strong><br />
1a 82.2% 83.8% 84.4% 87.5% 5.3%<br />
1b 73.0% 75.1% 76.0% 80.4% 7.4%<br />
1c 68.4% 72.3% 73.0% 77.8% 9.4%<br />
1d 62.1% 64.0% 64.8% 70.4% 8.3%<br />
1e 70.8% 72.8% 73.7% 78.5% 7.7%<br />
1f 71.7% 74.0% 74.7% 79.2% 7.5%<br />
2a 66.5% 69.3% 70.6% 74.5% 8.0%<br />
2b 74.2% 78.0% 78.3% 82.0% 7.8%<br />
2c 63.8% 68.9% 69.3% 73.5% 9.7%<br />
2d 80.1% 80.5% 80.8% 84.4% 4.3%<br />
2e 60.8% 60.6% 69.8% 75.1% 14.3%<br />
2f 57.9% 58.0% 64.9% 71.6% 13.7%<br />
3a 67.8% 67.8% 69.4% 74.9% 7.1%<br />
3b 64.1% 64.8% 66.0% 72.4% 8.3%<br />
3c 44.6% 51.2% 51.8% 57.4% 12.8%<br />
3d 66.0% 65.7% 67.8% 72.9% 6.9%<br />
59
<strong>PRES</strong> <strong>2011</strong> Results – September <strong>2011</strong><br />
3e 66.3% 70.1% 71.1% 76.4% 10.1%<br />
3f 59.1% 61.8% 63.9% 71.0% 11.9%<br />
4a 53.4% 57.2% 59.1% 65.1% 11.7%<br />
4b 52.0% 55.2% 56.7% 62.1% 10.1%<br />
4c 49.3% 49.9% 52.6% 58.2% 8.9%<br />
4d 49.0% 46.4% 49.1% 54.0% 5.0%<br />
4e 57.2% 58.5% 59.9% 65.2% 8.0%<br />
5a 69.2% 69.4% 70.2% 75.0% 5.8%<br />
5b 75.8% 72.6% 73.6% 78.5% 2.7%<br />
5c 61.4% 60.7% 61.9% 67.4% 6.0%<br />
5d 73.9% 71.0% 71.6% 76.5% 2.6%<br />
6a(i) 82.2% 80.4% 77.9% 84.0% 1.8%<br />
6a(ii) 77.1% 75.2% 76.4% 78.2% 1.1%<br />
6a(iii) 61.8% 63.5% 61.6% 71.4% 9.6%<br />
6a(iv) 70.7% 73.8% 66.9% 77.4% 6.7%<br />
7a 37.6% 34.8% 37.1% 43.9% 6.3%<br />
7b 47.5% 44.3% 43.3% 50.1% 2.6%<br />
7c 38.3% 39.6% 39.9% 47.2% 8.9%<br />
8a 58.9% 54.2% 61.8% 64.6% 5.7%<br />
8b 47.8% 45.5% 51.3% 57.3% 9.5%<br />
8c 77.6% 76.9% 75.5% 80.2% 2.6%<br />
8d 47.3% 56.2% 59.2% 62.8% 15.5%<br />
9a 95.3% 95.7% 95.6% 95.9% 0.6%<br />
9b 88.1% 91.3% 89.2% 89.6% 1.5%<br />
9c 67.6% 74.3% 69.6% 70.2% 2.6%<br />
9d 89.1% 90.1% 88.1% 88.4% -0.7%<br />
9e 83.7% 87.3% 83.8% 84.0% 0.3%<br />
9f 74.2% 78.1% 76.3% 76.7% 2.5%<br />
10 b 47.5% 49.4% 57.6% 10.1%<br />
11 40.4% 42.7% 45.9% 51.1% 10.7%<br />
12 61.1% 62.0% 64.6% 71.0% 9.9%<br />
14a 87.5% 87.0% 88.6% 88.9% 1.4%<br />
14b 71.9% 74.0% 74.0% 77.3% 5.4%<br />
14c b 50.0% 50.4% 48.4% -1.6%<br />
15a 77.3% 79.0% 79.7% 83.1% 5.8%<br />
15b 83.6% 82.9% 85.9% 87.7% 4.1%<br />
15c 81.9% 82.4% 84.8% 87.2% 5.3%<br />
15d 78.2% 78.2% 80.5% 83.0% 4.8%<br />
15e 74.2% 75.4% 77.1% 80.4% 6.2%<br />
15f 73.1% 75.8% 77.1% 79.8% 6.7%<br />
15g 80.7% 82.5% 83.9% 86.2% 5.5%<br />
16 65.2% 67.0% 68.6% 73.3% 8.1%<br />
a The item number refer to the <strong>PRES</strong> <strong>2011</strong> questionnaire. In some cases the number of the item in<br />
previous years may be different.<br />
b This item was not introduced until <strong>PRES</strong> 2008. For this item, the number in the ‘Change 2007-<strong>2011</strong>’<br />
column is the change from 2008.<br />
60
<strong>PRES</strong> <strong>2011</strong> Results – September <strong>2011</strong><br />
APPENDIX B<br />
This appendix contains tables that supplement the detailed analysis in Section 3 of the report. Tables have<br />
been included where the charts in Section 3 do not include data labels.<br />
Table B1: Scales by disability type, by mean response<br />
Supervision*<br />
Skills<br />
development<br />
Infrastructure*<br />
Intellectual<br />
climate<br />
Goals &<br />
standards<br />
Professional<br />
development<br />
& career<br />
Social/communication<br />
impairment e.g.<br />
Asperger's<br />
4.01 3.78 3.78 3.54 3.84 3.18<br />
syndrome/other autistic<br />
spectrum disorder<br />
Blind/serious visual<br />
impairment<br />
4.17 3.86 3.72 3.44 3.89 3.03<br />
uncorrected by glasses<br />
Deaf/serious hearing<br />
impairment<br />
4.25 4.23 3.92 3.74 4.09 2.95<br />
Long-standing illness or<br />
health condition e.g.<br />
cancer, HIV, diabetes, 4.07 4.02 3.76 3.53 3.95 3.08<br />
chronic heart disease,<br />
or epilepsy<br />
Mental health<br />
condition, e.g.<br />
depression,<br />
3.96 3.78 3.75 3.37 3.73 2.94<br />
schizophrenia or anxiety<br />
disorder<br />
Specific learning<br />
difficulty e.g. dyslexia, 4.03 4.01 3.76 3.65 3.79 3.18<br />
dyspraxia, or AD(H)D<br />
Physical impairment or<br />
mobility issues, e.g.<br />
difficulty using your 4.19 4.09 3.65 3.51 4.00 3.19<br />
arms or using a<br />
wheelchair or crutches<br />
A disability, impairment<br />
or medical condition 3.98 3.83 3.59 3.38 3.78 3.01<br />
not listed above<br />
Two or more<br />
impairments and/or<br />
disabling mental<br />
3.96 3.89 3.45 3.37 3.68 2.67<br />
conditions<br />
Overall average 4.04 3.94 3.71 3.51 3.83 3.06<br />
* Differenc es for these scales are not statistically significant.<br />
61
<strong>PRES</strong> <strong>2011</strong> Results – September <strong>2011</strong><br />
Table B2: Scales by country group, by mean response<br />
UK<br />
Other<br />
EU<br />
Africa<br />
Asia<br />
Middle<br />
East<br />
North<br />
America<br />
Overall<br />
average<br />
Supervision 4.15 4.18 4.3 4.32 4.20 4.23 4.19<br />
Skills development 4.06 4.08 4.26 4.11 4.06 4.13 4.08<br />
Infrastructure 3.92 3.93 4.00 3.95 3.81 3.70 3.91<br />
Intellectual climate 3.65 3.67 3.69 3.76 3.54 3.60 3.66<br />
Goals and standards 3.91 4.01 4.10 4.05 3.91 3.94 3.95<br />
Thesis examination 4.10 4.23 4.29 4.33 3.85 3.78 4.13<br />
Professional development & career 3.22 3.34 3.65 3.58 3.36 3.31 3.31<br />
Table B3: Q15 by normal place of residence for fees purposes, by expectations met or exceeded<br />
Home Other EU Non EU<br />
N=<br />
c.18000* N=c.3700 N=c.8750<br />
15a) Supervisory support and guidance 82.1% 79.5% 87.0%<br />
15b) Opportunities to develop a range of research skills 88.1% 85.8% 87.6%<br />
15c) Opportunities to develop a range of transferable skills 87.6% 86.2% 86.7%<br />
15d) Access to appropriate facilities 82.7% 81.3% 84.0%<br />
15e) The research environment 79.7% 77.9% 82.8%<br />
15f) Provision of guidance on institutional standards and<br />
expectations for your research degree programme 77.7% 78.6% 84.7%<br />
15g) Overall experience of my research programme 85.5% 84.7% 88.4%<br />
* The N is approximate as there are small differences in the number of respondents for each item within<br />
the group. The same is true below whenever items are grouped within tables.<br />
Table B4: Q19 by discipline area<br />
Health<br />
STEM<br />
Social<br />
Sciences<br />
Arts and<br />
Humanities<br />
Combined<br />
N=3239 N=15212 N=5084 N=5556 N=731<br />
Overall<br />
My interest in the subject<br />
Improving my career prospects for<br />
an academic/research career<br />
Improving my career prospects<br />
outside of an academic/research<br />
career<br />
I was encouraged by a former<br />
academic tutor/supervisor<br />
28.2% 36.4% 34.8% 43.5% 40.8% 36.7%<br />
37.4% 27.7% 35.7% 30.2% 26.1% 30.6%<br />
11.5% 10.0% 7.7% 3.4% 5.3% 8.5%<br />
4.0% 4.9% 4.2% 4.4% 4.0% 4.6%<br />
62
<strong>PRES</strong> <strong>2011</strong> Results – September <strong>2011</strong><br />
The funding was available<br />
It felt like a natural step for me<br />
I felt inspired to work with a<br />
particular academic<br />
Other<br />
2.1% 3.2% 3.4% 2.8% 4.0% 3.1%<br />
12.8% 13.8% 10.4% 11.8% 13.5% 12.8%<br />
1.3% 1.5% 1.2% 1.3% 1.0% 1.4%<br />
2.6% 2.4% 2.7% 2.6% 5.3% 2.6%<br />
Table B5: Q20 by discipline area<br />
Academic career in higher<br />
education (research and<br />
teaching/teaching only)<br />
<strong>Research</strong> career in higher<br />
education<br />
<strong>Research</strong> career outside higher<br />
education<br />
Teaching (at a level below higher<br />
education)<br />
Any other professional career<br />
Self-employment (including<br />
setting up own business)<br />
Returning to or remaining with<br />
employer who is sponsoring your<br />
degree<br />
Other<br />
Health<br />
N=3226<br />
STEM<br />
N=<br />
15139<br />
Social<br />
Sciences<br />
Arts and<br />
Humanities<br />
Combined<br />
N=5065 N=5505 N=724<br />
Overall<br />
37.1% 36.4% 55.6% 59.6% 45.0% 44.3%<br />
16.4% 16.8% 8.2% 7.2% 12.7% 13.4%<br />
12.5% 20.3% 10.9% 4.5% 12.7% 14.8%<br />
0.3% 1.1% 0.8% 2.5% 1.1% 1.2%<br />
13.7% 12.5% 8.9% 6.3% 8.3% 10.8%<br />
2.0% 3.4% 4.3% 3.7% 4.4% 3.5%<br />
7.7% 3.6% 4.3% 3.9% 3.3% 4.2%<br />
10.2% 5.9% 6.9% 12.2% 12.4% 7.9%<br />
Table B6: Q19 by normal place of residence for fees purposes, and gender<br />
Home Other EU Non EU<br />
Male Female Male Female Male Female<br />
63<br />
Overall<br />
N=8479 N=9371 N=1766 N=1945 N=4917 N=3870<br />
My interest in the subject 41.7% 35.8% 38.9% 34.6% 34.2% 31.7% 36.8%<br />
Improving my career prospects<br />
for an academic/research career<br />
23.6% 27.9% 24.6% 30.0% 41.0% 41.9% 30.5%<br />
Improving my career prospects<br />
outside of an academic/research 9.1% 8.5% 9.2% 7.3% 8.2% 6.7% 8.4%<br />
career<br />
I was encouraged by a former<br />
academic tutor/supervisor<br />
4.7% 6.4% 3.3% 4.2% 2.5% 3.0% 4.5%<br />
The funding was available 2.9% 3.0% 2.7% 2.2% 3.2% 3.6% 3.0%<br />
It felt like a natural step for me 14.1% 13.7% 16.5% 17.9% 7.8% 9.7% 12.8%
I felt inspired to work with a<br />
particular academic<br />
<strong>PRES</strong> <strong>2011</strong> Results – September <strong>2011</strong><br />
1.3% 1.3% 1.8% 1.6% 1.4% 1.7% 1.4%<br />
Other 2.6% 3.4% 3.0% 2.2% 1.7% 1.8% 2.6%<br />
Table B7: Q19 by age<br />
25<br />
years<br />
old or<br />
younger<br />
26-30<br />
years<br />
old<br />
31-35<br />
years<br />
old<br />
36-40<br />
years<br />
old<br />
41-45<br />
years<br />
old<br />
46-50<br />
years<br />
old<br />
51-55<br />
years<br />
old<br />
56<br />
years<br />
old or<br />
older<br />
Overall<br />
N=<br />
8233<br />
N=<br />
10068<br />
N=<br />
4793<br />
N=<br />
2656<br />
N=<br />
1883<br />
N=<br />
1337<br />
N=<br />
888<br />
N=974<br />
My interest in the<br />
subject<br />
39.3% 35.5% 31.5% 31.3% 34.7% 36.4% 46.8% 67.1% 36.9%<br />
Improving my career<br />
prospects for an<br />
academic/research<br />
21.6% 31.3% 41.1% 41.8% 37.7% 31.6% 23.3% 6.1% 30.5%<br />
career<br />
Improving my career<br />
prospects outside of<br />
an<br />
9.5% 8.7% 8.6% 8.2% 7.6% 7.6% 4.3% 2.2% 8.4%<br />
academic/research<br />
career<br />
I was encouraged by<br />
a former academic 6.0% 4.5% 3.2% 3.2% 3.5% 4.0% 3.5% 5.9% 4.5%<br />
tutor/supervisor<br />
The funding was<br />
available<br />
3.4% 3.7% 3.2% 2.0% 1.9% 1.3% 2.0% 1.0% 3.1%<br />
It felt like a natural<br />
step for me<br />
17.1% 12.6% 8.3% 9.5% 10.2% 12.9% 13.3% 10.6% 12.7%<br />
I felt inspired to<br />
work with a<br />
1.3% 1.3% 1.3% 1.2% 1.4% 1.9% 1.2% 2.2% 1.4%<br />
particular academic<br />
Other 1.7% 2.3% 2.9% 2.9% 2.9% 4.2% 5.5% 5.0% 2.6%<br />
Table B8: Q20 by age<br />
25<br />
years<br />
old or<br />
younger<br />
26-30<br />
years<br />
old<br />
31-35<br />
years<br />
old<br />
36-40<br />
years<br />
old<br />
41-45<br />
years<br />
old<br />
46-50<br />
years<br />
old<br />
51-55<br />
years<br />
old<br />
56<br />
years<br />
old or<br />
older<br />
Overall<br />
N=<br />
8176<br />
N=<br />
10039<br />
N=<br />
4772<br />
N=<br />
2646<br />
N=<br />
1871<br />
N=<br />
1329<br />
N=878 N=928<br />
Academic career in<br />
HE (research and<br />
teaching/teaching<br />
only)<br />
38.4% 45.2% 50.3% 52.1% 50.9% 46.9% 40.9% 20.0% 44.3%<br />
64
<strong>PRES</strong> <strong>2011</strong> Results – September <strong>2011</strong><br />
<strong>Research</strong> career in<br />
HE<br />
<strong>Research</strong> career<br />
outside HE<br />
Teaching (at a level<br />
below HE)<br />
Any other<br />
professional career<br />
Self-employment<br />
(including setting up<br />
own business)<br />
Returning to or<br />
remaining with<br />
employer sponsoring<br />
your degree<br />
Other<br />
14.8% 14.9% 13.0% 11.2% 9.9% 9.7% 9.8% 7.0% 13.4%<br />
20.7% 17.2% 11.6% 9.4% 6.7% 6.7% 4.9% 4.2% 14.8%<br />
1.4% 0.9% 1.0% 1.2% 1.8% 1.3% 1.5% 1.9% 1.2%<br />
14.2% 11.1% 9.6% 7.7% 7.9% 7.4% 8.2% 3.7% 10.7%<br />
2.7% 3.1% 2.7% 3.0% 5.0% 5.0% 7.2% 12.1% 3.5%<br />
1.3% 2.1% 5.4% 9.2% 9.2% 12.9% 10.0% 4.7% 4.2%<br />
6.5% 5.4% 6.3% 6.2% 8.7% 10.1% 17.5% 46.3% 7.9%<br />
Table B9: Q2 by discipline area, by % agree<br />
Health<br />
STEM<br />
Social<br />
Sciences<br />
Arts and<br />
Humanities<br />
Combined<br />
N=c.3200 N=c.15100 N=c.5000 N=c.5400 N=c.700<br />
Overall<br />
2a) As a result of my<br />
experience so far I feel<br />
confident about managing<br />
a research project<br />
2b) My experience so far<br />
has improved my analytical<br />
skills<br />
2c) My experience so far<br />
has helped me to develop a<br />
range of communication<br />
skills<br />
2d) As a result of my<br />
experience so far I have<br />
improved my ability to<br />
learn independently<br />
2e) There are adequate<br />
opportunities available for<br />
me to further develop my<br />
research skills<br />
2f) There are adequate<br />
opportunities available for<br />
me to further develop my<br />
transferable skills<br />
76.0% 72.4% 76.3% 77.4% 73.4% 74.5%<br />
83.4% 82.7% 81.1% 81.4% 76.9% 82.1%<br />
75.4% 75.5% 70.2% 70.5% 69.6% 73.5%<br />
84.7% 85.6% 83.2% 82.6% 80.8% 84.4%<br />
77.8% 77.3% 71.0% 72.8% 68.6% 75.2%<br />
75.2% 74.9% 66.9% 66.1% 65.1% 71.7%<br />
65
<strong>PRES</strong> <strong>2011</strong> Results – September <strong>2011</strong><br />
Table B10: Q15b by discipline group<br />
15b)<br />
Opportunities to<br />
develop a range<br />
of research skills<br />
Health<br />
STEM<br />
Social<br />
Sciences<br />
Art and<br />
Humanities<br />
Combined<br />
N=3223 N=15191 N=5075 N=5548 N=729<br />
Overall<br />
Below my<br />
expectations<br />
Met my<br />
expectations<br />
Above my<br />
expectations<br />
9.9% 11.1% 16.3% 13.1% 14.7% 12.3%<br />
25.1% 28.2% 24.9% 31.2% 33.6% 28.0%<br />
65.1% 60.7% 58.9% 55.8% 51.8% 59.7%<br />
Table B11: Q15c by discipline group<br />
15c)<br />
Opportunities to<br />
develop a range<br />
of transferable<br />
skills<br />
Below my<br />
expectations<br />
Met my<br />
expectations<br />
Above my<br />
expectations<br />
Health<br />
STEM<br />
Social<br />
Sciences<br />
Art and<br />
Humanities<br />
Combined<br />
N=3226 N=15182 N=5062 N=5528 N=729<br />
Overall<br />
9.7% 11.6% 16.1% 14.9% 14.2% 12.9%<br />
31.6% 33.5% 32.9% 40.3% 39.8% 34.6%<br />
58.5% 54.9% 51.0% 44.7% 45.9% 52.6%<br />
Table B12: Q9b and Q9c by discipline group, by importance<br />
Health<br />
STEM<br />
Social<br />
Sciences<br />
Art and<br />
Humanities<br />
Combined<br />
Overall<br />
N=<br />
c.3200<br />
N=<br />
c.15200<br />
N=c.5050 N=c.5550 N=c.750<br />
9b) Opportunities to<br />
develop a range of<br />
research skills<br />
9c) Opportunities to<br />
develop a range of<br />
transferable skills<br />
93.1% 90.5% 88.6% 86.7% 87.4% 89.6%<br />
78.2% 70.4% 70.6% 64.2% 70.1% 70.2%<br />
66
<strong>PRES</strong> <strong>2011</strong> Results – September <strong>2011</strong><br />
Table B13: Q2 by age, by % agree<br />
2a) As a result of<br />
my experience so<br />
far I feel<br />
confident about<br />
managing a<br />
research project<br />
2b) My<br />
experience so far<br />
has improved my<br />
analytical skills<br />
2c) My<br />
experience so far<br />
has helped me to<br />
develop a range<br />
of<br />
communication<br />
skills<br />
2d) As a result of<br />
my experience so<br />
far I have<br />
improved my<br />
ability to learn<br />
independently<br />
2e) There are<br />
adequate<br />
opportunities<br />
available for me<br />
to further<br />
develop my<br />
research skills<br />
2f) There are<br />
adequate<br />
opportunities<br />
available for me<br />
to further<br />
develop my<br />
transferable skills<br />
25 years<br />
old or<br />
younger<br />
N=<br />
c.8150<br />
26-30<br />
years<br />
old<br />
N=<br />
c.10000<br />
31-35<br />
years<br />
old<br />
N=<br />
c.4700<br />
36-40<br />
years<br />
old<br />
N=<br />
c.2600<br />
41-45<br />
years<br />
old<br />
N=<br />
c.1850<br />
46-50<br />
years<br />
old<br />
N=<br />
c.1300<br />
51-55<br />
years old<br />
N=c.850<br />
56 years<br />
old or<br />
older<br />
N=c.900<br />
Overall<br />
70.1% 74.8% 76.5% 77.7% 77.6% 78.4% 78.2% 77.8% 74.5%<br />
81.3% 83.1% 81.9% 81.2% 81.5% 82.9% 82.9% 79.2% 82.0%<br />
75.2% 75.4% 73.2% 70.1% 70.3% 71.8% 68.5% 64.2% 73.5%<br />
85.4% 86.1% 84.4% 83.3% 82.1% 79.0% 79.7% 77.7% 84.4%<br />
80.5% 74.1% 73.1% 72.5% 72.7% 72.9% 70.7% 70.8% 75.1%<br />
76.9% 71.2% 69.8% 68.5% 68.9% 69.0% 64.4% 65.0% 71.6%<br />
67
<strong>PRES</strong> <strong>2011</strong> Results – September <strong>2011</strong><br />
Table B14: Q9b and Q9c by age, by importance<br />
25 years<br />
old or<br />
younger<br />
N=<br />
c.8200<br />
26-30<br />
years<br />
old<br />
N=<br />
c.1005<br />
0<br />
31-35<br />
years<br />
old<br />
N=<br />
c.4800<br />
36-40<br />
years<br />
old<br />
N=<br />
c.2650<br />
41-45<br />
years<br />
old<br />
N=<br />
c.1850<br />
46-50<br />
years<br />
old<br />
N=<br />
c.1350<br />
51-55<br />
years old<br />
N=c.900<br />
56 years<br />
old or<br />
older<br />
N=c.950<br />
Overall<br />
9b) Opportunities<br />
to develop a<br />
range of research<br />
skills<br />
9c) Opportunities<br />
to develop a<br />
range of<br />
transferable skills<br />
90.2% 89.7% 90.4% 89.8% 89.9% 88.3% 88.8% 83.7% 89.6%<br />
67.5% 70.7% 74.6% 74.0% 73.2% 70.0% 64.8% 54.5% 70.2%<br />
Table B15: Q7 by discipline group, by % agree<br />
7a) I am encouraged to think<br />
about the range of career<br />
opportunities available to<br />
me<br />
7b) I am encouraged to<br />
reflect on my professional<br />
development needs<br />
7c) I am encouraged to<br />
reflect on my career<br />
development needs<br />
Health<br />
N=c.2900<br />
STEM<br />
N=<br />
c.14500<br />
Social<br />
Sciences<br />
N=<br />
c.4600<br />
Art and<br />
Humanities<br />
Combined<br />
N=c.4800 N=650<br />
Overall<br />
47.4% 45.1% 43.1% 39.7% 38.3% 43.9%<br />
55.7% 49.8% 50.2% 48.2% 45.6% 50.1%<br />
52.4% 47.4% 47.5% 44.2% 41.4% 47.2%<br />
68
<strong>PRES</strong> <strong>2011</strong> Results – September <strong>2011</strong><br />
Table B16: Q7 by age, by % agree<br />
25<br />
years<br />
old or<br />
younge<br />
r<br />
26-30<br />
years old<br />
31-35<br />
years<br />
old<br />
36-40<br />
years<br />
old<br />
41-45<br />
years<br />
old<br />
46-50<br />
years<br />
old<br />
51-55<br />
years<br />
old<br />
56<br />
years<br />
old or<br />
older<br />
Overall<br />
N=<br />
c.8050<br />
N=<br />
c.9700<br />
N=<br />
c.4450<br />
N=<br />
c.2400<br />
N=<br />
c.1600<br />
N=<br />
c.1100<br />
N=<br />
c.650<br />
N=<br />
c.450<br />
7a) I am encouraged<br />
to think about the<br />
range of career<br />
opportunities that<br />
are available to me<br />
7b) I am encouraged<br />
to reflect on my<br />
professional<br />
development needs<br />
7c) I am encouraged<br />
to reflect on my<br />
career development<br />
needs<br />
42.2% 45.9% 45.8% 45.1% 41.6% 39.9% 34.6% 37.4% 43.9%<br />
47.4% 50.4% 52.4% 52.5% 51.6% 51.1% 49.2% 50.1% 50.1%<br />
44.4% 48.6% 50.4% 49.8% 46.3% 45.1% 42.0% 39.7% 47.2%<br />
69
<strong>PRES</strong> <strong>2011</strong> Results – September <strong>2011</strong><br />
APPENDIX C<br />
<strong>Postgraduate</strong> <strong>Research</strong> <strong>Experience</strong> <strong>Survey</strong> – <strong>PRES</strong> <strong>2011</strong><br />
Welcome<br />
The <strong>Postgraduate</strong> <strong>Research</strong> <strong>Experience</strong> <strong>Survey</strong> (<strong>PRES</strong>) is run by the <strong>Higher</strong> Education Academy together with<br />
your institution, to ask about your experiences of your research degree programme. <strong>Survey</strong>s of this nature<br />
provide universities with information that they can use to improve the experience of postgraduate research<br />
students. The overall aim of the survey is to identify, at both a local and national level, areas where<br />
improvements could be made and efforts targeted to further enhance research degree programmes.<br />
This is the fourth nationwide administration of <strong>PRES</strong>, which ran for three successive years between 2007 and<br />
2009. You can download a report that summarises the results for these three years from<br />
http://www.heacademy.ac.uk/ourwork/supportingresearch/postgraduate/pres. This fourth administration of<br />
<strong>PRES</strong> is likely to include more than 90 participating institutions.<br />
The survey is divided into several short sections:<br />
The first eight sections ask about your experience of your research degree programme including supervision,<br />
infrastructure, professional development and career. Section nine asks you to make an overall evaluation of<br />
your experience on five broader aspects of your research degree programme. The tenth section asks you<br />
about your experience of any teaching opportunities you may have had, and the eleventh section asks about<br />
personal factors that may impact upon your experience of your research degree programme, such as support<br />
from friends and family. Section twelve asks about how well your expectations of the research programme<br />
were met, followed by a space for any additional comments. A demographic section is included at the end,<br />
which enables us to check the representativeness of the sample and to compare between different<br />
demographic groups in our analyses. It is important that you complete all sections of the survey for your views<br />
to be included. The data will not be used to identify any individuals.<br />
The survey is on five pages and it is not possible to return to a page once it has been completed. Therefore,<br />
please think carefully before responding so that your views are accurately represented. When you arrive at the<br />
final ‘thank you’ page, you will know that your responses have been recorded on our database.<br />
Once you click 'continue' you will be directed to the first section of the survey.<br />
Yours sincerely,<br />
Dr Pam Wells [Adviser, Evidence-Informed Practice]<br />
Professor Chris Park [Chair of the <strong>PRES</strong> Advisory Group]<br />
70
<strong>PRES</strong> <strong>2011</strong> Results – September <strong>2011</strong><br />
Data Protection<br />
All data collected in this survey will be held securely.<br />
Individual results are confidential to your institution.<br />
All participating institutions have agreed not to identify any individuals when reporting their re sults, and to<br />
use their best efforts to ensure that no individuals can be identified by implication.<br />
Aggregated institutional results will feed into an anonymised national aggregate which will be available to all<br />
institutions taking part in <strong>PRES</strong> for benchmarking purposes only. Some institutions may also wish to share their<br />
results to create smaller anonymised aggregates – benchmarking clubs – with similar institutions (e.g. Russell<br />
Group, Post-92).<br />
The full <strong>PRES</strong> dataset will be available to the <strong>Higher</strong> Education Academy in order to conduct national level<br />
analysis, and all results will be reported in an aggregated and anonymised form.<br />
71
<strong>PRES</strong> <strong>2011</strong> Results – September <strong>2011</strong><br />
SECTION 1: SUPERVISION<br />
1. For each statement, please rate the extent of your agreement or disagreement. (1 = Strongly Disagree<br />
and 5 = Strongly Agree)<br />
1 2 3 4 5 NA<br />
a. My supervisor/s have the skills and<br />
subject knowledge to adequately<br />
support my research<br />
b. My supervisor/s make a real effort<br />
to understand any difficulties I face<br />
c. I have been given good guidance in<br />
topic selection and refinement by my<br />
supervisor/s<br />
d. I have received good guidance in<br />
my literature search from my<br />
supervisor/s<br />
e. My supervisor/s provide helpful<br />
feedback on my progress<br />
f. My supervisor/s are available when<br />
I need them<br />
◦ ◦ ◦ ◦ ◦ ◦<br />
◦ ◦ ◦ ◦ ◦ ◦<br />
◦ ◦ ◦ ◦ ◦ ◦<br />
◦ ◦ ◦ ◦ ◦ ◦<br />
◦ ◦ ◦ ◦ ◦ ◦<br />
◦ ◦ ◦ ◦ ◦ ◦<br />
SECTION 2: SKILLS DEVELOPMENT<br />
2. For each statement, please rate the extent of your agreement or disagreement. (1 = Strongly Disagree<br />
and 5 = Strongly Agree)<br />
1 2 3 4 5 NA<br />
a. As a result of my experience so far<br />
I feel confident about managing a<br />
research project<br />
b. My experience so far has<br />
improved my analytical skills<br />
c. My experience so far has helped<br />
me to develop a range of<br />
communication skills<br />
d. As a result of my experience so far<br />
I have improved my ability to learn<br />
independently<br />
e. There are adequate opportunities<br />
available for me to further develop<br />
my research skills<br />
f. There are adequate opportunities<br />
available for me to further develop<br />
my transferable skills<br />
◦ ◦ ◦ ◦ ◦ ◦<br />
◦ ◦ ◦ ◦ ◦ ◦<br />
◦ ◦ ◦ ◦ ◦ ◦<br />
◦ ◦ ◦ ◦ ◦ ◦<br />
◦ ◦ ◦ ◦ ◦ ◦<br />
◦ ◦ ◦ ◦ ◦ ◦<br />
72
<strong>PRES</strong> <strong>2011</strong> Results – September <strong>2011</strong><br />
SECTION 3: INFRASTRUCTURE<br />
3. For each statement, please rate the extent of your agreement or disagreement. (1 = Strongly Disagree<br />
and 5 = Strongly Agree)<br />
1 2 3 4 5 NA<br />
a. I have adequate access to the<br />
equipment necessary for my<br />
◦ ◦ ◦ ◦ ◦ ◦<br />
research<br />
b. I have a suitable working space ◦ ◦ ◦ ◦ ◦ ◦<br />
c. There is appropriate financial ◦ ◦ ◦ ◦ ◦ ◦<br />
support for research activities<br />
d. There is adequate provision of ◦ ◦ ◦ ◦ ◦ ◦<br />
computing resources and facilities<br />
e. There is adequate provision of ◦ ◦ ◦ ◦ ◦ ◦<br />
library facilities<br />
f. I have the technical support I need ◦ ◦ ◦ ◦ ◦ ◦<br />
SECTION 4: INTELLECTUAL CLIMATE<br />
4. For each statement, please rate the extent of your agreement or disagreement. (1 = Strongly Disagree<br />
and 5 = Strongly Agree)<br />
1 2 3 4 5 NA<br />
a. My department provides<br />
opportunities for social contact with<br />
other research students<br />
b. My department provides<br />
opportunities for me to become<br />
involved in the broader research<br />
culture<br />
c. The research ambience in my<br />
department or faculty stimulates my<br />
work<br />
d. I feel integrated into my<br />
department's community<br />
e. My department provides a good<br />
seminar programme for research<br />
students<br />
◦ ◦ ◦ ◦ ◦ ◦<br />
◦ ◦ ◦ ◦ ◦ ◦<br />
◦ ◦ ◦ ◦ ◦ ◦<br />
◦ ◦ ◦ ◦ ◦ ◦<br />
◦ ◦ ◦ ◦ ◦ ◦<br />
73
<strong>PRES</strong> <strong>2011</strong> Results – September <strong>2011</strong><br />
SECTION 5: GOALS AND STANDARDS<br />
5. For each statement, please rate the extent of your agreement or disagreement. (1 = Strongly Disagree<br />
and 5 = Strongly Agree)<br />
1 2 3 4 5 NA<br />
a. I understand the required<br />
standard for the thesis<br />
b. I understand the standard of work<br />
expected<br />
c. I understand the requirements of<br />
thesis examination<br />
d. I understand the requirements and<br />
deadlines for formal monitoring of<br />
my progress<br />
◦ ◦ ◦ ◦ ◦ ◦<br />
◦ ◦ ◦ ◦ ◦ ◦<br />
◦ ◦ ◦ ◦ ◦ ◦<br />
SECTION 6: THESIS EXAMINATION<br />
6. Have you sat your final viva examination?<br />
No (If No, please go to section 7)<br />
Yes (If Yes, please respond to the following statements:)<br />
For each of the following, show the extent of your agreement or disagreement. (1 = Strongly Disagree<br />
and 5 = Strongly Agree)<br />
1 2 3 4 5 NA<br />
The thesis examination process was<br />
fair<br />
The examination of my thesis was<br />
completed in a reasonable time scale<br />
I was given adequate support and<br />
guidance in preparation for my viva<br />
voce<br />
I was given adequate support and<br />
guidance to make any changes to my<br />
thesis following my viva voce<br />
◦ ◦ ◦ ◦ ◦ ◦<br />
◦ ◦ ◦ ◦ ◦ ◦<br />
◦ ◦ ◦ ◦ ◦ ◦<br />
◦ ◦ ◦ ◦ ◦ ◦<br />
74
<strong>PRES</strong> <strong>2011</strong> Results – September <strong>2011</strong><br />
SECTION 7: PROFESSIONAL DEVELOPMENT AND CAREER<br />
7. For each statement, please rate the extent of your agreement or disagreement. (1 = Strongly Disagree<br />
and 5 = Strongly Agree)<br />
1 2 3 4 5 NA<br />
a. I am encouraged to think about<br />
the range of career opportunities<br />
that are available to me.<br />
b. I am encouraged to reflect on my<br />
professional development needs<br />
c. I am encouraged to reflect on my<br />
career development needs<br />
◦ ◦ ◦ ◦ ◦ ◦<br />
◦ ◦ ◦ ◦ ◦ ◦<br />
◦ ◦ ◦ ◦ ◦ ◦<br />
SECTION 8: ROLES AND RESPONSIBILITIES<br />
8. For each statement, please rate the extent of your agreement or disagreement. (1 = Strongly Disagree<br />
and 5 = Strongly Agree)<br />
1 2 3 4 5 NA<br />
a. I know who to approach, or where<br />
to find this out, if I am dissatisfied<br />
with any element of my research<br />
degree programme<br />
b. My institution values and responds<br />
to feedback from research degree<br />
students<br />
c. I understand my responsibilities as<br />
a research degree student<br />
d. I am aware of my institution's<br />
responsibilities towards me as a<br />
research degree student<br />
◦ ◦ ◦ ◦ ◦ ◦<br />
◦ ◦ ◦ ◦ ◦ ◦<br />
◦ ◦ ◦ ◦ ◦ ◦<br />
◦ ◦ ◦ ◦ ◦ ◦<br />
75
<strong>PRES</strong> <strong>2011</strong> Results – September <strong>2011</strong><br />
SECTION 9<br />
9. For the following items, please rate how important, in terms of successfully completing your research<br />
degree programme, you consider them to be (1 = Not at all important and 5 = Very important)<br />
Importance<br />
1 2 3 4 5 Comment<br />
a. Supervisory support and ◦ ◦ ◦ ◦ ◦ .................................................<br />
guidance<br />
b. Opportunities to develop a ◦ ◦ ◦ ◦ ◦ .................................................<br />
range of research skills<br />
c. Opportunities to develop a ◦ ◦ ◦ ◦ ◦ .................................................<br />
range of transferable skills<br />
d. Access to appropriate ◦ ◦ ◦ ◦ ◦ .................................................<br />
facilities<br />
e. The research environment ◦ ◦ ◦ ◦ ◦ .................................................<br />
f. Provision of guidance on<br />
institutional standards and<br />
expectations for your<br />
research degree programme<br />
◦ ◦ ◦ ◦ ◦ .................................................<br />
76
<strong>PRES</strong> <strong>2011</strong> Results – September <strong>2011</strong><br />
SECTION 10: TEACHING OPPORTUNITIES<br />
10. I have had adequate opportunity to gain experience of teaching [e.g., lectures, seminars or workshops]<br />
whilst doing my research degree programme (1 = Strongly Disagree and 5 = Strongly Agree)<br />
◦ 1 ◦ 2 ◦ 3 ◦ 4 ◦ 5 ◦ NA<br />
11. I have been given adequate support and guidance for my teaching (1 = Strongly Disagree and 5 =<br />
Strongly Agree)<br />
◦ 1 ◦ 2 ◦ 3 ◦ 4 ◦ 5 ◦ NA<br />
12. I think the experience that I have gained through teaching has been a worthwhile aspect of my<br />
research degree programme (1 = Strongly Disagree and 5 = Strongly Agree)<br />
◦ 1 ◦ 2 ◦ 3 ◦ 4 ◦ 5 ◦ NA<br />
13. Please provide further information regarding your teaching experience<br />
……………………………………………………………………………………………………………...........<br />
……………………………………………………………………………………………………………...........<br />
……………………………………………………………………………………………………………...........<br />
77
<strong>PRES</strong> <strong>2011</strong> Results – September <strong>2011</strong><br />
SECTION 11: PERSONAL FACTORS<br />
14. Please state to what extent you agree with the following statements (1 = Strongly Disagree and 5 =<br />
Strongly Agree)<br />
1 2 3 4 5 NA<br />
a. My friends and family are<br />
supportive of my research degree<br />
programme<br />
b. My employer is supportive of my<br />
research degree programme<br />
c. The financing of my research<br />
degree programme places a strain on<br />
my personal finances.<br />
◦ ◦ ◦ ◦ ◦ ◦<br />
◦ ◦ ◦ ◦ ◦ ◦<br />
◦ ◦ ◦ ◦ ◦ ◦<br />
78
<strong>PRES</strong> <strong>2011</strong> Results – September <strong>2011</strong><br />
SECTION 12<br />
15. Please rate the following broad aspects of your research degree programme in terms of how your<br />
experience of them has met with your expectations (-3 = it is much more negative, 0 = it has met my<br />
expectations, +3 = it is much more positive)<br />
-3 -2 -1 0 1 2 3<br />
a. Supervisory support and guidance ◦ ◦ ◦ ◦ ◦ ◦ ◦<br />
b. Opportunities to develop a range of<br />
research skills<br />
c. Opportunities to develop a range of<br />
transferable skills<br />
◦ ◦ ◦ ◦ ◦ ◦ ◦<br />
◦ ◦ ◦ ◦ ◦ ◦ ◦<br />
d. Access to appropriate facilities ◦ ◦ ◦ ◦ ◦ ◦ ◦<br />
e. The research environment ◦ ◦ ◦ ◦ ◦ ◦ ◦<br />
f. Provision of guidance on institutional<br />
standards and expectations for your research<br />
degree programme<br />
g. Overall experience of my research<br />
programme<br />
◦ ◦ ◦ ◦ ◦ ◦ ◦<br />
◦ ◦ ◦ ◦ ◦ ◦ ◦<br />
16. I am confident that I will complete my research degree programme more or less within the planned<br />
timescale (1 = Strongly Disagree and 5 = Strongly Agree)<br />
SECTION 13<br />
◦ 1 ◦ 2 ◦ 3 ◦ 4 ◦ 5 ◦ NA<br />
17. Please provide further information about your experience of your research degree programme. For<br />
example, what would further improve your experience?<br />
……………………………………………………………………………………………………………...........<br />
……………………………………………………………………………………………………………...........<br />
……………………………………………………………………………………………………………...........<br />
79
<strong>PRES</strong> <strong>2011</strong> Results – September <strong>2011</strong><br />
Space for institutional questions<br />
80
<strong>PRES</strong> <strong>2011</strong> Results – September <strong>2011</strong><br />
DEMOGRAPHIC QUESTIONS<br />
18. I am registered as doing a:<br />
PhD<br />
Professional doctorate<br />
PhD by published work<br />
New Route PhD<br />
MPhil with transfer to PhD<br />
MPhil<br />
Master in research<br />
Other (Please specify)………………………………………………………………..<br />
Note: PhD includes DPhil courses.<br />
19. The main motivation for me pursuing a research degree programme was:<br />
my interest in the subject<br />
improving my career prospects for an academic/research career<br />
improving my career prospects outside of an academic/research career<br />
I was encouraged by a former academic tutor/supervisor<br />
the funding was available<br />
it felt like a natural step for me<br />
I felt inspired to work with a particular academic<br />
Other (Please specify)………………………………………………………………..<br />
20. What type of career do you have in mind for when you complete your research degree?<br />
Academic career in higher education (either research and teaching, or teaching only)<br />
<strong>Research</strong> career in higher education<br />
<strong>Research</strong> career outside higher education (e.g. in a private research organisation, a charity or in an<br />
industrial environment)<br />
Teaching (at a level below higher education)<br />
Any other professional career<br />
Self-employment (including setting up own business)<br />
Returning to or remaining with employer who is sponsoring your degree<br />
Other (Please specify)………………………………………………………………..<br />
81
<strong>PRES</strong> <strong>2011</strong> Results – September <strong>2011</strong><br />
21. I am:<br />
25 years old or younger<br />
26-30 years old<br />
31-35 years old<br />
36-40 years old<br />
41-45 years old<br />
46-50 years old<br />
51-55 years old<br />
56 years old or older<br />
22. I am:<br />
Male<br />
Female<br />
23. Do you consider yourself to have a disability?<br />
Yes<br />
No<br />
If yes, please choose one from the following options: (as a drop down list)<br />
Social/communication impairment such as Asperger’s syndrome/other autistic spectrum disorder<br />
Blind/serious visual impairment uncorrected by glasses<br />
Deaf/serious hearing impairment<br />
Long standing illness or health condition such as cancer, HIV, diabetes, chronic heart disease, or<br />
epilepsy<br />
Mental health condition, such as depression, schizophrenia or anxiety disorder<br />
Specific learning difficulty such as dyslexia, dyspraxia, or AD(H)D<br />
Physical impairment or mobility issues, such as difficulty using your arms or using a wheelchair or<br />
crutches<br />
A disability, impairment or medical condition that is not listed above<br />
Two or more impairments and/or disabling medical conditions<br />
82
<strong>PRES</strong> <strong>2011</strong> Results – September <strong>2011</strong><br />
24. My discipline is:<br />
Medicine and Dentistry<br />
Medical Science and Pharmacy<br />
Nursing<br />
Other subjects allied to Medicine<br />
Biology and related Sciences<br />
Sports Science<br />
Psychology<br />
Veterinary Sciences<br />
Agriculture and related subjects<br />
Physical Science<br />
Physical Geography and Environmental Science<br />
Mathematical Sciences<br />
Computer Science<br />
Mechanically-based Engineering<br />
Electronic and Electrical Engineering<br />
Civil, Chemical and other Engineering<br />
Technology<br />
Architecture, Building and Planning<br />
Economics<br />
Politics<br />
Sociology, Social Policy and Anthropology<br />
Social Work<br />
Human and Social Geography<br />
Law<br />
Business<br />
Management<br />
Finance and Accounting<br />
Tourism, Transport, Travel and others in Business and Administrative studies<br />
Media studies<br />
Communications and Information studies<br />
English-based studies<br />
European Languages and Area studies<br />
Other Languages and Area studies<br />
History and Archaeology<br />
Philosophy, Theology and Religious studies<br />
Art and Design<br />
Performing Arts<br />
Other Creative Arts<br />
Teacher Training<br />
Education studies<br />
Combined<br />
83
<strong>PRES</strong> <strong>2011</strong> Results – September <strong>2011</strong><br />
25. *** Which Department do you belong to? *** This is a question for each institution to map their<br />
departmental structure. The format of this question is a drop down list and question wording can be<br />
changed or deleted. If you wish to compare your results with previous years in BOS, please test your<br />
question wording carefully to make sure that you can access the information you need.<br />
26. I am currently registered as studying:<br />
Full time<br />
Part time<br />
27. What year of your research degree programme are you in?<br />
Drop down list from 1 to 9 years<br />
Other (Please specify)………………………………………………………………..<br />
28. I currently:<br />
am planning or doing my research<br />
am writing up my thesis<br />
have submitted my thesis and I am awaiting my viva<br />
am making amendments to my thesis following my viva<br />
am awaiting my doctoral award following my viva<br />
Other (Please specify)………………………………………………………………..<br />
29. I am:<br />
Primarily a face to face learner [e.g., based at my institution]<br />
Primarily a distance learner<br />
30. For fees purposes, is your normal place of residence registered as:<br />
Home<br />
Other EU<br />
Non EU<br />
84
<strong>PRES</strong> <strong>2011</strong> Results – September <strong>2011</strong><br />
31. Where is your normal<br />
place of residence?<br />
Afghanistan<br />
Åland Islands<br />
Albania<br />
Algeria<br />
American Samoa<br />
Andorra<br />
Angola<br />
Anguilla<br />
Antigua and<br />
Barbuda<br />
Argentina<br />
Armenia<br />
Aruba<br />
Australia<br />
Austria<br />
Azerbaijan<br />
Bahamas<br />
Bahrain<br />
Bangladesh<br />
Barbados<br />
Belarus<br />
Belgium<br />
Belize<br />
Benin<br />
Bermuda<br />
Bhutan<br />
Bolivia<br />
(Plurinational state<br />
of)<br />
Bosnia and<br />
Herzegovina<br />
Botswana<br />
Brazil<br />
British Virgin<br />
Islands<br />
Brunei Darussalam<br />
Bulgaria<br />
Burkina Faso<br />
Burundi<br />
Cambodia<br />
Cameroon<br />
Canada<br />
Cape Verde<br />
Cayman Islands<br />
Central African<br />
Republic<br />
Chad<br />
Channel Islands<br />
Chile<br />
China<br />
China, Hong Kong<br />
Special<br />
Administrative<br />
Region<br />
China, Macao<br />
Special<br />
Administrative<br />
Region<br />
Colombia<br />
Comoros<br />
Congo<br />
Cook Islands<br />
Costa Rica<br />
Côte d’Ivoire<br />
Croatia<br />
Cuba<br />
Cyprus<br />
Czech Republic<br />
Democratic<br />
People’s Republic<br />
of Korea<br />
Democratic<br />
Republic of the<br />
Congo<br />
Denmark<br />
Djibouti<br />
Dominica<br />
Dominican<br />
Republic<br />
Ecuador<br />
Egypt<br />
El Salvador<br />
Equatorial Guinea<br />
Eritrea<br />
Estonia<br />
Ethiopia<br />
Faeroe Islands<br />
Falkland Islands<br />
(Malvinas)<br />
Fiji<br />
Finland<br />
France<br />
French Guiana<br />
French Polynesia<br />
Gabon<br />
Gambia<br />
Georgia<br />
Germany<br />
Ghana<br />
85<br />
Gibraltar<br />
Greece<br />
Greenland<br />
Grenada<br />
Guadeloupe<br />
Guam<br />
Guatemala<br />
Guernsey<br />
Guinea<br />
Guinea-Bissau<br />
Guyana<br />
Haiti<br />
Holy See<br />
Honduras<br />
Hungary<br />
Iceland<br />
India<br />
Indonesia<br />
Iran (Islamic<br />
Republic of)<br />
Iraq<br />
Ireland<br />
Isle of Man<br />
Israel<br />
Italy<br />
Jamaica<br />
Japan<br />
Jersey<br />
Jordan<br />
Kazakhstan<br />
Kenya<br />
Kiribati<br />
Kuwait<br />
Kyrgyzstan<br />
Lao People’s<br />
Democratic<br />
Republic<br />
Latvia<br />
Lebanon<br />
Lesotho<br />
Liberia<br />
Libyan Arab<br />
Jamahiriya<br />
Liechtenstein<br />
Lithuania<br />
Luxembourg<br />
Madagascar<br />
Malawi<br />
Malaysia<br />
Maldives<br />
Mali
Malta<br />
Marshall Islands<br />
Martinique<br />
Mauritania<br />
Mauritius<br />
Mayotte<br />
Mexico<br />
Micronesia<br />
(Federated States<br />
of)<br />
Monaco<br />
Mongolia<br />
Montenegro<br />
Montserrat<br />
Morocco<br />
Mozambique<br />
Myanmar<br />
Namibia<br />
Nauru<br />
Nepal<br />
Netherlands<br />
Netherlands<br />
Antilles<br />
New Caledonia<br />
New Zealand<br />
Nicaragua<br />
Niger<br />
Nigeria<br />
Niue<br />
Norfolk Island<br />
Northern Mariana<br />
Islands<br />
Norway<br />
Occupied<br />
Palestinian<br />
Territory<br />
Oman<br />
Pakistan<br />
Palau<br />
Panama<br />
Papua New Guinea<br />
Paraguay<br />
Peru<br />
Philippines<br />
Pitcairn<br />
Poland<br />
Portugal<br />
Puerto Rico<br />
Qatar<br />
Republic of Korea<br />
Republic of<br />
Moldova<br />
Réunion<br />
Romania<br />
Russian Federation<br />
Rwanda<br />
Saint-Barthélemy<br />
Saint Helena<br />
Saint Kitts and<br />
Nevis<br />
Saint Lucia<br />
Saint-Martin<br />
(French part)<br />
Saint Pierre and<br />
Miquelon<br />
Saint Vincent and<br />
the Grenadines<br />
Samoa<br />
San Marino<br />
Sao Tome and<br />
Principe<br />
Saudi Arabia<br />
Senegal<br />
Serbia<br />
Seychelles<br />
Sierra Leone<br />
Singapore<br />
Slovakia<br />
Slovenia<br />
Solomon Islands<br />
Somalia<br />
South Africa<br />
Spain<br />
Sri Lanka<br />
Sudan<br />
Suriname<br />
Svalbard and Jan<br />
Mayen Islands<br />
Swaziland<br />
Sweden<br />
Switzerland<br />
Syrian Arab<br />
Republic<br />
Tajikistan<br />
Thailand<br />
The former<br />
Yugoslav Republic<br />
of Macedonia<br />
<strong>PRES</strong> <strong>2011</strong> Results – September <strong>2011</strong><br />
Timor-Leste<br />
Togo<br />
Tokelau<br />
Tonga<br />
Trinidad and<br />
Tobago<br />
Tunisia<br />
Turkey<br />
Turkmenistan<br />
Turks and Caicos<br />
Islands<br />
Tuvalu<br />
Uganda<br />
Ukraine<br />
United Arab<br />
Emirates<br />
United Kingdom –<br />
England<br />
United Kingdom –<br />
Northern Ireland<br />
United Kingdom –<br />
Scotland<br />
United Kingdom –<br />
Wales<br />
United Republic of<br />
Tanzania<br />
United States of<br />
America<br />
United States<br />
Virgin Islands<br />
Uruguay<br />
Uzbekistan<br />
Vanuatu<br />
Venezuela<br />
(Bolivarian<br />
Republic of)<br />
Viet Nam<br />
Wallis and Futuna<br />
Islands<br />
Western Sahara<br />
Yemen<br />
Zambia<br />
Zimbabwe<br />
Other (Please<br />
specify)...................<br />
...............................<br />
..................<br />
32. I class myself as:<br />
86
<strong>PRES</strong> <strong>2011</strong> Results – September <strong>2011</strong><br />
White: British/Irish/Any other white background<br />
Mixed: White and Black Caribbean/White and Black/White and Asian/Any other mixed<br />
background<br />
Asian or Asian British: Indian/Pakistani/Bangladeshi/Any other West or South Asian background<br />
Black or Black British: Caribbean/African/Any other Black background<br />
Chinese: Chinese/Any other East Asian background<br />
Other (Please specify)………………………………………………………………..<br />
33. Are you currently in paid employment?<br />
Yes<br />
No<br />
If yes, how many hours of paid employment do you undertake in a typical week (term time)?<br />
1-10 hours<br />
11-20 hours<br />
21-30 hours<br />
More than 30 hours<br />
34. You are: (select all that apply)<br />
Self-funded<br />
<strong>Research</strong> Council funded<br />
Charity<br />
Institution funded<br />
UK industry funded<br />
UK Government funded<br />
EU/EC funded<br />
Funded overseas<br />
Other (Please specify)………………………………………………………………..<br />
Note: Institution funded = <strong>Higher</strong> Education Institution funded<br />
Note: Funded overseas = funded by an overseas organisation<br />
35. In the year before starting my research degree programme I:<br />
Completed my undergraduate studies<br />
Completed my postgraduate studies [for example, MSc, MA]<br />
Took a gap year<br />
Worked in the same organisation that I currently work in<br />
Worked as a researcher<br />
Worked in a non research role<br />
Other (Please specify)………………………………………………………………..<br />
87