Postgraduate Research Experience Survey (PRES) 2011 - Higher ...
Postgraduate Research Experience Survey (PRES) 2011 - Higher ...
Postgraduate Research Experience Survey (PRES) 2011 - Higher ...

You also want an ePaper? Increase the reach of your titles
YUMPU automatically turns print PDFs into web optimized ePapers that Google loves.
<strong>PRES</strong> <strong>2011</strong> Results – September <strong>2011</strong><br />
An analysis of responses suggests that students select this option only when relevant, as the profile of<br />
‘N/A’ responses is highly variable throughout the survey (ranging from 0.4% to 51.9%). Extra analysis has<br />
been carried out comparing the national response profiles of <strong>PRES</strong> <strong>2011</strong> and <strong>PRES</strong> 2009, the results of<br />
which suggest that for most items the addition of this option has not had a significant impact on the<br />
response profile. The general increase in positivity that is apparent in the results for <strong>2011</strong> (see Section 2<br />
below) appears not to be a direct product of the introduction of the N/A option: the increases in positivity<br />
occur regardless of the proportion of N/A responses for each item, and also occur for items where the<br />
option existed in 2009. More detailed analysis will be required to gain more information about the effect<br />
of the introduction of the N/A option, but there is no evidence thus far that it has any important effect on<br />
the key findings of the <strong>2011</strong> survey 4 .<br />
Demographic response options<br />
The disability response options (Q23) were updated to those currently used by the <strong>Higher</strong> Education<br />
Statistics Agency (HESA). A selection list of countries was also added for Q31, to enable more fine-grained<br />
demographic analyses where relevant. Finally, the ‘paid employment’ item (Q33) was added: this has<br />
always been asked in the <strong>Postgraduate</strong> Taught <strong>Experience</strong> Questionnaire (PTES), but was introduced to<br />
<strong>PRES</strong> this year for possible comparison between taught and research students in relation to working<br />
outside their degree programmes.<br />
<strong>Survey</strong> Access Control<br />
In order to further ensure the robustness of the survey, in <strong>2011</strong> a new security procedure was made<br />
mandatory to all institutions participating in <strong>PRES</strong> and PTES. <strong>Survey</strong> Access Control requires each<br />
respondent to enter a username and password to complete the survey in order to ensure that it is only<br />
completed by members of the target population, and that no student is able to complete the survey more<br />
than once. Some institutions additionally purchased the ‘passing parameters’ module from BOS, which<br />
allowed them to run the survey via an existing portal or an embedded hyperlink, thus removing the need<br />
for students to explicitly type in (or copy-and-paste from their invitation email) their username and<br />
password. This additional measure was intended to remove any potential barriers to student<br />
participation, and participating institutions will be encouraged to use this module in future<br />
administrations of the survey.<br />
Participation<br />
Out of 97,571 students surveyed, 31,202 (32%) in total responded to <strong>PRES</strong> <strong>2011</strong>. This covers roughly 30%<br />
of the total PGR population in the UK according to comparisons with HESA data for 2009-10 5 .<br />
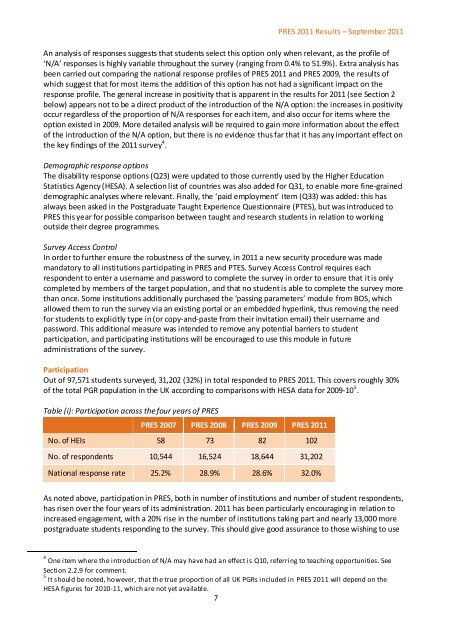
Table (i): Participation across the four years of <strong>PRES</strong><br />
<strong>PRES</strong> 2007 <strong>PRES</strong> 2008 <strong>PRES</strong> 2009 <strong>PRES</strong> <strong>2011</strong><br />
No. of HEIs 58 73 82 102<br />
No. of respondents 10,544 16,524 18,644 31,202<br />
National response rate 25.2% 28.9% 28.6% 32.0%<br />
As noted above, participation in <strong>PRES</strong>, both in number of institutions and number of student respondents,<br />
has risen over the four years of its administration. <strong>2011</strong> has been particularly encouraging in relation to<br />
increased engagement, with a 20% rise in the number of institutions taking part and nearly 13,000 more<br />
postgraduate students responding to the survey. This should give good assurance to those wishing to use<br />
4 One item where the introduction of N/A may have had an effect is Q10, referring to teaching opportunities. See<br />
Section 2.2.9 for comment.<br />
5 It should be noted, however, that the true proportion of all UK PGRs included in <strong>PRES</strong> <strong>2011</strong> will depend on the<br />
HESA figures for 2010-11, which are not yet available.<br />
7