Postgraduate Research Experience Survey (PRES) 2011 - Higher ...
Postgraduate Research Experience Survey (PRES) 2011 - Higher ...
Postgraduate Research Experience Survey (PRES) 2011 - Higher ...

Create successful ePaper yourself
Turn your PDF publications into a flip-book with our unique Google optimized e-Paper software.
<strong>PRES</strong> <strong>2011</strong> Results – September <strong>2011</strong><br />
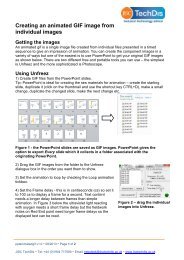
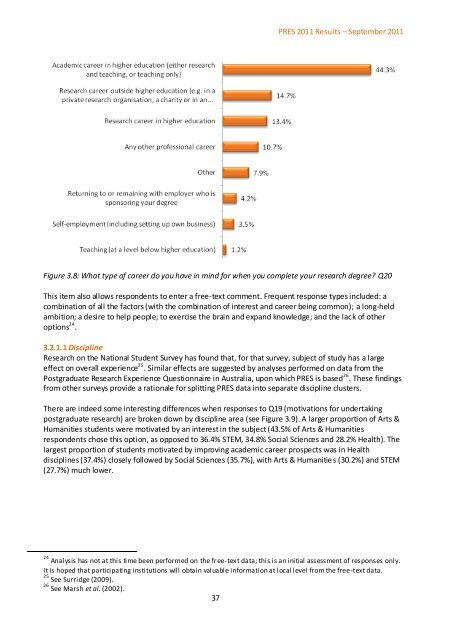
Figure 3.8: What type of career do you have in mind for when you complete your research degree? Q20<br />
This item also allows respondents to enter a free-text comment. Frequent response types included: a<br />
combination of all the factors (with the combination of interest and career being common); a long-held<br />
ambition; a desire to help people; to exercise the brain and expand knowledge; and the lack of other<br />
options 24 .<br />
3.2.1.1 Discipline<br />
<strong>Research</strong> on the National Student <strong>Survey</strong> has found that, for that survey, subject of study has a large<br />
effect on overall experience 25 . Similar effects are suggested by analyses performed on data from the<br />
<strong>Postgraduate</strong> <strong>Research</strong> <strong>Experience</strong> Questionnaire in Australia, upon which <strong>PRES</strong> is based 26 . These findings<br />
from other surveys provide a rationale for splitting <strong>PRES</strong> data into separate discipline clusters.<br />
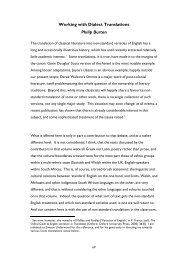
There are indeed some interesting differences when responses to Q19 (motivations for undertaking<br />
postgraduate research) are broken down by discipline area (see Figure 3.9). A larger proportion of Arts &<br />
Humanities students were motivated by an interest in the subject (43.5% of Arts & Humanities<br />
respondents chose this option, as opposed to 36.4% STEM, 34.8% Social Sciences and 28.2% Health). The<br />
largest proportion of students motivated by improving academic career prospects was in Health<br />
disciplines (37.4%) closely followed by Social Sciences (35.7%), with Arts & Humanitie s (30.2%) and STEM<br />
(27.7%) much lower.<br />
24 Analysis has not at this time been performed on the fr ee-text data; this is an initial assessment of responses only.<br />
It is hoped that participating institutions will obtain valuable information at local level from the free-text data.<br />
25 See Surridge (2009).<br />
26 See Marsh et al. (2002).<br />
37