Postgraduate Research Experience Survey (PRES) 2011 - Higher ...
Postgraduate Research Experience Survey (PRES) 2011 - Higher ...
Postgraduate Research Experience Survey (PRES) 2011 - Higher ...

You also want an ePaper? Increase the reach of your titles
YUMPU automatically turns print PDFs into web optimized ePapers that Google loves.
<strong>PRES</strong> <strong>2011</strong> Results – September <strong>2011</strong><br />
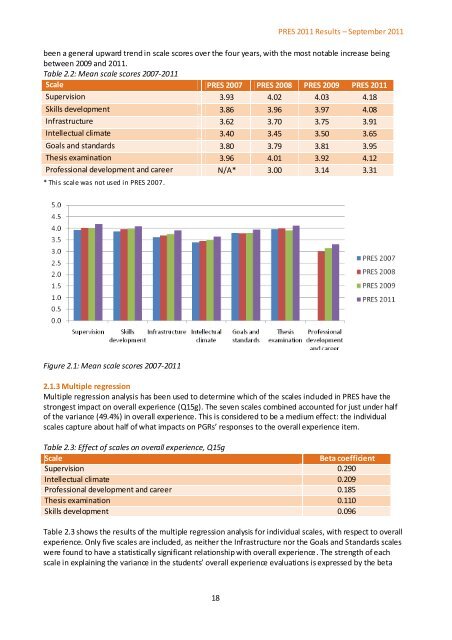
been a general upward trend in scale scores over the four years, with the most notable increase being<br />
between 2009 and <strong>2011</strong>.<br />
Table 2.2: Mean scale scores 2007-<strong>2011</strong><br />
Scale <strong>PRES</strong> 2007 <strong>PRES</strong> 2008 <strong>PRES</strong> 2009 <strong>PRES</strong> <strong>2011</strong><br />
Supervision 3.93 4.02 4.03 4.18<br />
Skills development 3.86 3.96 3.97 4.08<br />
Infrastructure 3.62 3.70 3.75 3.91<br />
Intellectual climate 3.40 3.45 3.50 3.65<br />
Goals and standards 3.80 3.79 3.81 3.95<br />
Thesis examination 3.96 4.01 3.92 4.12<br />
Professional development and career N/A* 3.00 3.14 3.31<br />
* This scale was not used in <strong>PRES</strong> 2007.<br />
Figure 2.1: Mean scale scores 2007-<strong>2011</strong><br />
2.1.3 Multiple regression<br />
Multiple regression analysis has been used to determine which of the scales included in <strong>PRES</strong> have the<br />
strongest impact on overall experience (Q15g). The seven scales combined accounted for just under half<br />
of the variance (49.4%) in overall experience. This is considered to be a medium effect: the individual<br />
scales capture about half of what impacts on PGRs’ responses to the overall experience item.<br />
Table 2.3: Effect of scales on overall experience, Q15g<br />
Scale<br />
Beta coefficient<br />
Supervision 0.290<br />
Intellectual climate 0.209<br />
Professional development and career 0.185<br />
Thesis examination 0.110<br />
Skills development 0.096<br />
Table 2.3 shows the results of the multiple regression analysis for individual scales, with respect to overall<br />
experience. Only five scales are included, as neither the Infrastructure nor the Goals and Standards scales<br />
were found to have a statistically significant relationship with overall experience. The strength of each<br />
scale in explaining the variance in the students’ overall experience evaluations is expressed by the beta<br />
18