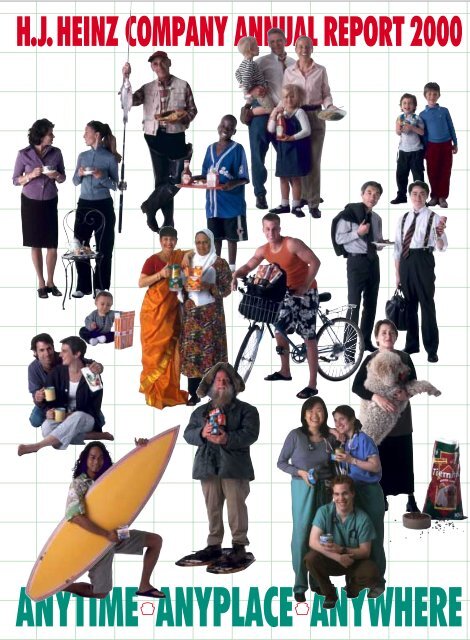
ANYTIMEkANYPLACEkANYWHERE - Heinz
ANYTIMEkANYPLACEkANYWHERE - Heinz
ANYTIMEkANYPLACEkANYWHERE - Heinz

Create successful ePaper yourself
Turn your PDF publications into a flip-book with our unique Google optimized e-Paper software.
H.J. HEINZ COMPANY ANNUAL REPORT 2000<br />
ANYTIME k ANYPLACE k ANYWHERE
ABOUT<br />
THIS<br />
ANNUAL<br />
REPORT<br />
Anytime,<br />
anyplace,<br />
anywhere —<br />
these are the occasions<br />
to enjoy the great taste of<br />
<strong>Heinz</strong>. At any given<br />
moment, in any setting<br />
on any point on the<br />
globe, food lovers are<br />
favoring the delicious<br />
flavors, unsurpassed<br />
nutrition and quick-serve<br />
convenience of <strong>Heinz</strong><br />
products. Renowned for<br />
the world’s favorite<br />
ketchup, <strong>Heinz</strong> is a premier<br />
international American food<br />
company, with number-one and<br />
number-two brands in more than<br />
50 countries. Its wellknown<br />
brands extend from kitchen table to restaurant<br />
counter, from dining room to picnic and from oven to<br />
microwave. In the past year, <strong>Heinz</strong> has addressed the<br />
frenzied pace of modern life with a host of innovations<br />
to excite the palate. At home, <strong>Heinz</strong> varieties satisfy<br />
the diverse tastes of many cultures, lifestyles and<br />
nations. On the road, <strong>Heinz</strong> is also a top performer,<br />
with leading eat-out attractions, such as <strong>Heinz</strong><br />
ketchup, ABC sauces and Chef Francisco soups.<br />
Every age has a <strong>Heinz</strong> brand to savor. Every meal<br />
has a <strong>Heinz</strong> solution. Every country has a <strong>Heinz</strong> taste<br />
to enjoy.<br />
E-Z DOES IT. Coming this fall – <strong>Heinz</strong> EZ Squirt<br />
ketchup, a transformative idea to drive growth and<br />
excite usage among the category’s biggest consumers.<br />
Kids use 5 billion ounces of ketchup annually, and <strong>Heinz</strong><br />
EZ Squirt is made for them. Its new cap and curved<br />
plastic container give kids an easier grip and more<br />
creative control for “drawing” on food. The only<br />
ketchup enriched with Vitamin C, <strong>Heinz</strong> EZ Squirt will<br />
also be first to come in “Blastin’ Green” as well as tomato<br />
red. Once again, <strong>Heinz</strong> proves that you can improve<br />
perfection – even the world’s perfect ketchup.<br />
MUMBAI 10:30PM The tropical heat of<br />
India calls for serious refreshment. Glucon-D<br />
does the trick. With a 71% market share, it is<br />
India’s best-selling glucose-based energy<br />
drink mix. A biscuit and a ready-to-drink,<br />
single-serve version of Glucon-D were<br />
introduced, too. The vitamin-enriched drink<br />
contains pure dextrose monohydrate, which<br />
is absorbed instantly by the body.<br />
India, with one-sixth of the world’s<br />
population, represents a huge opportunity for<br />
<strong>Heinz</strong>. Its consumer class of about 100<br />
million people could double in the next five<br />
years. <strong>Heinz</strong> recently began selling ketchup in<br />
India, where the condiment is called a<br />
“romance food” and is rapidly becoming<br />
popular. Indian TV commercials promote<br />
<strong>Heinz</strong> ketchup with the tagline, “<strong>Heinz</strong><br />
Meanz Happinez.”<br />
(4)
HIGHLIGHTS<br />
H.J. <strong>Heinz</strong> Company and Subsidiaries<br />
2000 1999 1998<br />
(Dollars in thousands, except per share amounts) (53 Weeks) (52 Weeks) (52 Weeks)<br />
Sales $9,407,949 $9,299,610 $9,209,284<br />
Operating income 1,733,099 1,109,312 1,520,330<br />
Net income 890,553 474,341 801,566<br />
Per common share amounts:<br />
Net income – diluted $ 2.47 $ 1.29 $ 2.15<br />
Cash dividends 1.44 1 ⁄ 2 1.34 1 ⁄4 1.23 1 ⁄2<br />
Book value 4.59 5.02 6.10<br />
Capital expenditures $ 452,444 $ 316,723 $ 373,754<br />
Depreciation and amortization expense 306,483 302,212 313,622<br />
Property, plant and equipment, net 2,358,753 2,171,024 2,394,662<br />
Cash, cash equivalents and short-term investments $ 154,129 $ 123,121 $ 99,398<br />
Operating working capital 1,066,325 881,542 762,474<br />
Total debt 4,112,401 3,376,413 3,107,903<br />
Shareholders’ equity 1,595,856 1,803,004 2,216,516<br />
Average common shares outstanding – diluted 360,095,455 367,830,419 372,952,851<br />
Current ratio 1.49 1.04 1.24<br />
Debt/invested capital 72.0% 65.2% 58.4%<br />
Pretax return on average invested capital 31.4% 20.4% 26.4%<br />
Return on average shareholders’ equity 52.4% 23.6% 34.4%<br />
(Note: All earnings per share amounts are on an after-tax diluted basis.)<br />
The 2000 results include net restructuring and implementation costs of $392.7 million pretax ($0.74 per share) for Operation Excel,<br />
a pretax contribution of $30.0 million ($0.05 per share) to the H.J. <strong>Heinz</strong> Company Foundation, costs related to Ecuador of $20.0 million<br />
pretax ($0.05 per share), a gain of $464.6 million pretax ($0.72 per share) on the sale of the Weight Watchers classroom business and<br />
a gain of $18.2 million pretax ($0.03 per share) on the sale of an office building in the U.K.<br />
The 1999 results include restructuring and implementation costs of $552.8 million pretax ($1.11 per share) for Operation Excel and costs of<br />
$22.3 million pretax ($0.04 per share) related to the implementation of Project Millennia, offset by the reversal of unutilized Project Millennia<br />
accruals for severance and exit costs of $25.7 million pretax ($0.04 per share) and a gain of $5.7 million pretax on the sale of the bakery<br />
products unit.<br />
The 1998 results include costs of $84.1 million pretax ($0.14 per share) related to the implementation of Project Millennia, offset by the gain<br />
on the sale of the Ore-Ida frozen foodservice business, $96.6 million pretax ($0.14 per share).<br />
HEINZ: A SUPERIOR PERFORMER<br />
K Earnings per share have increased by a<br />
compound annual growth rate of more than<br />
10% for the past four years.<br />
K Operating margins increased over the past four<br />
years to 18.2% from 14.1%.<br />
K Five of <strong>Heinz</strong>’s seven key global businesses<br />
recorded compound annual growth rates of<br />
5–12% per year for the past three years.<br />
K <strong>Heinz</strong> owns a focused portfolio of number-one<br />
and number-two brands. Approximately 80% of<br />
global sales stem from 40 well-known brands,<br />
ranging from the $3 billion <strong>Heinz</strong> mega-label to<br />
the fast-growing Glucon-D beverage in India.
(2)
FOND MEMORIES<br />
AND<br />
FAIR VOYAGE<br />
As Shakespeare would have it, “I am sore<br />
amazed” that more than 30 years have<br />
passed since Burt Gookin, then President<br />
and Chief Executive Officer, first approached me to<br />
join the H.J. <strong>Heinz</strong> Company as Managing Director<br />
of <strong>Heinz</strong>’s U.K. affiliate, and in succession to an<br />
illustrious company servant, Anthony de la Poer<br />
Beresford. I recall, as if it were only yesterday, Burt’s<br />
persuasive accounting of the opportunities awaiting<br />
me at one of the U.K.’s most prestigious companies.<br />
I agreed to sign on for what I declaimed to my<br />
father would be “a three-year tenure.” I could not<br />
have imagined that I would spend the rest of the<br />
century with <strong>Heinz</strong>.<br />
Life, it is observed, is a random walk. Yet of the<br />
many surprises that have advanced my life, none<br />
has been so rewarding as my long association with<br />
<strong>Heinz</strong>. For nearly two of my three decades with the<br />
company, I had the privilege of serving as its CEO.<br />
This coincided with a period of dramatic change,<br />
within <strong>Heinz</strong> and the world around it:<br />
k Revolutions in technology awakened a<br />
cosmopolitan appetite among consumers and<br />
enabled investors to move enormous flows<br />
of capital across the planet in the blink of a<br />
computer’s eye.<br />
k The collapse of the Soviet empire and the<br />
triumph of Western capitalism laid the groundwork<br />
for an economy in which commerce, rather<br />
than confrontation, would govern the allocation<br />
of resources.<br />
DUBLIN 5PM <strong>Heinz</strong> Chairman Anthony J.F. O’Reilly<br />
inspects a delivery of leading <strong>Heinz</strong> brands to the<br />
kitchen of his Castlemartin residence.<br />
k The dissolution of national borders and trade<br />
barriers unleashed the tremendous power, and<br />
daunting challenge, of global competition and<br />
shifting currency parities.<br />
Steering <strong>Heinz</strong> through these sometimes-troubled<br />
waters was an exhilarating experience for me and<br />
my colleagues. Our objective was, as it remains for<br />
today’s management, to adapt our company to<br />
the new appetites of a rapidly changing world in<br />
order to accelerate the growth of our brands and<br />
enhance shareholder value.<br />
In 1973, when I was named <strong>Heinz</strong>’s President<br />
and Chief Operating Officer, the company’s annual<br />
sales were $1.1 billion and its net income was $23.8<br />
million. By 1979, when I began as CEO, sales had<br />
doubled, to $2.5 billion, and net income stood at<br />
$110.4 million. Today, under Bill Johnson as CEO,<br />
<strong>Heinz</strong>’s annual sales exceed $9.4 billion and its<br />
net income is $925 million (excluding special<br />
items). Equally impressive, during this period,<br />
<strong>Heinz</strong>’s market capitalization has risen twenty-fold,<br />
from less than $700 million in 1973 to approximately<br />
$15 billion today and, importantly, with<br />
less shares in issue.<br />
AT HOME AROUND THE WORLD<br />
These results manifest the success of <strong>Heinz</strong>’s<br />
strategy of continuous transformation to address an<br />
ever-changing world. Foremost among these<br />
transformations has been <strong>Heinz</strong>’s emergence as a<br />
preeminent global food company. When I joined<br />
the <strong>Heinz</strong> Company in May 1969, the sales were<br />
$790 million, of which $171 million or 22% were in<br />
the U.K. Today, the breakdown is North America<br />
55% and Europe and the rest of the world 45%.<br />
(3)
This is a truly international food company.<br />
Some 20 years ago, we held a seminal<br />
management meeting at which we determined<br />
that 85% of the world’s population had not been<br />
exposed to a <strong>Heinz</strong> brand. Therein lay a limitless<br />
opportunity. The world’s fastest-growing countries<br />
were then beyond our pale, housing billions of<br />
consumers whose increasing affluence and<br />
exposure to Western media would generate an<br />
enormous appetite for <strong>Heinz</strong> products.<br />
That revelation set us on a course of geographic<br />
expansion that continues to this day. Once confined<br />
largely to North America, the U.K., Italy, the<br />
Netherlands and Australia, <strong>Heinz</strong> now has affiliates,<br />
alliances or joint ventures throughout Western and<br />
Central Europe, the Middle East, Southern Africa,<br />
Latin America and the Asia/Pacific region.<br />
A FAVORITE FOR EVERY OCCASION<br />
A second critical evolution over the years has<br />
been the expansion of <strong>Heinz</strong> products into every<br />
occasion where food is sold or consumed. <strong>Heinz</strong>’s<br />
fast-growing foodservice business has been one of<br />
the leaders of this dramatic change. Add to this the<br />
explosive demand for convenience and quick<br />
preparation. <strong>Heinz</strong>’s frozen and quick-serve<br />
categories satisfy this growing appetite through a<br />
variety of great tastes and innovative packaging.<br />
Let me say a brief word about “retailer<br />
consolidation.” The view oft expressed by some<br />
analysts is that retailer consolidation is making<br />
retailers more difficult to deal with and reducing<br />
volume and margin opportunities. What incredible<br />
nonsense. Indeed, by good management and<br />
Projects Millennia and Excel, <strong>Heinz</strong> margins have<br />
increased nearly 4% over the past four years. With<br />
the aid of an enthusiastic retail trade and not an<br />
adversarial one, we are launching new and<br />
improved brands all over the world and with<br />
success. The result of all of this is operating margins<br />
of 18.2%, above those of Bestfoods and Unilever —<br />
two well-run and aggressive companies.<br />
The result of these initiatives is a company<br />
with superior products sought after by consumers<br />
around the world in every possible setting<br />
around the clock.<br />
Iam proud to have been part of this exciting<br />
transformation of <strong>Heinz</strong> into a global food<br />
giant. As we stroll down memory lane, I think<br />
of the retired heroes of <strong>Heinz</strong>, some not with us,<br />
some very much alive — of Burt Gookin and<br />
Juny Allen; of Frank Brettholle and Karl von der<br />
Heyden; of Don Wiley, Larry McCabe and Ben<br />
Thomas; of John Real and Jerry Scharer and Keith<br />
Hauge; of Bill Agnew and Dick Patton and John<br />
Connell and John Hinch; of Luigi Ribolla and Peter<br />
Borasio and Lino Ghirardato; of Derek Finlay and<br />
David Sculley and Paul Corddry and J Connolly; of<br />
Bill Springer and Bob Pedersen and Gerry Herrick<br />
and Ed Osborne and Chuck Berger; of Don McVay;<br />
and a thousand other noble men and women like<br />
George Greer, Ned Churchill, Andrew Barrett,<br />
Walter Schmid, Clyde Fearer, Mass Ogawa, David<br />
Irving, Doug Dibb, Tom Smith, Dick Beattie, John<br />
Werner, Rob Kuijpers, John Mazur, Manny Albarran,<br />
Jerry Larrea and Charlie Lowe. All of them lived<br />
their lives for <strong>Heinz</strong> and the sheer sense of quality<br />
and collegiality it brought to them and their<br />
wonderful wives. I am grateful to have worked<br />
with them and so many others.<br />
On a very personal note, I want to say that<br />
(4)
ehind every CEO there is a dauntless, creative<br />
and protective staff. All who have ever dealt with<br />
<strong>Heinz</strong> encountered the Rock of Olive Deasy.<br />
Courteous, friendly and yet immovable, she had<br />
wise counsel, formidable recollective powers and<br />
fine judgment which have served and continue to<br />
serve our family for over 40 years. On retirement,<br />
she was succeeded by Eileen Stevenson, whose<br />
friendliness and organizational skills have made<br />
her indispensable to me.<br />
When I joined the company on May 1, 1969,<br />
Henry J. <strong>Heinz</strong> II was the Chairman. Jack <strong>Heinz</strong><br />
was elegant, imaginative and scrupulously ethical.<br />
He epitomized the great qualities of the <strong>Heinz</strong><br />
family — entrepreneur, global citizen,<br />
philanthropist. In addition to Jack, <strong>Heinz</strong> was<br />
fortunate to have, over the years, a Board of<br />
Directors that always worked diligently for the<br />
best interests of shareholders.<br />
The <strong>Heinz</strong> Board, in its present and past<br />
manifestations, represents the best of the best,<br />
has fine people, a good blend of insider knowledge<br />
and outsider wisdom and has stood the test of time,<br />
unlike some other Boards once celebrated.<br />
Looking back, I see great figures on that<br />
Board, such as: Lewis Lapham II, President<br />
of Bankers Trust; John Mayer, President of<br />
Mellon Bank; Jim McDonald, President of General<br />
Motors; Tom Foley, Speaker of the House of<br />
Representatives; Dick Cyert, President of Carnegie<br />
Mellon; Bill Scranton, Governor of Pennsylvania;<br />
Vira <strong>Heinz</strong>; John Ryan, Chairman & CEO of Mine<br />
Safety Appliances; Juny Allen, my first-ever senior<br />
vice president; Al Lippert, founder of Weight<br />
Watchers; and the inimitable Joe Bogdanovich.<br />
They lent their guiding presence and sound advice<br />
as examples of quality and independent thought.<br />
This year, we will lose Bill Snyder, Eleanor<br />
Sheldon, Herm Schmidt and Don Wiley, whose<br />
contributions, interventions and support have<br />
contributed to everyone who holds <strong>Heinz</strong> stock.<br />
Their opinions were fearless, articulate and fair.<br />
The gracious Eleanor, the thoughtful Herm and<br />
the prudential Don will not mind if I single out the<br />
special contribution of Bill Snyder. Since 1961, or<br />
for almost 40 years, he has been a director of this<br />
company. His courtesy, cheerfulness and concern<br />
have served his colleagues in every way possible.<br />
I salute his career with admiration and affection,<br />
as I do our other departing directors.<br />
Finally, let me say that I am supremely confident<br />
in the leadership of Bill Johnson and his<br />
management team. Bill Johnson is only the sixth<br />
CEO in the 131-year history of your company, and<br />
his troops have readied <strong>Heinz</strong> for the opportunities<br />
of a new century and set it on a course for<br />
accelerated growth and profit. I bid them fair<br />
voyage and, as a fellow shareholder, look forward<br />
to their success as they continue to make <strong>Heinz</strong> the<br />
best international food company in the world.<br />
Our founder, Henry John <strong>Heinz</strong>, proclaimed<br />
that “to do the common thing uncommonly well<br />
brings success.” It is a pithy summary and it will be<br />
our motif for the future years.<br />
Anthony J.F. O’Reilly<br />
Chairman<br />
(5)
ANTICIPATING<br />
A YEAR OF RECORD<br />
INNOVATION<br />
A Question-and-Answer Session<br />
with President & CEO Bill Johnson<br />
Q What were the highlights of Fiscal 2000?<br />
AFiscal 2000 was highlighted by a stronger<br />
focus on marketing-oriented innovation<br />
and top-line growth. Innovative products<br />
ranged from <strong>Heinz</strong> EZ Squirt ketchup to Boston<br />
Market HomeStyle Meals to StarKist pouch tuna to<br />
Italian organic baby foods to <strong>Heinz</strong> microwaveable<br />
meals in Europe.<br />
We made notable top-line progress in a number<br />
of key areas, with particularly strong sales growth<br />
in ketchup, condiments and sauces (+9.4%), frozen<br />
foods (+11.6%), and foodservice (+12.5%).<br />
At the same time, we did not neglect the bottom<br />
line as we delivered earnings per share of $2.57,<br />
excluding special items. Despite the hugely<br />
unfavorable sales impact of foreign currency ($737<br />
million) and more than $1 billion in divestitures,<br />
we have averaged compound EPS growth rates of<br />
better than 10% a year since Fiscal 1996.<br />
Q What can we expect this year and beyond?<br />
A Expect aggressive innovation and marketing.<br />
We are focusing on growing the top line — not<br />
through simple line extensions — but through<br />
enticing products that really excite consumers.<br />
Essentially, as <strong>Heinz</strong> successfully completes its<br />
restructuring initiatives, we are now concerned<br />
more with market-driven ideas than assets.<br />
Our goal is consumer excitement, enjoyment<br />
and convenience. In frozen foods, for example, we<br />
are bringing great taste back to the freezer. This<br />
campaign commenced with the launch of Smart<br />
Ones, which we followed in the past year with the<br />
launch of Boston Market HomeStyle Meals in<br />
supermarkets. Boston Market is our most successful<br />
new product in decades.<br />
And, it was almost impossible not to see the<br />
massive TV coverage of our new kid’s <strong>Heinz</strong> EZ<br />
Squirt ketchup in July. Children will be able to<br />
make all sorts of designs with our adjustable nozzle<br />
and red and green colors when <strong>Heinz</strong> EZ Squirt hits<br />
the shelves in October.<br />
We have also launched a major breakthrough<br />
in StarKist tuna with the introduction of vacuum<br />
pouch packaging, with no draining, mixing or<br />
hassle. The superior texture and fresh taste of this<br />
new tuna will bring millions of people back to this<br />
nutritious food.<br />
Q Food stocks continued to lag in Fiscal 2000.<br />
What makes <strong>Heinz</strong> a good investment?<br />
A For the past two years, the <strong>Heinz</strong><br />
performance mirrored that of the out-of-favor food<br />
industry. But recently our stock has outperformed<br />
our peers.The fascination with technology stocks<br />
continues, but I think investors are beginning to<br />
rediscover the importance of consistent growth in<br />
sales, earnings and cash flow. Investors are realizing<br />
that we are now strongly positioned for global<br />
expansion and top-line growth, making <strong>Heinz</strong> one<br />
of the most attractive food stocks.<br />
Q What does the consolidation of the food<br />
industry mean for <strong>Heinz</strong>?<br />
A We believe that prudent, well-thought-out<br />
BARCELONA 6PM William R. Johnson, <strong>Heinz</strong><br />
President and CEO, enjoys a taste relished around<br />
the world as he pours on the <strong>Heinz</strong> ketchup at a<br />
Spanish streetside café.<br />
(6)
(7)
consolidation can be beneficial. Clearly, the recent<br />
activity in the food industry indicates there’s a<br />
large appetite for these kinds of ventures and it’s<br />
possible to participate in different ways. But our<br />
fundamental focus is on enhancing shareholder<br />
value. This will be the impetus behind future<br />
acquisitions and new product initiatives.<br />
Q Is <strong>Heinz</strong> one of the largest food brands?<br />
A Yes, the <strong>Heinz</strong> brand is one of the largest<br />
in the global food industry, with sales of almost<br />
$3 billion, or about one-third of our total sales. It is<br />
ubiquitous, and it is growing. Of course, we have<br />
many other great brands, such as Ore-Ida, StarKist,<br />
Plasmon, ABC, UFC, Wattie’s and Smart Ones,<br />
among others. Almost 80% of our sales come from<br />
40 well-known brands. This tight focus on 40 strong<br />
brands represents a great marketing advantage<br />
versus companies with hundreds of smaller brands.<br />
Q What drives <strong>Heinz</strong>’s marketing?<br />
A Consumer trends should drive all marketing.<br />
Consequently, all of our marketing will be focused<br />
against key trends that we refer to as the four Ts:<br />
K Teens & Tweens<br />
There are 800 million teenagers around the<br />
globe who increasingly think alike and who want<br />
to “personalize” everything, including their food.<br />
<strong>Heinz</strong> sauces and condiments, especially <strong>Heinz</strong><br />
ketchup, allow them to do that, whether it’s on<br />
burgers, broccoli, pasta or beans. Teens love to eat<br />
out, which our foodservice business addresses,<br />
and they love to snack, which attracts them to<br />
products like Bagel Bites frozen snacks and Ore-Ida<br />
microwaveable french fries.<br />
K Travel<br />
Everything travels now. People travel. Brands<br />
travel. Businesses travel. We have a global brand in<br />
<strong>Heinz</strong>, which travels best of all. As people travel,<br />
they look for familiar brands that they trust. Even<br />
locally, consumers are mobile. “Dashboard dining”<br />
is growing and our outstanding foodservice<br />
business is at the forefront of customized recipes<br />
and more portable meals and snacks.<br />
K Time<br />
Nobody has enough time, and that won’t<br />
change. In fact, it’s going to get worse as<br />
technology enables people to work around the<br />
clock. But this is also an opportunity, and therefore,<br />
we are launching convenient meals and snacks<br />
that are quicker, tastier and more nutritious for<br />
time-starved families.<br />
K Technology<br />
Some people sense a divide between the<br />
new economy and the old economy. In reality,<br />
<strong>Heinz</strong> is leveraging the new technology and<br />
E-commerce to cut costs, improve quality and<br />
build stronger relationships with consumers. In<br />
consumer marketing, for example, we are building<br />
new loyalty relationships through interactive,<br />
entertaining Web marketing.<br />
Q How do acquisitions fit into your top-line<br />
growth?<br />
A People forget that the modern <strong>Heinz</strong> was<br />
built primarily through acquisitions in the second<br />
half of the 20th Century. We are going to be very<br />
innovative and aggressive in focusing on the top<br />
line, but smart acquisitions — particularly in key<br />
growth areas like sauces, frozen food, foodservice<br />
and Asia — make enormous sense. Our 19.5%<br />
(8)
stake in The Hain Celestial Group makes us a major<br />
player in organic and natural foods, the fastestgrowing<br />
segment of the food industry. The<br />
acquisition of UB Frozen and Chilled Foods in the<br />
U.K. makes us a leader in the rapidly growing area<br />
of quick-serve meals in Western Europe. Our highgrowth<br />
Asian strategy was built on acquisitions to<br />
provide infrastructure and leading local brands.<br />
QWhat makes the Asia/Pacific region so<br />
promising?<br />
A The Asia/Pacific region, especially India,<br />
Indonesia, the Philippines and China, is likely to<br />
experience explosive growth in the next few years.<br />
There are three billion people in these markets,<br />
many of whom are, for the first time, being exposed<br />
to Western technology and convenient, nutritious<br />
prepared foods. Now is the time to win their loyalty.<br />
The four most populous countries in the world<br />
are China, India, the United States and Indonesia.<br />
Twenty-five years from now, that still will be the<br />
case. We are now one of the few American food<br />
companies that is well established for medium- and<br />
long-term growth in Asia.<br />
Q Any final thoughts for shareholders?<br />
A We believe <strong>Heinz</strong> is a great investment. We<br />
will continue to focus on aggressive marketing and<br />
innovation as the best way to build shareholder<br />
value. We are targeting top-line sales growth of<br />
3-5% and EPS growth of 10% in Fiscal 2001. If<br />
we achieve these goals, we will have delivered a<br />
commendable five-year compound annual growth<br />
rate in EPS of over 10%. This consistent growth<br />
rate, combined with aggressive management<br />
and growing global brands, makes <strong>Heinz</strong> a very<br />
attractive investment.<br />
Finally, I want to take this opportunity to<br />
congratulate and thank Tony O’Reilly for his 31<br />
years of distinguished leadership at <strong>Heinz</strong>. Tony<br />
has announced his intention to retire from the<br />
Chairman’s position and the Board of Directors on<br />
September 12, 2000. He departs knowing that, as<br />
only the fourth Chairman and the fifth CEO of<br />
<strong>Heinz</strong>, he greatly enriched a proud and unique<br />
tradition of leadership, which included Henry J.<br />
<strong>Heinz</strong>, Howard <strong>Heinz</strong>, Jack <strong>Heinz</strong> and Burt Gookin.<br />
Like his illustrious predecessors, Tony had a<br />
vision of <strong>Heinz</strong> as an international food company,<br />
marketing superior branded foods in every corner<br />
of the world. A new generation of <strong>Heinz</strong> leadership<br />
is avidly pursuing this vision, with a record number<br />
of product innovations and dynamic acquisitions in<br />
fast-growing markets, such as Asia.<br />
This year, we also bid farewell and offer thanks<br />
to four Directors who have been steadfast<br />
custodians of shareholder interests. Bill Snyder,<br />
Eleanor Sheldon, Herm Schmidt and Don Wiley<br />
have all been conscientious, hard-working and<br />
judicious Board members. We have valued their<br />
judgment and advice. We will miss them all.<br />
William R. Johnson<br />
President and Chief Executive Officer<br />
(9)
HELSINKI 7PM Pour it on! That’s what<br />
Scandinavians do with <strong>Heinz</strong> ketchup when<br />
they eat pasta. The culinary custom of<br />
topping noodles with ketchup helps to make<br />
Scandinavians the world’s biggest per-capita<br />
users of the classic condiment.<br />
Ketchup makes headlines in the Nordic<br />
region. A Danish television reporter, doing a<br />
story on the health benefits of <strong>Heinz</strong><br />
ketchup, drank it straight from the bottle.<br />
A polar bear made news when he raided<br />
the kitchen in a Norwegian vacation home<br />
and topped off his meal with — you got it —<br />
<strong>Heinz</strong> ketchup.<br />
AUCKLAND 5AM What’s for breakfast,<br />
Mum? For babies in New Zealand, the<br />
answer is Wattie’s. Although homemade<br />
baby food remains popular, more and more<br />
Kiwi mothers rely on prepared food. Wattie’s<br />
foods designed for older babies are also<br />
being introduced.<br />
The Wattie’s brand is especially<br />
strong in jarred baby foods with a market<br />
share of 70%.<br />
(10)
LONDON 5PM What could be more relaxing — or<br />
civilized — than a cup of tea and a scone with jam?<br />
In the United Kingdom, Frank Cooper’s is the leading<br />
name in single-serve jams and jellies. The business,<br />
bought by <strong>Heinz</strong> in 1997, began as a marmalade maker<br />
in 1874 in Oxford. It now offers a popular range of<br />
Frank Cooper’s marmalades, jams, jellies, sauces, salt,<br />
pepper and sugar packets.<br />
In Europe, eating out grows more and more popular.<br />
Europeans spend nearly 25% of their food budget<br />
outside the home, about half as much as Americans,<br />
but they are quickly catching up. Last summer, <strong>Heinz</strong><br />
added to its European single-serve offerings with the<br />
acquisition of Serv-A-Portion, which ships products<br />
across Europe from a factory in Belgium.<br />
(11)
ROME 6PM Ciao, baby! In Italy, munching on Plasmon<br />
biscotti is a rite of babyhood. The plain, crunchy<br />
biscuits are enjoyed by more than 85% of the bambini.<br />
Moms sometimes dissolve the biscuits in formula<br />
for younger babies, who later savor the biscuits as<br />
meals or as snacks.<br />
Besides the best-selling Plasmon brand, <strong>Heinz</strong><br />
markets baby food in Italy under two other lines: Nipiol<br />
and Dieterba. The company is the first in Italy to make<br />
organic baby food, which <strong>Heinz</strong> calls BioDieterba.<br />
(12)
MIAMI 12 NOON You can’t keep Mom in the dorm.<br />
(What would your friends think?) But you can enjoy the<br />
home-cooked taste of oven-roasted chicken or meatloaf<br />
with mashed potatoes and gravy. Boston Market<br />
HomeStyle Meals — 16 frozen entrees, meals and side<br />
dishes — are feeding a growing demand for easy-to-fix<br />
meals and helping make frozen foods <strong>Heinz</strong>’s fastestgrowing<br />
business. Research shows most people still<br />
prefer to eat at home, but they don’t have time to cook.<br />
These hearty meals are a big hit with men. And,<br />
women love the side dishes, like creamed spinach and<br />
macaroni & cheese. Six additional dishes, including pot<br />
roast and corn bread miniloafs, are joining the line.<br />
Sales are expected to top $100 million in the first year of<br />
national distribution, making this among <strong>Heinz</strong>’s most<br />
successful new products ever.<br />
(13)
CAPE TOWN 6PM Americans aren’t the only ones<br />
who like ketchup and fries. This irresistible combination<br />
offers universal appeal. In South Africa, sales of <strong>Heinz</strong><br />
ketchup and potato products are growing. <strong>Heinz</strong><br />
recently became the first company to sell microwaveable<br />
fries there.<br />
Kids around the world love personalizing food with<br />
thick, rich ketchup and other sauces. <strong>Heinz</strong> is targeting<br />
this powerful, young market with a global advertising<br />
campaign including Internet ads and “talking labels”<br />
with quirky messages, like “ARE YOUR FRENCH FRIES<br />
LONELY?” The effort is paying off. This year, <strong>Heinz</strong><br />
will sell more than $1 billion worth of ketchup —<br />
about 650 million bottles. The company’s ketchup,<br />
condiments and sauces business (including foodservice)<br />
is growing more than 9% a year around the globe.<br />
(14)
HONOLULU 8AM Eating on the go, at work and play,<br />
is a big part of life these days. That’s one reason why<br />
Charlie’s Lunch Kit is so popular. It allows you to make<br />
your tuna just the way you like it — anywhere, anytime.<br />
Each kit includes StarKist tuna, a two-piece cup and<br />
wooden spoon for mixing, packets of <strong>Heinz</strong> light<br />
mayonnaise and <strong>Heinz</strong> pickle relish and low-fat<br />
crackers. <strong>Heinz</strong> recently unveiled StarKist tuna in a<br />
pouch, a revolutionary product that makes enjoying<br />
tuna easier than ever. There’s no can to open and no<br />
broth to drain. Simply open the pouch, pour out the<br />
tuna and catch the wave to great taste.<br />
(15)
10<br />
9<br />
2<br />
4<br />
6<br />
22<br />
8<br />
7<br />
5<br />
3<br />
1<br />
11<br />
EVERY CULTURE,<br />
EVERY OCCASION HAS<br />
A HEINZ VARIETY<br />
THE AMERICAS<br />
(1) Buenos Aires, Argentina 2 pm<br />
– Pet treats of Tiernitos dog food<br />
(2) Prince Edward Island, Canada<br />
1 pm – Preschool lunch of <strong>Heinz</strong><br />
canned pasta<br />
(3) Caracas, Venezuela 1 pm –<br />
On-the-go lunch with <strong>Heinz</strong><br />
ketchup<br />
(4) New York, New York noon –<br />
Business luncheon with <strong>Heinz</strong><br />
ketchup and 57 Sauce<br />
(5) Miami, Florida noon –<br />
Boston Market HomeStyle Meal<br />
for the dorm<br />
(6) New Orleans, Louisiana<br />
11 am – Red beans & rice school<br />
lunch with <strong>Heinz</strong> ketchup<br />
(7) Santa Fe, New Mexico<br />
10 am – Snacktime with Portion<br />
Pac peanut butter and jelly<br />
(8) Los Angeles, California 9 am –<br />
Breakfast of Health Valley cereal<br />
and Westsoy milk<br />
(9) Vancouver, Canada 9 am –<br />
9-Lives kitten’s breakfast<br />
(10) Anchorage, Alaska 8 am –<br />
Fisherman’s breakfast platter with<br />
Ore-Ida hash browns<br />
(11) Honolulu, Hawaii 8 am –<br />
Surf-side morning snack with<br />
Charlie’s Lunch Kit.<br />
PACIFIC RIM &<br />
SOUTHWEST ASIA<br />
(12) Auckland, New Zealand<br />
5 am – Baby’s feeding with<br />
Wattie’s jarred foods<br />
(13) McMurdo Base, Antarctica<br />
5 am – <strong>Heinz</strong> and Wattie’s<br />
quick-serve meals<br />
(14) Melbourne, Australia<br />
3 am – Hospital break with<br />
Greenseas tuna<br />
(15) Tokyo, Japan 2 am –<br />
Late client dinner with <strong>Heinz</strong><br />
foodservice sauces<br />
(16) Perth, Australia 1 am –<br />
Middle-of-the-night snack of<br />
<strong>Heinz</strong> pouch soups<br />
(17) Manila, Philippines<br />
1 am – Chef’s specialties with<br />
UFC ketchup<br />
(18) Jakarta, Indonesia midnight –<br />
Family celebration with ABC soy<br />
sauces<br />
(19) Mumbai, India<br />
10:30 pm – Late-night workout<br />
with Glucon-D energy drink<br />
AFRICA<br />
(20) Cape Town, South Africa<br />
6 pm – Family dinner with <strong>Heinz</strong><br />
french fries and ketchup<br />
(21) Cairo, Egypt 6 pm –<br />
Supper with <strong>Heinz</strong> ketchup and<br />
quick-serve meals<br />
EUROPE<br />
(22) London, England<br />
5 pm – Tea with Frank Cooper’s<br />
jams and jellies<br />
(23) Liverpool, England<br />
5 pm – Afternoon snacks<br />
with Linda McCartney meatfree<br />
dishes;<br />
(24) Madrid, Spain 6 pm –<br />
After-school meal with Orlando<br />
sauces<br />
(25) Munich, Germany 6 pm –<br />
Family dinner with Sonnen<br />
Bassermann soups<br />
(26) Rome, Italy 6 pm – Baby<br />
treats of Plasmon biscotti<br />
(27) Helsinki, Finland 7 pm –<br />
<strong>Heinz</strong> ketchup on noodles<br />
for dinner<br />
(28) Warsaw, Poland 7 pm –<br />
Pudliszki ketchup tops pizza<br />
(29) Moscow, Russia 8 pm –<br />
Bedtime feeding with <strong>Heinz</strong><br />
baby food<br />
ANYTIME ANYPLACE ANYWHERE<br />
k k
29<br />
23<br />
27<br />
28<br />
25<br />
15<br />
17<br />
24<br />
26<br />
18<br />
21<br />
19<br />
14<br />
12<br />
20<br />
16<br />
13<br />
ANYTIME ANYPLACE ANYWHERE<br />
k k
POWER BRANDS EXPANDING WORLDWIDE<br />
k Nearly half of <strong>Heinz</strong>’s $9.4 billion in annual sales comes from outside<br />
the United States.<br />
k Fiscal 2000 sales volume, +3.8%.<br />
k <strong>Heinz</strong>’s leading power brands (sales exceeding $100 million) command<br />
number-one or number-two market shares in more than 50 countries<br />
(chart below).<br />
k <strong>Heinz</strong> varieties are marketed in more than 200 countries and territories.<br />
k The <strong>Heinz</strong> label is one of the most powerful, global brands in the<br />
food industry, with annual sales approaching $3 billion.<br />
North America, Caribbean<br />
United States<br />
1 ● 1 1 2 2<br />
Canada 1 ● 1 1 <br />
Caribbean<br />
Dominican Republic<br />
KETCHUP,<br />
CONDIMENTS &<br />
SAUCES<br />
FOODSERVICE<br />
1 ● 1<br />
● 1<br />
INFANT<br />
FEEDING<br />
Puerto Rico 2 ●<br />
1 <br />
Pacific Rim & Southwest Asia<br />
Australia 1 ● 1 1 1 <br />
China ● 1 <br />
India ● 2<br />
Indonesia 1 ● 2 <br />
Japan 2 ● 1 <br />
Malaysia ● 1 <br />
New Zealand 1 ● 1 1 1 <br />
Pakistan ● <br />
Papua New Guinea 1 1<br />
Philippines 1 ● <br />
Samoa ● 1<br />
Singapore 1 ● <br />
South Korea ● <br />
<br />
Sri Lanka ● 1<br />
1<br />
Taiwan ● <br />
<br />
Thailand 2 ● <br />
<br />
Europe<br />
Austria 2 ● <br />
<br />
Belgium<br />
Czech Republic<br />
Denmark<br />
Finland<br />
1<br />
<br />
1<br />
2<br />
●<br />
●<br />
●<br />
●<br />
1 <br />
<br />
<br />
<br />
<br />
<br />
<br />
<br />
<br />
<br />
France<br />
Germany<br />
2<br />
1<br />
●<br />
●<br />
2<br />
<br />
<br />
<br />
<br />
2<br />
<br />
<br />
Great Britain 1 ● 1 1 1 1 <br />
Greece 2 ●<br />
<br />
Hungary 2 ● <br />
<br />
Ireland 1 ● 1 1 1 1<br />
Italy ● 1 <br />
Malta ● 1 1<br />
<br />
Netherlands 1 ● 1<br />
<br />
Norway ● <br />
<br />
Poland 1 ● 1 & 2*<br />
<br />
Portugal 1 ● 1 2<br />
Russia ● <br />
<br />
Slovak Republic<br />
● <br />
<br />
Spain 1 ● 2<br />
Sweden 2 ● 1 <br />
Switzerland 1 ● <br />
TUNA<br />
1<br />
1<br />
<br />
FROZEN<br />
FOODS<br />
QUICK-SERVE<br />
MEALS<br />
<br />
<br />
<br />
<br />
<br />
<br />
<br />
<br />
<br />
<br />
<br />
PET FOODS<br />
(18)
k <strong>Heinz</strong>'s five fastest-growing businesses account for 65% of global sales:<br />
Fast-Growth Businesses FY00 Sales 3-yr Sales CAGR**<br />
Ketchup, condiments & sauces $1.3 billion +7.0%<br />
Foodservice 1.6 billion +7.8%<br />
Premium frozen foods 1.0 billion +12.0%<br />
Tuna 1.0 billion +5.3%<br />
Quick-serve meals 1.2 billion +5.3%<br />
**Compound Annual Growth Rate<br />
South & Central America<br />
Argentina ●<br />
<br />
Brazil ●<br />
<br />
Chile ● <br />
<br />
Colombia 2 ● 1 <br />
Costa Rica<br />
Ecuador<br />
<br />
<br />
●<br />
●<br />
<br />
2<br />
<br />
<br />
<br />
El Salvador ● 2<br />
Guatemala ● 2 <br />
Honduras 2 <br />
Mexico ●<br />
<br />
<br />
Nicaragua 2 <br />
Panama ● 2 2<br />
<br />
Paraguay ● 2<br />
Peru ● 1 2<br />
<br />
Uruguay 2 ● 1 2<br />
<br />
Venezuela 1 ● 1 <br />
1 <br />
Africa and the Middle East<br />
Botswana ● <br />
Cyprus <br />
Egypt 1 ● <br />
Ghana 1<br />
<br />
Israel 1 ● 1 1 <br />
Jordan <br />
Kenya<br />
Malawi<br />
Mozambique<br />
South Africa<br />
KETCHUP,<br />
CONDIMENTS &<br />
SAUCES<br />
<br />
<br />
Morocco 2 ● <br />
<br />
Saudi Arabia<br />
● <br />
<br />
Seychelles 1<br />
<br />
<br />
FOODSERVICE<br />
Zambia <br />
●<br />
Zimbabwe ● <br />
2 <br />
2<br />
<br />
<br />
<br />
<br />
2<br />
<br />
2<br />
Tunisia 2 ● <br />
Turkey ● <br />
<br />
*In Poland, StarKist is the number-one brand and John West is number two.<br />
INFANT<br />
FEEDING<br />
TUNA<br />
FROZEN<br />
FOODS<br />
QUICK-SERVE<br />
MEALS<br />
PET FOODS<br />
Legend<br />
Leader in market share<br />
Second in market share<br />
<strong>Heinz</strong> brands are sold in the market<br />
<strong>Heinz</strong> foodservice products hold leading share positions<br />
1<br />
2<br />
<br />
●<br />
(19)
MELBOURNE 3AM Heart-healthy tuna is<br />
a $1 billion global business, growing every<br />
year. Why? Consumers want quick,<br />
nutritious, tasty meals that can be made at<br />
home or at work. In Australia, <strong>Heinz</strong> —<br />
the top tuna with 33% of the market — sells<br />
52 varieties under the Greenseas label. Sales<br />
of flavored tunas — like lemon pepper, herb<br />
& garlic and a new honey & soy variety —<br />
grew 30% last year. Other popular Greenseas<br />
innovations include heat-and-serve tuna<br />
meals and lunch kits. In Asia, as in the U.S.<br />
and the rest of the world, consumers are<br />
embracing contemporary flavors and<br />
imaginative recipes using tuna. They’re also<br />
turning to tuna as a healthy alternative to<br />
red meat and chicken. It’s just what<br />
the doctor ordered.<br />
LIVERPOOL 5PM Sausage. Bacon. Burger.<br />
Chicken. It sounds like a meat lover’s menu,<br />
but it’s actually a list of some of the most<br />
popular items in the Linda McCartney line<br />
of vegetarian frozen ready meals. <strong>Heinz</strong><br />
acquired the brand, the United Kingdom’s<br />
best-selling vegetarian meals, and other<br />
leading food names when it bought UB<br />
Frozen and Chilled Foods.<br />
<strong>Heinz</strong> sells 22 products in the range,<br />
including chili non-carne and meatless<br />
versions of English favorites, like bangers<br />
and mash and toad-in-the-hole. Mothers<br />
buy the meals, but their biggest fans are<br />
teenage girls, who make up the largest<br />
percentage of vegetarians.<br />
(20)
PRINCE EDWARD ISLAND 1PM Pokémon has hit<br />
the world of pasta. <strong>Heinz</strong> was the first food company in<br />
Canada to launch a Pokémon product when it rolled out<br />
two varieties of Pokémon-shaped canned pasta last fall.<br />
Since then, more than 338,000 cases of Pokémon Red<br />
and Pokémon Blue have sold, making <strong>Heinz</strong> the leading<br />
brand. There’s more to come for Canadian kids.<br />
Pokémon characters like Pikachu, Charmander<br />
and Squirtle also appeared on limited-edition <strong>Heinz</strong><br />
ketchup bottles throughout North America in a<br />
promotion that offered a rebate on the purchase of<br />
Pokémon videos or DVDs.<br />
(21)
NEW YORK CITY 12 NOON Eating out. It’s one of<br />
the hottest trends in the food industry and <strong>Heinz</strong> is a<br />
true leader. More than half the food dollars in the U.S.<br />
are spent on away-from-home meals. <strong>Heinz</strong> ketchup and<br />
57 Sauce are tabletop staples, right next to the salt and<br />
pepper. In the U.S., nine out of ten restaurants serve<br />
<strong>Heinz</strong> ketchup, the lifeblood of the company’s $1.6<br />
billion global foodservice business. An updated version<br />
of the familiar icon — a forever-full, plastic bottle —<br />
ensures that you’re getting the real thing, <strong>Heinz</strong> ketchup.<br />
More people are eating out in Europe, Asia and<br />
other parts of the world, too. <strong>Heinz</strong> foodservice<br />
revenues, which make up more than 15% of the<br />
company’s sales, have grown at a 7.8% rate over the<br />
past three years.<br />
(22)
MUNICH 6PM Germans love soup, as<br />
a snack or a light meal. <strong>Heinz</strong> sells 86<br />
products in Germany under the Sonnen<br />
Bassermann name, including a wide variety<br />
of soups, stews and ready-to-serve meals.<br />
Soup has become especially popular.<br />
What’s the appeal? Soups are light,<br />
nutritious and often low fat. Founded in<br />
1884, Sonnen Bassermann is one of the<br />
oldest trademarks in the German food<br />
industry. Sonnen Bassermann also makes<br />
Germany’s favorite ready-to-serve meals.<br />
The top variety is rinderroulade, beef with<br />
cream sauce and potatoes.<br />
VANCOUVER 9AM Move over, Morris.<br />
You’re not the only kitty to love 9-Lives.<br />
There are many cats in this dog-eat-dog<br />
world — more than 6 million in Canada<br />
alone. Pet food is a big opportunity, and<br />
<strong>Heinz</strong> already is a leader, with $1.2 billion in<br />
worldwide sales. Everyone’s favorite cat,<br />
Morris, has made 9-Lives a top brand. He<br />
has reigned supreme among the feline set<br />
for more than 32 years, as the torch has<br />
been passed along to four male orange<br />
tabbies. In May, as Morris III stepped out of<br />
the Hollywood limelight to enjoy life as an<br />
everyday cat, his successor, Morris IV, was<br />
rescued from a shelter. His first Morris<br />
mission? Promoting a feline health program.<br />
(23)
BUENOS AIRES 2PM “¡Que buen perrito!” That’s<br />
“Good dog!” in Spanish. In Latin America, more and<br />
more dog owners are scrapping the table scraps and<br />
buying pet food, expanding the region’s $1.2 billion pet<br />
products market by about 8% a year. A growing<br />
awareness of the nutritional value of commercial dog<br />
food is fueling the trend. There are plenty of snouts to<br />
feed. In Argentina, about 30% of all households own a<br />
dog, compared to about 38% in the U.S. Tiernitos,<br />
which literally means “little tender,” was one of<br />
Argentina’s first dog food brands when it went on the<br />
market a decade ago. It comes in three varieties: one<br />
for puppies, an original formula, and a meat flavor.<br />
<strong>Heinz</strong> also sells pet food in Venezuela and plans to<br />
expand to Brazil — the largest Latin American market<br />
— and to Chile, Colombia and Peru.<br />
(24)
FINANCIAL TABLE OF CONTENTS<br />
26 A Year of Record Innovation and Change<br />
30 Management’s Discussion and Analysis<br />
45 Consolidated Statements of Income<br />
46 Consolidated Balance Sheets<br />
48 Consolidated Statements of Shareholders’ Equity<br />
50 Consolidated Statements of Cash Flows<br />
51 Notes to Consolidated Financial Statements<br />
71 Responsibility Statements<br />
72 Eleven-Year Summary of Operations and Other<br />
Related Data<br />
74 Directors and Officers<br />
75 World Locations<br />
77 Corporate Data<br />
(25)
A YEAR OF<br />
RECORD INNOVATION<br />
AND CHANGE<br />
In Fiscal 2000, <strong>Heinz</strong> achieved worldwide sales of<br />
$9.41 billion, as it focused on faster-growing<br />
businesses, such as foodservice and frozen food<br />
and on faster-growing global markets, such as India<br />
and Indonesia.<br />
<strong>Heinz</strong> became more customer and consumer<br />
focused, as it launched more product innovations<br />
than at any other time in its recent history.<br />
BRAND BUILDING<br />
<strong>Heinz</strong>’s sales increases were fueled by a strong<br />
performance from <strong>Heinz</strong> ketchup, the world’s<br />
favorite brand. U.S. retail sales volume of <strong>Heinz</strong><br />
ketchup rose 6.3%, as <strong>Heinz</strong> launched an awardwinning<br />
global ketchup advertising campaign<br />
aimed at teens, one of the most receptive<br />
audiences to the individuality profile of <strong>Heinz</strong><br />
ketchup. The innovative campaign positioned the<br />
icon brand as “ketchup with an attitude” through<br />
edgy, contemporary advertising. <strong>Heinz</strong> also rolled<br />
out other creative retail ketchup promotions,<br />
including humorous message labels, limited-edition<br />
Pokémon bottles and the seasonal return of the<br />
classic octagonal glass bottle in a 24-ounce size.<br />
The second quarter of Fiscal 2000 will see the<br />
most dramatic innovation in ketchup in 20 years —<br />
<strong>Heinz</strong> EZ Squirt, the first ketchup designed<br />
especially for and by kids. Enriched with Vitamin C,<br />
<strong>Heinz</strong> EZ Squirt ketchup will be available in a bold<br />
new “Blastin’ Green” color, in addition to traditional<br />
tomato red. <strong>Heinz</strong> EZ Squirt features a kid-friendly<br />
nozzle and easy-grip plastic bottle to suit smaller<br />
hands and enable kids to have more fun flavoring<br />
their favorite foods with their favorite ketchup.<br />
Overall, <strong>Heinz</strong> ketchup’s market share (in<br />
dollars) rose to 54% in the U.S. (with volume up<br />
6%) and 75% in Canada.<br />
Sales of <strong>Heinz</strong> tomato products (including soup,<br />
juice and ketchup) worldwide benefited from the<br />
public’s continuing interest in research findings on<br />
the health benefits of lycopene, an antioxidant that<br />
is more readily absorbed in the body when<br />
tomatoes are eaten cooked. With an eye on the<br />
demand for alternative products, <strong>Heinz</strong> introduced<br />
organic ketchup in Denmark and Sweden.<br />
Also in the $1.3 billion category of ketchup,<br />
condiments and sauces, sales of Diana Sauces<br />
sizzled in Canada, rising 30%, as the popular line of<br />
barbecue condiments expanded nationally. Several<br />
new varieties of <strong>Heinz</strong> HomeStyle Gravy helped<br />
drive its number-one share to 46%, with sales up<br />
6%. Three new varieties of Boston Market gravy<br />
were also introduced.<br />
Foodservice grew to a $1.6 billion global<br />
business for <strong>Heinz</strong>, increasing sales by 12.5% and<br />
becoming <strong>Heinz</strong>’s third-largest business. The<br />
company launched five Chef Francisco frozen soup<br />
varieties in the U.S. In response to demand from<br />
high-profile restaurant chains, a new 14-ounce red<br />
plastic ketchup bottle that appears full at all times<br />
was rolled out.<br />
In Europe, <strong>Heinz</strong> foodservice led the singleportion<br />
market. Foodservice sales of <strong>Heinz</strong> ketchup<br />
in Europe rose 28%, with market leadership in the<br />
U.K., Belgium, the Netherlands and France. In<br />
Spain, foodservice sales of <strong>Heinz</strong> ketchup rose 29%.<br />
<strong>Heinz</strong> Japan cooked up new products for<br />
foodservice operators, including Italian bean<br />
products and pouched soup and sauces.<br />
(26)
Sales of frozen foods climbed to $1.4 billion.<br />
One of the biggest product launches was<br />
<strong>Heinz</strong> Frozen Food Company’s<br />
introduction of Boston Market HomeStyle Meals, a<br />
line of delicious entrees, meals and side dishes with<br />
high brand recognition. Meanwhile, Weight<br />
Watchers Smart Ones entrees surged more than<br />
11% in sales, as the brand rose to the number-two<br />
position in its category.<br />
Market leader Ore-Ida french fries and potatoes<br />
were rejuvenated by the introduction across the<br />
U.S. of stand-up resealable packaging, a<br />
breakthrough in convenience and presentation.<br />
Shipments of Bagel Bites, the popular frozen<br />
pizza snack, increased 41% in the fourth quarter of<br />
Fiscal 2000 and attracted more young consumers<br />
(or “tweens”) with national advertising and a<br />
contest promoting its sponsorship of the 2000 ESPN<br />
Winter X Games. Bagel Bites also were a big<br />
success north of the border, where Canadian<br />
volume grew 107%.<br />
Global tuna and seafood sales were $1.0<br />
billion. StarKist tuna maintained its status<br />
as the number-one brand with a U.S.<br />
market share of more than 44%. StarKist’s Charlie<br />
the Tuna made waves in his return to a starring role<br />
in television commercials. Plans are underway for<br />
the spectacular launch of tuna in pouch packaging,<br />
a breakthrough <strong>Heinz</strong> development, which is<br />
expected to transform the entire category.<br />
In France, Petit Navire tuna achieved a record<br />
market share of 18.2% in the critical summer salad<br />
season. In the U.K., John West tuna set a record<br />
with a 32% share in January 2000. Seafood sales in<br />
Australia set a full-year volume record, as sales of<br />
new flavored Greenseas tuna rose.<br />
Quick-serve meals, including soup, beans and<br />
pasta, reached $1.2 billion in Fiscal 2000.<br />
In Australia, sales of Tom Piper canned meats,<br />
with a new heartier recipe, grew almost 10%.<br />
In Australia and New Zealand, baked beans and<br />
spaghetti volume more than doubled.<br />
<strong>Heinz</strong> U.K. introduced easy-open-end cans for<br />
products ranging from baked beans to soup, while<br />
preparing for the debut of microwaveable<br />
packaging in Fiscal 2000. In the U.S., College Inn<br />
broth accelerated its growth by introducing<br />
resealable cartons.<br />
British children enjoyed the taste of a new <strong>Heinz</strong><br />
pasta featuring the Tweenies, stars of a popular<br />
BBC children’s television program. Tweenies and<br />
pasta shaped to resemble icons from the Star<br />
Wars film series helped drive volume growth in<br />
the pasta shapes category to more than 59%. <strong>Heinz</strong><br />
U.K. soup reached a market share exceeding 55%.<br />
New <strong>Heinz</strong> pouch and premium ready-to-serve<br />
soups were launched in the U.K.<br />
A smashing success was the introduction of<br />
Pokémon canned pasta in Canada, where the<br />
launch vaulted <strong>Heinz</strong> to the number-one position in<br />
pasta for the first time. In Greece, four <strong>Heinz</strong><br />
convenience meals were debuted, including<br />
spaghetti hoops and macaroni & cheese.<br />
Infant feeding topped $1.0 billion in sales. In<br />
South America, <strong>Heinz</strong> Venezuela set a record for<br />
baby food sales, with a peak share of 50%,<br />
reflecting product launches and extensions.<br />
In Australia and New Zealand, <strong>Heinz</strong><br />
reintroduced its entire <strong>Heinz</strong> and Wattie’s range<br />
(27)
of wet baby foods in new packaging, resulting in<br />
double-digit sales growth, while <strong>Heinz</strong> infant<br />
formula achieved a record market share, with 58%<br />
growth in volume. In Canada, sales of <strong>Heinz</strong><br />
toddler cereal products grew 35% and jarred<br />
products climbed 19%. In Europe, the PLADA<br />
brand of infant milk rose to the top position.<br />
Pet products generated $1.2 billion in<br />
sales worldwide, as <strong>Heinz</strong> succeeded in<br />
getting sales and profits back on track.<br />
<strong>Heinz</strong> Pet Products aired television ads for its new<br />
Kibbles ‘n Bits ‘n Beefy Bits dog food. Sales volume<br />
of Kibbles ‘n Bits in Canada jumped 28%. <strong>Heinz</strong> Pet<br />
Products unveiled a number of exciting new<br />
formulations, including vitamin-enhanced 9-Lives<br />
cat food; Snausages Party Sack; and Pounce Hairball<br />
Treat-Ment, meaty-tasting treats that prevent and<br />
eliminate hairballs.<br />
PRODUCTION AND PROCUREMENT<br />
Operation Excel, the multi-year restructuring and<br />
growth initiative unveiled last year, continues to be<br />
a resounding success in focusing operations on<br />
Manufacturing Centers of Excellence in North<br />
America, Europe and Asia/Pacific.<br />
<strong>Heinz</strong> announced plans to expand its Pittsburgh<br />
factory by constructing a 70,000-square-foot<br />
warehouse and distribution center.<br />
<strong>Heinz</strong> combined its U.S. grocery and foodservice<br />
businesses at a central campus in Pittsburgh to<br />
create <strong>Heinz</strong> North America. Star-Kist Foods<br />
consolidated its western U.S. distribution<br />
operations, closing facilities in Carson and Corona,<br />
California. <strong>Heinz</strong> Pet Products announced plans to<br />
shutter its pet treat facility in El Paso, Texas and shift<br />
production to its plant in Topeka, Kansas.<br />
<strong>Heinz</strong> Frozen Food Company consolidated all<br />
Bagel Bites production to its facility in Fort Myers,<br />
Florida and added a third Bagel Bites production<br />
line there, resulting in the downsizing of its<br />
Pocatello, Idaho factory. <strong>Heinz</strong> Frozen Food also<br />
sold its facility in Bloomsburg, Pennsylvania to<br />
Windsor Quality Foods, which continues to supply<br />
frozen pasta products to <strong>Heinz</strong>.<br />
The company’s tomato processing facility in<br />
Escalon, California embarked on an expansion<br />
project to double overall capacity.<br />
In Europe, consolidation continued as <strong>Heinz</strong><br />
sold its Zabreh factory in the Czech Republic and<br />
other businesses in Kecskemet, Hungary, and<br />
closed its Redditch, England plant.<br />
In Spain, <strong>Heinz</strong> Iberica consolidated its tomato<br />
processing plants and built a modern factory at<br />
La Llanada, near Alfaro, to expand production of<br />
Orlando products including tomate frito, a popular<br />
cooking sauce.<br />
<strong>Heinz</strong> closed a tuna cannery in Eden, Australia<br />
and two New Zealand facilities, a dry pet food<br />
factory in Timaru and a frozen vegetable factory in<br />
Gisbourne. Production of <strong>Heinz</strong> ketchup began at<br />
<strong>Heinz</strong> ABC’s factory in Karawang, Indonesia.<br />
<strong>Heinz</strong> sold the non-core Weight Watchers<br />
International classroom business to Artel<br />
Luxembourg, S.A. for $735 million. The transaction<br />
did not include core Weight Watchers foods.<br />
(28)
ACQUISITIONS<br />
<strong>Heinz</strong> acquired and maintained a 19.5% stake in<br />
The Hain Celestial Group to gain a strong foothold<br />
in the fast-growing organic and nutritional market.<br />
The deal thrust <strong>Heinz</strong> into a dynamic $20 billion<br />
U.S. market for natural and organic foods that is<br />
expanding at a rate of 15–18% annually.<br />
<strong>Heinz</strong>’s worldwide foodservice business grew<br />
with the acquisitions of Thermo Pac, Inc. of Stone<br />
Mountain, Georgia; and Serv-A-Portion of<br />
Turnhout, Belgium. <strong>Heinz</strong> Foodservice expanded its<br />
U.S. business by acquiring Quality Chef Foods, Inc.,<br />
a leading manufacturer of frozen heat-and-serve<br />
soups, entrees and sauces.<br />
In Israel, <strong>Heinz</strong> acquired a 51% share of<br />
Remedia Limited, that nation’s leading producer of<br />
infant cereals and biscuits. <strong>Heinz</strong> also opened its<br />
second infant foods unit in China through a joint<br />
venture that is producing its first line of jarred baby<br />
food at a newly constructed factory in Qingdao,<br />
north of Shanghai.<br />
In the U.K., <strong>Heinz</strong> significantly expanded its<br />
European frozen foods business with the acquisition<br />
of UB Frozen and Chilled Foods from United<br />
Biscuits for more than $300 million. UB’s wellknown<br />
products include San Marco pizzas and the<br />
Linda McCartney brand of vegetarian products.<br />
<strong>Heinz</strong> expanded in the fast-growing market for<br />
Asian sauces by acquiring Yoshida’s North America<br />
brand, whose annual sales top $20 million.<br />
<strong>Heinz</strong> formed a joint venture with Nutri Asia of<br />
Manila to become the leading ketchup company<br />
in the Philippines. The unit is aptly named <strong>Heinz</strong><br />
UFC Philippines.<br />
PUBLIC SERVICE<br />
Continuing its enduring commitment to public<br />
service, the H.J. <strong>Heinz</strong> Company Foundation<br />
awarded $6 million in grants to 990 organizations<br />
during Fiscal 2000. <strong>Heinz</strong> affiliates and employees<br />
worldwide also made community service part of<br />
their mission.<br />
In the U.S., <strong>Heinz</strong> sponsored a special radio<br />
broadcast of the 111th Tournament of Roses Parade<br />
for the blind and visually impaired. Employees of<br />
<strong>Heinz</strong> Pet Products organized a food drive to<br />
assist tornado victims in Oklahoma. <strong>Heinz</strong> awarded<br />
a $2 million grant to the North Side Leadership<br />
Conference in Pittsburgh to enhance the<br />
community and provide employment and<br />
education programs for local residents.<br />
In Canada, <strong>Heinz</strong> donated more than<br />
$250,000 to children’s hospital foundations —<br />
10 cents for every <strong>Heinz</strong> infant cereal or baby<br />
food label collected. <strong>Heinz</strong> also co-sponsored a<br />
Canadian symposium on the role of nutrition in<br />
prostate cancer prevention.<br />
In Venezuela, <strong>Heinz</strong> aided mud slide victims by<br />
donating food and also contributed to a public<br />
children’s hospital through a program called<br />
“Operation Love.” In Australia, <strong>Heinz</strong> launched a<br />
new community support program. Tegel Foods<br />
helped educate New Zealand students and the<br />
public about safe handling of chicken. <strong>Heinz</strong> and<br />
Brother’s Brother Foundation joined to supply<br />
school textbooks to students in Ghana.<br />
(29)
MANAGEMENT’S DISCUSSION AND ANALYSIS<br />
H.J. <strong>Heinz</strong> Company and Subsidiaries<br />
OPERATION EXCEL<br />
Background<br />
In Fiscal 1999, the company announced a transformative growth and restructuring initiative<br />
that is expected to generate approximately $240 million in annual pretax savings upon full<br />
implementation and growth in earnings per share of 10 to 12 percent per year, on average.<br />
The initiative, named ‘‘Operation Excel,’’ is a multi-year, multi-faceted program that will result<br />
in restructuring charges and implementation costs of approximately $1.1 billion. The company<br />
anticipates that substantially all restructuring charges and implementation costs will be<br />
recognized by the end of Fiscal 2001.<br />
The major components of Operation Excel include: creating manufacturing centers of<br />
excellence, focusing the product portfolio, realigning the company’s management teams and<br />
investing in growth initiatives.<br />
Creating manufacturing centers of excellence is resulting in significant changes to the<br />
company’s manufacturing footprint including the following initiatives:<br />
Closing the Harlesden factory in London, England and focusing the Kitt Green factory in<br />
Wigan, England on canned beans, soups and pasta production and focusing the Elst factory<br />
in the Netherlands on tomato ketchup and sauces<br />
Downsizing the Puerto Rico tuna processing facility and focusing this facility on lower<br />
volume/higher margin products (completed in Fiscal 2000)<br />
Focusing the Pittsburgh, Pennsylvania factory on soup and baby food production and<br />
shifting other production to existing facilities<br />
Consolidating manufacturing capacity in the Asia/Pacific region<br />
Closing the Zabreh, Czech Republic factory and disposing of the Czech dairy business<br />
and transferring the infant formula business to the Kendal, England factory (completed in<br />
Fiscal 2000)<br />
Downsizing the Pocatello, Idaho factory by shifting Bagel Bites production to the Ft. Myers,<br />
Florida factory, and shifting certain Smart Ones entrée production to the Massillon, Ohio<br />
factory (completed in Fiscal 2000)<br />
Closing the Redditch, England factory and shifting production to the Telford, England<br />
factory and the Turnhout factory in Belgium (completed in Fiscal 2000)<br />
Closing the El Paso, Texas pet treat facility and consolidating production in the Topeka,<br />
Kansas factory<br />
Disposing of the Bloomsburg, Pennsylvania frozen pasta factory (completed in Fiscal 2000).<br />
The company is focusing the portfolio of product lines on six core food categories: ketchup,<br />
condiments and sauces; frozen foods; tuna; soups, beans and pasta meals; infant foods; and<br />
pet products. A consequence of this focus on the core categories was the sale of the Weight<br />
Watchers classroom business in Fiscal 2000. Additionally, seven other smaller businesses,<br />
which have combined annual revenues of approximately $80 million, are being disposed.<br />
(30)
Realigning the company’s management teams will provide processing and product<br />
expertise across the regions of North America, Europe and Asia/Pacific. Specifically,<br />
Operation Excel includes:<br />
Creating a single U.S. frozen food headquarters, resulting in the closure of the company’s<br />
Ore-Ida head office in Boise, Idaho (completed in Fiscal 2000)<br />
Consolidating many European administrative support functions<br />
Creating a single North American Grocery & Foodservice headquarters in Pittsburgh,<br />
Pennsylvania, resulting in the relocation of the company’s domestic seafood and pet food<br />
headquarters from Newport, Kentucky<br />
Creating two Asia/Pacific management teams with headquarters in Melbourne (for the<br />
Australian, New Zealand and Japanese businesses) and Singapore (for all other Asian<br />
businesses).<br />
Growth initiatives include relaunching many of our core brands and additional investments<br />
in marketing and pricing programs for our core businesses, particularly in ketchup, condiments<br />
and sauces, frozen foods, infant foods and tuna.<br />
The initiatives will result in the closure or exit of 21 factories or businesses. Management<br />
estimates that these actions will impact approximately 6,000 employees with a net reduction<br />
in the workforce of approximately 4,600, after expansion of certain facilities.<br />
The pretax savings generated from all Operation Excel initiatives was $70.0 million in Fiscal<br />
2000 and is projected to grow to $145 million in Fiscal 2001 and $215 million in Fiscal 2002,<br />
with non-cash savings of $15 million or less in any year.<br />
Successful execution of Operation Excel will help the company achieve the following<br />
targets over the next three years:<br />
$240 million in annual ongoing pretax savings upon full implementation<br />
Earnings per share growth of 10 to 12 percent per year on average<br />
Sales growth of 4 to 5 percent per year on average<br />
Gross margins of 42%<br />
Return on invested capital of 40%<br />
$2.5 billion of free cash flow.<br />
Operation Excel Status Update<br />
During Fiscal 2000, the company recognized net restructuring charges and implementation<br />
costs totaling $392.7 million pretax ($0.74 per share). [Note: All earnings per share amounts<br />
included in Management’s Discussion and Analysis are presented on an after-tax diluted basis.]<br />
Pretax charges of $170.4 million were classified as cost of products sold and $222.3 million<br />
as selling, general and administrative expenses (‘‘SG&A’’). During Fiscal 1999, the company<br />
recognized restructuring charges and implementation costs totaling $552.8 million pretax<br />
($1.11 per share). Pretax charges of $396.4 million were classified as cost of products sold and<br />
$156.4 million as SG&A.<br />
Included in the $392.7 million of net restructuring and implementation costs recognized<br />
in Fiscal 2000 is a reversal of $18.2 million pretax of Fiscal 1999 restructuring accruals (exit<br />
costs, $0.4 million and severance costs, $1.3 million) and asset write-downs ($16.5 million),<br />
primarily for the closure of the West Chester, Pennsylvania facility, which will now remain<br />
in operation as a result of the sale of the Bloomsburg facility in April of Fiscal 2000.<br />
In Fiscal 2000, 11 factories and four businesses were sold or closed including those located<br />
in England, Hungary, the Czech Republic, New Zealand and the U.S., resulting in a net<br />
reduction of the company’s workforce of approximately 3,000 employees. During Fiscal 1999,<br />
(31)
the company’s workforce was reduced by approximately 200 employees, principally through<br />
the closure of Ore-Ida’s Boise head office and through the divestiture of the Clarksville,<br />
Arkansas sweet potato business.<br />
Pretax savings totaled approximately $70 million ($10 million non-cash) in Fiscal 2000<br />
resulting principally from the plant closures, administrative reductions and factory downsizings.<br />
Capital expenditures related to the restructuring totaled $173.6 million in Fiscal 2000 and<br />
$5.8 million in Fiscal 1999 and related principally to new equipment resulting from creating<br />
manufacturing centers of excellence.<br />
The company expects to incur approximately $150 million of additional implementation<br />
costs in Fiscal 2001. Implementation costs consist of incremental costs directly related to the<br />
implementation of Operation Excel, including consulting fees, employee relocation costs,<br />
unaccruable severance costs associated with terminated employees, training costs, equipment<br />
relocation costs and commissioning costs.<br />
PROJECT MILLENNIA<br />
During the fourth quarter of Fiscal 1997, the company announced a reorganization and<br />
restructuring program named ‘‘Project Millennia,’’ which resulted in a total cost of approximately<br />
$750 million over three years. The reorganization plan was designed to strengthen the<br />
company’s core businesses and improve profitability and global growth. Key initiatives were<br />
focused on process changes and product line rationalizations.<br />
The company has completed Project Millennia. During Fiscal 2000, the company utilized<br />
$19.6 million of severance and exit accruals. The utilization of the accruals related principally to<br />
the closure of a tuna processing facility in Australia, the closure of a tomato processing facility<br />
in Spain and costs associated with contractual lease commitments of the U.S. Weight Watchers<br />
classroom business, which were transferred to the buyer of the classroom business.<br />
As of May 3, 2000, the company has closed or divested all of the 25 plants that were<br />
scheduled for closure or divestiture. Project Millennia has resulted in a net workforce reduction<br />
of 2,250 employees.<br />
The financial goals of the project have been achieved as follows:<br />
Pretax savings in excess of $200 million, of which $10 million were non-cash savings, were<br />
realized in Fiscal 2000<br />
Gross profit margins, excluding restructuring related items, increased to 40.3% in Fiscal 1999<br />
Operating working capital was reduced by approximately $350 million in the first year of<br />
the program<br />
More than $1.3 billion of free cash flow was generated in the first year of the program.<br />
As of May 3, 2000, there are $0.5 million of remaining Project Millennia accruals. These<br />
accruals relate to contractual lease commitments in the U.S.<br />
RESULTS OF OPERATIONS<br />
2000 versus 1999: Sales for Fiscal 2000 increased $108.3 million, or 1.2%, to $9.41 billion from<br />
$9.30 billion in Fiscal 1999. Volume increased sales by $349.7 million, or 3.8%, and acquisitions<br />
increased sales by $438.2 million, or 4.7%. Divestitures reduced sales by $407.4 million, or<br />
4.4%, lower pricing reduced sales by $161.2 million, or 1.7%, and the unfavorable impact of<br />
foreign exchange translation rates reduced sales by $111.0 million, or 1.2%. Domestic operations<br />
contributed approximately 52% of consolidated sales in Fiscal 2000 and 53% in Fiscal 1999.<br />
(32)
Sales of the North American Grocery & Foodservice segment increased $61.4 million,<br />
or 1.5%. Sales volume increased 3.1%, due to increases in ketchup, condiments and sauces,<br />
foodservice, tuna and canned soup, partially offset by a decrease in canned pet food.<br />
Acquisitions, net of divestitures, increased sales 0.4%, and a stronger Canadian dollar<br />
increased sales 0.3%. Lower pricing reduced sales by 2.3%, due mainly to decreases in tuna<br />
and retail ketchup.<br />
The North American Frozen segment’s sales increased $9.5 million, or 0.9%. Sales volume<br />
increased 5.9%, driven by Smart Ones frozen entrées, Boston Market frozen meals and<br />
Bagel Bites snacks, partially offset by a decrease in The Budget Gourmet line of frozen entrées.<br />
The divestiture of several non-core product lines, net of acquisitions, reduced sales 3.4%.<br />
Lower pricing reduced sales 1.6%, primarily due to frozen potatoes.<br />
Sales in Europe increased $123.0 million, or 5.0%. Acquisitions, net of divestitures, increased<br />
sales 8.6%, due primarily to the acquisitions of United Biscuit’s European Frozen and Chilled<br />
Division, Remedia Limited (infant feeding), Sonnen Bassermann (convenience meals) and<br />
Serv-A-Portion (foodservice). Sales volume increased 3.4%, due to increases in tuna, infant<br />
foods and ketchup, condiments and sauces. The unfavorable impact of foreign exchange<br />
translation rates reduced sales 5.8% and lower pricing, primarily in tuna, reduced sales 1.2%.<br />
Sales in Asia/Pacific increased $184.3 million, or 18.2%. Acquisitions, primarily ABC Sauces<br />
in Indonesia, increased sales 11.8%. Sales volume increased 4.5%, due to increases in infant<br />
foods, poultry and convenience meals. The favorable impact of foreign exchange translation<br />
rates increased sales 2.4%, primarily due to sales in Japan. Lower pricing reduced sales 0.5%.<br />
Sales of Other Operating Entities decreased $269.9 million, or 36.0%. Divestitures reduced<br />
sales 38.0%, primarily due to the second quarter divestiture of the Weight Watchers classroom<br />
business and the Fiscal 1999 divestiture of the bakery products unit. Lower pricing<br />
reduced sales 1.9% and foreign exchange translation rates reduced sales 0.6%. Sales volume<br />
increased 4.5%.<br />
The current year was favorably impacted by a number of special items which net to<br />
$40.1 million pretax ($0.10 per share), and are summarized in the tables below. During the<br />
second quarter of Fiscal 2000, the company completed the sale of the Weight Watchers<br />
classroom business for a pretax gain of $464.6 million ($0.72 per share). The company used part<br />
of this gain to fund a pretax contribution of $30.0 million ($0.05 per share) to the H.J. <strong>Heinz</strong><br />
Company Foundation. Fiscal 2000 results also include Operation Excel implementation costs<br />
of $216.5 million pretax ($0.41 per share), additional Operation Excel restructuring charges of<br />
$194.5 million pretax ($0.37 per share) and a reversal of $18.2 million pretax ($0.04 per share)<br />
of Fiscal 1999 restructuring accruals and asset write-downs. In April of 1999, the company<br />
became aware of operational and accounting irregularities in its Ecuador tuna processing<br />
facility and expensed $10.0 million as an estimate of the losses. In the first quarter of Fiscal<br />
2000, the company recognized an additional $20.0 million pretax ($0.05 per share) of expenses<br />
related to this facility. In addition, the company recognized, in Other Income, a pretax gain<br />
of $18.2 million ($0.03 per share) for the sale of an office building in the U.K. Last year’s results<br />
included the reversal of unutilized Project Millennia accruals of $25.7 million pretax ($0.04<br />
per share), Project Millennia implementation costs of $22.3 million pretax ($0.04 per share),<br />
Operation Excel restructuring and implementation costs of $552.8 million pretax ($1.11 per<br />
share) and a pretax gain of $5.7 million from the sale of the bakery products unit.<br />
(33)
The following tables provide a comparison of the company’s reported results and the results<br />
excluding special items for Fiscal 2000 and Fiscal 1999.<br />
Fiscal Year (53 Weeks) Ended May 3, 2000<br />
(Dollars in millions, except per share amounts)<br />
Gross<br />
Profit<br />
Operating<br />
Income Net Income Per Share<br />
Reported results $3,619.4 $1,733.1 $ 890.6 $ 2.47<br />
Operation Excel restructuring 107.7 194.5 134.4 0.37<br />
Operation Excel implementation costs 79.2 216.5 145.9 0.41<br />
Operation Excel reversal (16.4) (18.2) (12.9) (0.04)<br />
Ecuador expenses 20.0 20.0 20.0 0.05<br />
Gain on U.K. building sale – – (11.8) (0.03)<br />
Foundation contribution – 30.0 18.9 0.05<br />
Gain on sale of Weight Watchers classroom business – (464.6) (259.7) (0.72)<br />
Results excluding special items $3,809.9 $1,711.2 $ 925.3 $ 2.57<br />
Fiscal Year (52 Weeks) Ended April 28, 1999<br />
(Dollars in millions, except per share amounts)<br />
Gross<br />
Profit<br />
Operating<br />
Income Net Income Per Share<br />
Reported results $3,354.7 $1,109.3 $474.3 $ 1.29<br />
Operation Excel restructuring and implementation costs 396.4 552.8 409.7 1.11<br />
Project Millennia implementation costs 14.7 22.3 14.3 0.04<br />
Project Millennia reversal (20.7) (25.7) (16.4) (0.04)<br />
(Gain)/loss on sale of bakery products unit – (5.7) 0.6 –<br />
Results excluding special items $3,745.1 $1,653.0 $882.4 $ 2.40<br />
(Note: Totals may not add due to rounding.)<br />
Gross profit increased $264.7 million to $3.62 billion from $3.35 billion in Fiscal 1999.<br />
The gross profit margin increased to 38.5% from 36.1%. Excluding the special items identified<br />
above, gross profit increased $64.7 million, or 1.7%, to $3.81 billion from $3.75 billion and<br />
the gross profit margin increased to 40.5% from 40.3%. Gross profit for the North American<br />
Grocery & Foodservice segment increased $52.5 million, or 3.4%, due to increases at <strong>Heinz</strong><br />
U.S.A. and <strong>Heinz</strong> Canada, partially offset by a significant decrease in the selling price of tuna<br />
at Star-Kist. North American Frozen’s gross profit decreased slightly $2.0 million, or 0.4%,<br />
as increased sales volume was offset by lower pricing and the elimination of several non-core<br />
product lines. Europe’s gross profit increased $62.0 million, or 6.1%, due primarily to a<br />
favorable profit mix, and the acquisitions of United Biscuit’s European Frozen and Chilled<br />
Division, Remedia Limited, Sonnen Bassermann and Serv-A-Portion. The unfavorable<br />
impact of foreign exchange translation rates reduced Europe’s gross profit by approximately<br />
$65 million. The Asia/Pacific segment’s gross profit increased $84.4 million, or 23.4%, driven<br />
by the acquisition of ABC Sauces in Indonesia, improved performances throughout the<br />
segment, and the favorable impact of foreign exchange translation rates in Japan. Other<br />
Operating Entities’ gross profit decreased $130.4 million, or 40.6%, due primarily to the second<br />
quarter divestiture of the Weight Watchers classroom business and the Fiscal 1999 divestiture<br />
of the bakery products unit.<br />
SG&A increased $105.5 million to $2.35 billion from $2.25 billion and increased as a<br />
percentage of sales to 25.0% from 24.1%. Excluding the special items identified above, SG&A<br />
increased $6.5 million to $2.10 billion from $2.09 billion and decreased as a percentage of sales<br />
to 22.3% from 22.5%. Increased selling and distribution expenses, primarily in Asia/Pacific and<br />
Europe, resulting from acquisitions, were offset by decreases in marketing and general and<br />
(34)
administrative expenses. Marketing decreased $11.2 million, or 1.3%, primarily due to the<br />
second quarter divestiture of the Weight Watchers classroom business. Excluding the Weight<br />
Watchers classroom business, marketing expense increased 6.5%. Marketing increases were<br />
noted in all major segments.<br />
Total marketing support (including trade and consumer promotions and media) increased<br />
6.6% to $2.37 billion from $2.22 billion on a sales increase of 1.2%. Excluding the Weight<br />
Watchers classroom business, total marketing support increased 9.6%. Advertising costs in<br />
Fiscal 2000 were $374.0 million compared to $373.9 million in Fiscal 1999. Excluding the<br />
Weight Watchers classroom business in both periods, advertising costs increased 9.3%.<br />
Operating income increased $623.8 million, or 56.2%, to $1.73 billion from $1.11 billion last<br />
year. Excluding the special items identified above, operating income increased $58.2 million,<br />
or 3.5%, to $1.71 billion from $1.65 billion last year. Removing the impact of the Weight Watchers<br />
classroom business in both periods, operating income increased 6.6%. Domestic operations<br />
provided approximately 59% and 57% of operating income in Fiscal 2000 and Fiscal 1999,<br />
respectively. Excluding the special items in both years, domestic operations provided<br />
approximately 54% and 55% of operating income in Fiscal 2000 and Fiscal 1999, respectively.<br />
The North American Grocery & Foodservice segment’s operating income decreased<br />
$22.5 million, or 3.1%, to $694.4 million from $717.0 million last year. Excluding the special<br />
items noted above (see Note 14 to the Consolidated Financial Statements), operating income<br />
increased $40.6 million, or 4.9%, to $875.3 million from $834.6 million last year. The strong<br />
performance of <strong>Heinz</strong> U.S.A., improvements in <strong>Heinz</strong> Canada and the pet food business<br />
and savings from Operation Excel were partially offset by a significant decrease in the selling<br />
price of tuna at Star-Kist.<br />
The North American Frozen segment’s operating income increased $71.8 million to<br />
$152.0 million from $80.2 million last year. Excluding the special items noted above (see<br />
Note 14 to the Consolidated Financial Statements), operating income decreased $1.9 million,<br />
or 1.0%, to $181.5 million from $183.4 million last year. This decrease is attributable to higher<br />
marketing expenses as a result of the national campaign in support of Boston Market and<br />
lower pricing on Ore-Ida frozen potatoes, offset by a reduction in SG&A resulting from the<br />
domestic consolidation of the frozen business as part of Operation Excel.<br />
Europe’s operating income increased $118.0 million, or 47.9%, to $364.2 million from<br />
$246.2 million. Excluding the special items noted above (see Note 14 to the Consolidated<br />
Financial Statements), operating income increased $35.1 million, or 7.5%, to $502.3 million<br />
from $467.2 million last year, due primarily to a favorable profit mix, savings from Operation<br />
Excel and the acquisitions of United Biscuit’s European Frozen and Chilled Division, Remedia<br />
Limited and Serv-A-Portion. The unfavorable impact of foreign exchange translation rates<br />
reduced Europe’s operating income by approximately $26 million.<br />
Asia/Pacific’s operating income increased $34.3 million, or 38.2%, to $124.1 million<br />
from $89.8 million last year. Excluding the special items noted above (see Note 14 to the<br />
Consolidated Financial Statements), operating income increased $31.8 million, or 21.8%, to<br />
$177.5 million from $145.7 million last year. This increase is attributable to the acquisition of<br />
ABC Sauces in Indonesia and solid performances from Japan, India and the poultry business.<br />
Other Operating Entities reported an increase in operating income of $444.4 million<br />
to $540.2 million from $95.7 million last year. Excluding the special items noted above (see<br />
Note 14 to the Consolidated Financial Statements), operating income decreased $44.9 million,<br />
or 36.9% to $77.0 million from $122.0 million last year. This decrease is primarily attributable<br />
to the second quarter divestiture of the Weight Watchers classroom business.<br />
(35)
Other expenses, net totaled $269.4 million compared to $274.2 million last year. The<br />
decrease is primarily due to a gain on the sale of an office building in the U.K. of $18.2 million<br />
pretax ($0.03 per share) partially offset by an increase in interest expense resulting from higher<br />
average borrowings and interest rates.<br />
The effective tax rate for Fiscal 2000 was 39.2% compared to 43.2% last year. The Fiscal<br />
2000 effective tax rate was unfavorably impacted by the excess of basis in assets for financial<br />
reporting over the tax basis of assets included in the Weight Watchers sale and by gains<br />
in higher taxed states related to the sale. The Fiscal 2000 and 1999 effective tax rates were<br />
unfavorably impacted by restructuring and implementation costs expected to be realized<br />
in lower tax rate jurisdictions and by nondeductible expenses related to the restructuring.<br />
Excluding the special items identified in the tables above, the effective tax rate for Fiscal 2000<br />
was 35.0% compared to 36.0% last year.<br />
Net income increased $416.2 million to $890.6 million from $474.3 million last year and<br />
earnings per share increased to $2.47 from $1.29. Excluding the special items noted above,<br />
net income increased 4.9% to $925.3 million from $882.4 million, and earnings per share<br />
increased 7.1% to $2.57 from $2.40 last year. Removing the impact of the Weight Watchers<br />
classroom business in both years, earnings per share increased 9.6% and net income<br />
increased 7.1%.<br />
The impact of fluctuating exchange rates for Fiscal 2000 remained relatively consistent<br />
on a line-by-line basis throughout the Consolidated Statement of Income.<br />
1999 versus 1998: Sales for Fiscal 1999 increased $90.3 million, or 1.0%, to $9.30 billion from<br />
$9.21 billion in Fiscal 1998. Volume increased sales by $290.2 million, or 3.2%, acquisitions<br />
increased sales by $188.2 million, or 2.0%, and favorable pricing contributed $34.8 million,<br />
or 0.4%. The unfavorable impact of foreign exchange translation rates reduced sales by<br />
$210.3 million, or 2.3%, and divestitures decreased sales by $212.6 million, or 2.3%. Domestic<br />
operations contributed approximately 53% of consolidated sales in both Fiscal 1999 and<br />
Fiscal 1998.<br />
Sales of the North American Grocery & Foodservice segment increased $127.4 million, or<br />
3.2%, primarily due to sales volume increases of $156.6 million, or 4.0%. Volume increases in<br />
<strong>Heinz</strong> ketchup, seafood and condiments were partially offset by a volume decrease in canned<br />
dog food. Acquisitions, net of divestitures, contributed $36.9 million, or 0.9%, to the sales<br />
increase, primarily due to the acquisition of the College Inn brand of canned broths. These<br />
increases were partially offset by unfavorable pricing of $36.1 million, or 0.9%. Price decreases<br />
were noted in seafood and pet food. The unfavorable fluctuation of the Canadian dollar<br />
caused a $30.0 million, or 0.8%, decrease in net sales.<br />
The North American Frozen segment’s sales decreased $61.7 million, or 5.7%. Divestitures,<br />
net of acquisitions, accounted for $71.2 million, or 6.6%, of the decrease, primarily due to<br />
the divestiture of the Ore-Ida frozen foodservice business in the first quarter of Fiscal 1998.<br />
Price decreases, primarily in frozen potatoes, contributed $13.5 million, or 1.2%, to the sales<br />
decrease. Volume increases of $23.0 million, or 2.1%, were largely due to Smart Ones frozen<br />
entrées, partially offset by decreased volume in appetizers.<br />
Sales in Europe increased $128.1 million, or 5.5%, primarily due to acquisitions, which<br />
contributed $94.2 million, or 4.0%. Acquisitions impacting the year-to-year sales dollar<br />
comparison include the Fiscal 1998 acquisition of John West Foods Limited in the U.K. and<br />
the Fiscal 1999 acquisition of the convenience meals business of Sonnen Bassermann in<br />
(36)
Germany and other smaller acquisitions. Exchange rates had a favorable impact of $21.0 million,<br />
or 0.9%, primarily in Italy. Favorable pricing increased sales by $13.5 million, or 0.6%, while<br />
sales volume was flat.<br />
Sales in Asia/Pacific decreased $61.1 million, or 5.7%. The unfavorable impact of foreign<br />
exchange translation rates reduced sales by $128.1 million, or 11.9%, primarily due to sales in<br />
New Zealand, Australia, South Korea and India. This decrease was partially offset by favorable<br />
volume of $33.8 million, or 3.1%, and favorable price of $21.2 million, or 2.0%. Acquisitions<br />
also contributed $12.0 million, or 1.1%.<br />
Sales of Other Operating Entities decreased $42.4 million, or 5.3%. Divestitures, primarily<br />
the bakery products unit, decreased sales by $122.5 million, or 15.5%. The unfavorable impact<br />
of foreign exchange translation rates decreased sales by $73.1 million, or 9.2%, principally<br />
in Africa. These decreases were partially offset by volume increases of $77.4 million, or<br />
9.8%, largely due to the Weight Watchers classroom business. In addition, price increases<br />
contributed $49.6 million, or 6.3%, and acquisitions, primarily in South Africa, contributed<br />
$26.2 million, or 3.3%, to sales.<br />
The following tables provide a comparison of the company’s reported results and the results<br />
excluding special items for Fiscal 1999 and Fiscal 1998.<br />
Fiscal Year (52 Weeks) Ended April 28, 1999<br />
(Dollars in millions, except per share amounts)<br />
Gross<br />
Profit<br />
Operating<br />
Income Net Income Per Share<br />
Reported results $3,354.7 $1,109.3 $474.3 $ 1.29<br />
Operation Excel restructuring and implementation costs 396.4 552.8 409.7 1.11<br />
Project Millennia implementation costs 14.7 22.3 14.3 0.04<br />
Project Millennia reversal (20.7) (25.7) (16.4) (0.04)<br />
(Gain)/loss on sale of bakery products unit – (5.7) 0.6 –<br />
Results excluding special items $3,745.1 $1,653.0 $882.4 $ 2.40<br />
Fiscal Year (52 Weeks) Ended April 29, 1998<br />
(Dollars in millions, except per share amounts)<br />
Gross<br />
Profit<br />
Operating<br />
Income Net Income Per Share<br />
Reported results $3,498.1 $1,520.3 $801.6 $ 2.15<br />
Gain on sale of Ore-Ida frozen foodservice business – (96.6) (53.1) (0.14)<br />
Project Millennia implementation costs 35.7 84.1 53.0 0.14<br />
Results excluding special items $3,533.8 $1,507.9 $801.4 $ 2.15<br />
(Note: Totals may not add due to rounding.)<br />
Gross profit decreased $143.3 million to $3.35 billion from $3.50 billion in Fiscal 1998. The gross<br />
profit margin decreased to 36.1% from 38.0%. Excluding the special items identified above,<br />
gross profit would have increased $211.4 million, or 6.0%, to $3.75 billion from $3.53 billion<br />
and the gross profit margin would have increased to 40.3% from 38.4%. Europe accounted<br />
for $156.5 million of this increase due to improvements in the baby food business in Italy,<br />
the favorable impact of foreign exchange translation rates and acquisitions. North American<br />
Grocery & Foodservice segment’s gross profit increased $56.7 million due to cost savings<br />
from Project Millennia, stronger sales volume and acquisitions, partially offset by the<br />
disappointing performance of the domestic pet food business. Other Operating Entities’ gross<br />
profit increased $41.5 million due to improvements in the Weight Watchers classroom business,<br />
attributable to the Weight Watchers 123 Success Plan. North American Frozen’s gross profit<br />
decrease of $24.0 million was due to the divestiture of the Ore-Ida frozen foodservice business<br />
(37)
in Fiscal 1998 and increased competitive activities for frozen potatoes, partially offset by<br />
the strong performance of Smart Ones frozen entrées. The Asia/Pacific segment’s gross<br />
profit decreased $20.6 million, or 5.4%; however, excluding the unfavorable impact of foreign<br />
exchange translation rates ($47.6 million), primarily in New Zealand and Australia, gross<br />
profit increased $27.0 million, or 7.1%.<br />
SG&A increased $267.7 million to $2.25 billion from $1.98 billion and increased as a<br />
percentage of sales to 24.1% from 21.5%. Excluding special items identified above, SG&A<br />
increased $66.2 million to $2.09 billion from $2.03 billion and increased as a percentage<br />
of sales to 22.5% from 22.0%. Marketing increases were noted in the North American Grocery<br />
& Foodservice segment primarily due to a focus on <strong>Heinz</strong> ketchup and in Europe where the<br />
company aggressively promoted ketchup and beans. These increases were partially offset by<br />
decreased marketing expense in the North American Frozen segment as a result of establishing<br />
low everyday list prices for The Budget Gourmet line of frozen entrées. Excluding marketing,<br />
SG&A was stable as a percentage of sales year-on-year.<br />
Total marketing support (including trade and consumer promotions and media) increased<br />
8.4% to $2.22 billion from $2.05 billion on a sales increase of 1.0%. Advertising costs to support<br />
the company’s key brands increased 3.0% to $373.9 million in Fiscal 1999 from $363.1 million<br />
in Fiscal 1998.<br />
Operating income decreased $411.0 million, or 27.0%, to $1.11 billion from $1.52 billion<br />
reported in Fiscal 1998. Excluding the special items in both years, operating income increased<br />
$145.2 million, or 9.6%, to $1.65 billion from $1.51 billion in Fiscal 1998. This increase was<br />
primarily due to the increase in gross profit, partially offset by increased marketing and selling<br />
and distribution costs. Domestic operations provided approximately 57% and 59% of operating<br />
income in Fiscal 1999 and Fiscal 1998, respectively. Excluding the special items in both years,<br />
domestic operations provided approximately 55% and 57% of operating income in Fiscal 1999<br />
and Fiscal 1998, respectively.<br />
The North American Grocery & Foodservice segment’s operating income decreased<br />
$80.2 million, or 10.1%, to $717.0 million from $797.2 million in Fiscal 1998. Excluding<br />
the special items in both years (see Note 14 to the Consolidated Financial Statements),<br />
this segment’s operating income increased $8.6 million, or 1.0%, to $834.6 million from<br />
$826.0 million. Excluding the results of the domestic pet food business, the North American<br />
Grocery & Foodservice segment experienced double-digit operating income growth due<br />
to strong sales volume and acquisitions, primarily the College Inn brand of canned broths,<br />
as well as cost savings from Project Millennia. The domestic pet food business was negatively<br />
impacted by higher costs associated with the introduction of the 9-Lives four pack, an<br />
unfavorable mix shift, significant volume declines in canned dog food and ineffective trade<br />
spending, all of which the company has aggressively worked to correct.<br />
The North American Frozen segment reported $80.2 million of operating income in Fiscal<br />
1999 versus $258.2 million in Fiscal 1998. Excluding special items in both years (see Note 14<br />
to the Consolidated Financial Statements), operating income increased $12.7 million, or 7.4%,<br />
to $183.4 million from $170.7 million. The increase is primarily due to favorable operating<br />
results of the Smart Ones frozen entrée line; partially offset by the retail frozen potato business,<br />
where prices have been reduced in order to recapture market share.<br />
Europe’s operating income decreased $140.7 million, or 36.4%, to $246.2 million from<br />
$386.9 million. Excluding special items in both years (see Note 14 to the Consolidated Financial<br />
Statements), operating income increased $61.7 million, or 15.2%, to $467.2 million from<br />
$405.4 million. This increase was primarily due to favorable operating results in the U.K. and<br />
Italy due to increased sales prices and acquisitions, partially offset by increased marketing<br />
spending described above.<br />
(38)
Asia/Pacific’s operating income decreased $46.7 million, or 34.2%, to $89.8 million from<br />
$136.5 million. Excluding special items in both years (see Note 14 to the Consolidated Financial<br />
Statements), operating income increased $3.3 million to $145.7 million from $142.3 million<br />
in Fiscal 1998. Strong performances in all of the company’s Asia/Pacific businesses more than<br />
offset the unfavorable impact of foreign exchange translation rates, which reduced operating<br />
income by approximately $19.5 million.<br />
Other Operating Entities reported an increase in operating income of $42.0 million to<br />
$95.7 million from $53.7 million. Excluding special items in both years (see Note 14 to the<br />
Consolidated Financial Statements), operating income increased $58.4 million, or 91.8%, to<br />
$122.0 million from $63.6 million. The increase is primarily due to the exceptional performance<br />
of the Weight Watchers 123 Success Plan. The unfavorable fluctuation of foreign exchange<br />
translation rates, primarily in Africa, caused a $12.5 million decrease in operating income.<br />
Other income and expenses totaled $274.2 million in Fiscal 1999 compared to $265.3 million<br />
in Fiscal 1998. Interest expense was relatively flat year-on-year as the increase in average<br />
borrowings was offset by lower interest rates. Interest income decreased $7.6 million, or 23.2%,<br />
to $25.1 million from $32.7 million due to decreased invested funds and significantly lower<br />
interest rates on investments, primarily in Italy.<br />
The effective tax rate for Fiscal 1999 was 43.2% compared to 36.1% in Fiscal 1998. The Fiscal<br />
1999 higher rate includes the impact of restructuring expenses in lower tax rate jurisdictions<br />
and nondeductible expenses related to the restructuring. Excluding the special items noted<br />
above, the effective rate for Fiscal 1999 was 36.0% compared to 35.5% in Fiscal 1998. The Fiscal<br />
1998 effective tax rate reflects the benefits of tax legislation in Italy and the U.K. (See Note 5 to<br />
the Consolidated Financial Statements.)<br />
Net income decreased $327.2 million to $474.3 million from $801.6 million in Fiscal 1998<br />
and earnings per share decreased to $1.29 from $2.15. Excluding the special items discussed<br />
above, net income increased $81.0 million, or 10.1%, to $882.4 million in Fiscal 1999 from<br />
$801.4 million in Fiscal 1998, and earnings per share increased to $2.40 from $2.15.<br />
The impact of fluctuating exchange rates for Fiscal 1999 remained relatively consistent on<br />
a line-by-line basis throughout the Consolidated Statement of Income.<br />
LIQUIDITY AND<br />
FINANCIAL POSITION<br />
Return on average shareholders’ equity (‘‘ROE’’) was 52.4% in Fiscal 2000, 23.6% in Fiscal 1999<br />
and 34.4% in Fiscal 1998. Excluding the special items identified above, ROE was 54.4% in Fiscal<br />
2000, 43.9% in Fiscal 1999 and 34.4% in Fiscal 1998. Pretax return on average invested capital<br />
(‘‘ROIC’’) was 31.4% in Fiscal 2000, 20.4% in Fiscal 1999 and 26.4% in Fiscal 1998. Excluding the<br />
special items identified above, ROIC was 30.6% in Fiscal 2000, 30.7% in Fiscal 1999 and 26.2%<br />
in Fiscal 1998.<br />
Cash provided by operating activities decreased to $543.1 million in Fiscal 2000, compared<br />
to $910.1 million in Fiscal 1999 and $1.07 billion in Fiscal 1998. The decrease in Fiscal 2000<br />
versus Fiscal 1999 is primarily due to expenditures on Operation Excel and increased inventory<br />
levels. In order to facilitate the anticipated plant shutdowns and reconfigurations for Operation<br />
Excel, the company has increased inventory levels at certain locations.<br />
Cash used for investing activities was $268.7 million in Fiscal 2000 compared to<br />
$390.5 million in Fiscal 1999. Acquisitions in the current year required $394.4 million versus<br />
$269.0 million last year. Current year acquisitions included United Biscuit’s European Frozen<br />
and Chilled Division, Quality Chef Foods, Yoshida, Thermo Pac, Inc. and Remedia Limited<br />
in Israel. Fiscal 1999 acquisitions included the College Inn brand of canned broths, ABC Sauces<br />
in Indonesia, and other smaller acquisitions. (See Note 2 to the Consolidated Financial<br />
(39)
Statements.) During Fiscal 2000, the company invested $99.8 million in The Hain Celestial<br />
Group, Inc., formerly The Hain Food Group, Inc. Divestitures in the current year provided<br />
$726.5 million, primarily from the sale of the Weight Watchers classroom business, compared<br />
to $180.4 million in Fiscal 1999, primarily from the sale of the company’s bakery products<br />
unit. (See Note 3 to the Consolidated Financial Statements.)<br />
Capital expenditures totaled $452.4 million compared to $316.7 million last year.<br />
The increase is attributable to Operation Excel related capital expenditures across all major<br />
segments. Last year’s capital expenditures were concentrated in the North American Grocery<br />
& Foodservice and European segments.<br />
Purchases and sales/maturities of short-term investments increased in Fiscal 2000. The<br />
company periodically sells a portion of its short-term investment portfolio in order to reduce<br />
its borrowings.<br />
Financing activities required $259.2 million compared to $515.5 million last year. Cash used<br />
for dividends to shareholders increased $28.9 million to $513.8 million from $484.8 million<br />
last year. Purchases of treasury stock totaled $511.5 million (12.8 million shares) in Fiscal 2000,<br />
compared to $410.1 million (7.5 million shares) in Fiscal 1999. Net funds borrowed were<br />
$739.1 million in Fiscal 2000 compared to $268.3 million in Fiscal 1999. Cash provided from<br />
stock options exercised totaled $20.0 million in Fiscal 2000 versus $77.2 million in Fiscal 1999.<br />
The average amount of short-term debt outstanding during Fiscal 2000, Fiscal 1999 and<br />
Fiscal 1998 was $315.5 million, $453.9 million and $556.3 million, respectively. Total short-term<br />
debt had a weighted-average interest rate during Fiscal 2000 of 6.2% and at year-end of 6.5%.<br />
The weighted-average interest rate on short-term debt during Fiscal 1999 was 6.3% and at<br />
year-end was 5.3%.<br />
Aggregate domestic commercial paper had a weighted-average interest rate during<br />
Fiscal 2000 of 5.5% and at year-end of 6.2%. In Fiscal 1999, the weighted-average interest rate<br />
was 5.3% and the rate at year-end was 4.9%. Based upon the amount of commercial paper<br />
outstanding at May 3, 2000, a variance of 1 ⁄8% in the related interest rate would cause annual<br />
interest expense to change by approximately $2.6 million.<br />
On January 5, 2000, the company issued R300 million of 5% Notes due 2005. The proceeds<br />
were used to repay domestic commercial paper. On February 15, 2000, the company issued<br />
$300 million of 7.0% Notes due 2002. The proceeds were used to repay domestic commercial<br />
paper. On February 18, 2000, the company issued £125 million of 6.25% Notes due 2030.<br />
The proceeds were used for general corporate purposes, including repaying commercial<br />
paper borrowings that were incurred in connection with the acquisition of United Biscuit’s<br />
European Frozen and Chilled Division in December 1999. The company entered into<br />
an interest rate swap agreement with a notional amount of £50 million and a settlement date<br />
of April 2001. The swap converts the 6.25% fixed rate to a floating rate. (See Note 6 to the<br />
Consolidated Financial Statements.)<br />
The company’s $2.30 billion credit agreement, which expires in September 2001, supports<br />
its commercial paper program. As of May 3, 2000, $2.08 billion of domestic commercial paper<br />
is classified as long-term debt due to the long-term nature of the supporting credit agreement.<br />
As of April 28, 1999, the company had $1.41 billion of domestic commercial paper outstanding<br />
and classified as long-term debt.<br />
On September 8, 1999, the company’s Board of Directors raised the quarterly dividend on<br />
the company’s common stock to $0.36 3 ⁄4 per share from $0.34 1 ⁄4 per share, for an indicated<br />
annual rate of $1.47 per share. The company paid $513.8 million in dividends to both common<br />
and preferred shareholders, an increase of $28.9 million, or 6.0% over Fiscal 1999. The dividend<br />
rate in effect at the end of each year resulted in a payout ratio of 59.5% in Fiscal 2000, 106.2%<br />
in Fiscal 1999 and 58.6% in Fiscal 1998. Excluding the impact of special items in all years, the<br />
payout ratio was 57.2% in Fiscal 2000, 57.1% in Fiscal 1999 and 58.6% in Fiscal 1998.<br />
(40)
In Fiscal 2000, the company repurchased 12.8 million shares of common stock, or 3.6% of<br />
the amount outstanding at the beginning of Fiscal 2000, at a cost of $511.5 million compared to<br />
the repurchase of 7.5 million shares, or 2.1% of the amount outstanding at the beginning of<br />
Fiscal 1999, at a cost of $410.1 million in Fiscal 1999. On June 1, 1999, the company completed<br />
the 10.0 million share repurchase program which was authorized by the Board of Directors<br />
on September 10, 1997. On June 9, 1999, the Board of Directors authorized the repurchase of<br />
up to 20.0 million shares. As of May 3, 2000, the company had repurchased 12.0 million shares<br />
of the 20.0 million share program. The company may reissue repurchased shares upon the<br />
exercise of stock options, conversions of preferred stock and for general corporate purposes.<br />
In Fiscal 2000, the cash requirements of Operation Excel were $479.4 million, consisting of<br />
spending for severance and exit costs ($89.3 million), capital expenditures ($173.6 million) and<br />
implementation costs ($216.5 million). The Fiscal 2000 cash requirements for Project Millennia<br />
were $29.1 million, consisting of spending for severance and exit costs ($19.6 million) and<br />
capital expenditures ($9.5 million). In Fiscal 1999, the cash requirements of Operation Excel<br />
were $75.6 million, consisting of spending for severance and exit costs ($16.6 million), capital<br />
expenditures ($5.8 million) and implementation costs ($53.2 million). The Fiscal 1999 cash<br />
requirements for Project Millennia were $117.4 million, consisting of spending for severance<br />
and exit costs ($48.6 million), capital expenditures ($46.5 million) and implementation costs<br />
($22.3 million). In Fiscal 2001, the company expects the cash requirements of Operation Excel<br />
to be approximately $413 million, consisting of severance and exit costs ($104 million of the<br />
$125.2 million accrued at May 3, 2000), capital expenditures ($159 million) and implementation<br />
costs ($150 million). The company is financing the cash requirements of these programs<br />
through operations, proceeds from the sale of non-strategic assets and with short-term and<br />
long-term borrowings. The cash requirements of Operation Excel will not have a significant<br />
impact on the company’s liquidity or financial position.<br />
During 1995, the company participated in the formation of a business (‘‘the entity’’) which<br />
purchases a portion of the trade receivables generated by the company. The company sells<br />
receivables to Jameson, Inc., a wholly owned subsidiary, which then sells undivided interests<br />
in the receivables to the entity. Outside investors contributed $95.4 million in capital to the<br />
entity. The company consolidates the entity, and the capital contributed by outside investors is<br />
classified as minority interest (other long-term liabilities) on the Consolidated Balance Sheets.<br />
In June 1998, the Financial Accounting Standards Board (the ‘‘FASB’’) issued Statement<br />
of Financial Accounting Standards (‘‘SFAS’’) No. 133, ‘‘Accounting for Derivative Instruments<br />
and Hedging Activities.’’ This statement establishes accounting and reporting standards for<br />
derivative instruments. The statement requires that an entity recognize all derivatives as either<br />
assets or liabilities in the statement of financial position and measure those instruments at fair<br />
value. In June 1999, the FASB issued SFAS No. 137, ‘‘Accounting for Derivative Instruments<br />
and Hedging Activities – Deferral of the Effective Date of FAS Statement 133,’’ which postponed<br />
the adoption date of SFAS No. 133. As such, the company is not required to adopt the statement<br />
until Fiscal 2002. In June 2000, the FASB issued SFAS No. 138, ‘‘Accounting for Certain<br />
Derivative Instruments and Certain Hedging Activities – an Amendment of FASB Statement<br />
No. 133.’’ This statement amends the accounting and reporting standards of SFAS No. 133<br />
for certain derivative instruments and certain hedging activities. The company is currently<br />
evaluating the effect that implementation of the new standard will have on its results of<br />
operations and financial position.<br />
(41)
In May 2000, the FASB Emerging Issues Task Force (the ‘‘EITF’’) issued new guidelines<br />
entitled ‘‘Accounting for Certain Sales Incentives’’ which address the recognition, measurement<br />
and income statement classification for certain sales incentives (e.g., coupons). These<br />
guidelines will be effective for the company beginning in the second quarter of Fiscal 2001.<br />
The implementation of these guidelines will require the company to make reclassifications<br />
between SG&A and sales.<br />
In December 1999, the Securities and Exchange Commission (the ‘‘SEC’’) issued Staff<br />
Accounting Bulletin (‘‘SAB’’) No. 101, ‘‘Revenue Recognition in Financial Statements.’’<br />
SAB No. 101 provides guidance on the recognition, presentation and disclosure of revenue<br />
in financial statements filed with the SEC. SAB No. 101 outlines the basic criteria that must be<br />
met to recognize revenue and provides guidance for disclosure related to revenue recognition<br />
policies. Management believes that the impact of SAB No. 101, which will be effective in the<br />
fourth quarter of Fiscal 2001, will not have a material effect on its financial position or results<br />
of operations.<br />
On June 19, 2000, the company exercised its preemptive right to purchase an additional<br />
2,582,774 shares of Hain for approximately $80 million, or $30.88 per share. This transaction<br />
restored the company’s ownership interest in Hain to 19.5%. The company’s ownership<br />
had been diluted as a result of Hain’s stock-for-stock merger with Celestial Seasonings on<br />
May 30, 2000.<br />
The impact of inflation on both the company’s financial position and results of operations<br />
is not expected to adversely affect Fiscal 2001 results.<br />
The company’s financial position continues to remain strong, enabling it to meet cash<br />
requirements for operations, capital expansion programs and dividends to shareholders. The<br />
company’s goal remains the achievement of 10% EPS growth for Fiscal 2001 with stronger<br />
performance expected in the second half of the year resulting from the contribution of new<br />
brands and Operation Excel savings.<br />
MARKET RISK FACTORS<br />
The following discussion about the company’s risk-management activities includes ‘‘forwardlooking’’<br />
statements that involve risk and uncertainties. Actual results could differ materially<br />
from those projected in the forward-looking statements.<br />
The company is exposed to market risks from adverse changes in foreign exchange rates,<br />
interest rates and commodity prices. As a policy, the company does not engage in speculative<br />
or leveraged transactions, nor does the company hold or issue financial instruments for<br />
trading purposes.<br />
Foreign Exchange Rate Sensitivity: The company’s cash flow and earnings are subject to<br />
fluctuations due to exchange rate variation. Foreign currency risk exists by nature of the<br />
company’s global operations. The company manufactures and sells its products in a number<br />
of locations around the world, and hence foreign currency risk is well diversified.<br />
When appropriate, the company may attempt to limit its exposure to changing foreign<br />
exchange rates through both operational and financial market actions. These actions<br />
may include entering into forward, option and swap contracts to hedge existing exposures,<br />
firm commitments and anticipated transactions. The instruments are used to reduce risk<br />
(42)
y essentially creating offsetting currency exposures. As of May 3, 2000, the company held<br />
contracts for the purpose of hedging certain intercompany cash flows with an aggregate<br />
notional amount of approximately $320 million. In addition, the company held separate<br />
contracts in order to hedge purchases of certain raw materials and finished goods and for<br />
payments arising from certain foreign currency denominated obligations totaling approximately<br />
$260 million. The company also held contracts to hedge sales denominated in foreign<br />
currencies of $105 million. The company’s contracts mature within two years of the fiscal<br />
year-end. The contracts that effectively meet the risk reduction and correlation criteria,<br />
as measured on a currency-by-currency basis, are accounted for as hedges. Accordingly, gains<br />
and losses are deferred in the cost basis of the underlying transaction. In those circumstances<br />
when it is not appropriate to account for the contracts as hedges, any gains and losses from<br />
mark-to-market and settlement are recorded in miscellaneous income and expense. At May 3,<br />
2000, unrealized gains and losses on outstanding foreign currency contracts are not material.<br />
As of May 3, 2000, the potential gain or loss in the fair value of the company’s outstanding<br />
foreign currency contracts, assuming a hypothetical 10% fluctuation in the currencies of such<br />
contracts, would be approximately $20 million. However, it should be noted that any change<br />
in the value of the contracts, real or hypothetical, would be significantly offset by an inverse<br />
change in the value of the underlying hedged items. In addition, this hypothetical calculation<br />
assumes that each exchange rate would change in the same direction relative to the U.S. dollar.<br />
Substantially all of the company’s foreign affiliates’ financial instruments are denominated<br />
in their respective functional currencies. Accordingly, exposure to exchange risk on foreign<br />
currency financial instruments is not material. (See Note 12 to the Consolidated Financial<br />
Statements.)<br />
Interest Rate Sensitivity: The company is exposed to changes in interest rates primarily as<br />
a result of its borrowing and investing activities used to maintain liquidity and fund business<br />
operations. The company continues to utilize commercial paper to fund working capital<br />
requirements in the U.S. and Canada. The company also borrows in different currencies<br />
from other sources to meet the borrowing needs of its foreign affiliates. The nature and amount<br />
of the company’s long-term and short-term debt can be expected to vary as a result of future<br />
business requirements, market conditions and other factors. The company may utilize interest<br />
rate swap agreements to lower funding costs or to alter interest rate exposure. As of May 3,<br />
2000, the company was party to an interest rate swap with a notional amount of £50 million<br />
and a settlement date of April 2001. The swap converts a 6.25% fixed rate exposure, on<br />
long-term debt maturing in 2030, to a floating rate exposure.<br />
The following table summarizes the company’s debt obligations at May 3, 2000. The interest<br />
rates represent weighted-average rates, with the period-end rate used for the variable rate<br />
debt obligations. The fair value of the debt obligations approximated the recorded value as of<br />
May 3, 2000. (See Notes 6 and 12 to the Consolidated Financial Statements.)<br />
Expected Fiscal Year of Maturity<br />
(Dollars in thousands)<br />
2001 2002 2003 2004 2005 Thereafter Total<br />
Fixed rate $ 20,055 $ 311,880 $461,141 $1,672 $273,022 $674,972 $1,742,742<br />
Average interest rate 7.19% 7.04% 6.20% 7.85% 5.04% 6.83%<br />
Variable rate $156,520 $2,092,933 $ 5,855 $6,069 $ 6,639 $101,643 $2,369,659<br />
Average interest rate 6.54% 6.21% 8.80% 8.78% 8.77% 5.94%<br />
(43)
Commodity Price Sensitivity: The company is the purchaser of certain commodities such as<br />
corn, wheat and soybean meal and oil. The company generally purchases these commodities<br />
based upon market prices that are established with the vendor as part of the purchase process.<br />
In general, the company does not use significant levels of commodity financial instruments<br />
to hedge commodity prices due to a high correlation between the commodity cost and the<br />
ultimate selling price of the product. On occasion, the company may enter into commodity<br />
future or option contracts, as deemed appropriate, to reduce the effect of price fluctuations on<br />
some future manufacturing requirements. Such contracts are accounted for as hedges, with<br />
gains and losses recognized as part of cost of products sold, and generally have a term of less<br />
than one year. As of May 3, 2000, unrealized gains and losses related to commodity contracts<br />
held by the company were not material nor would they be given a hypothetical 10% fluctuation<br />
in market prices. It should be noted that any change in the value of the contracts, real or<br />
hypothetical, would be significantly offset by an inverse change in the value of the underlying<br />
hedged items. (See Note 12 to the Consolidated Financial Statements.)<br />
EURO CONVERSION<br />
A single currency, the Euro, was introduced in Europe on January 1, 1999. Of the fifteen<br />
member countries of the European Union, eleven adopted the Euro as their legal currency<br />
on that date. Fixed conversion rates between the national currencies of these eleven<br />
countries and the Euro were established on that date. The national currencies are scheduled<br />
to remain legal tender as denominations of the Euro during the transition period ending<br />
December 31, 2001. During this transition period, parties may settle transactions using either<br />
the Euro or a participating country’s national currency. At the current time, the company<br />
does not believe that the conversion to the Euro will have a material impact on its business<br />
or its financial condition.<br />
STOCK MARKET<br />
INFORMATION<br />
H.J. <strong>Heinz</strong> Company common stock is traded principally on the New York Stock Exchange<br />
and the Pacific Stock Exchange, under the symbol HNZ. The number of shareholders of record<br />
of the company’s common stock as of June 30, 2000 approximated 58,500. The closing price<br />
of the common stock on the New York Stock Exchange composite listing on May 3, 2000<br />
was $37 5 ⁄8.<br />
Stock price information for common stock by quarter follows:<br />
Stock Price Range<br />
High<br />
Low<br />
2000<br />
First $54 $45 3 4 ⁄<br />
Second 48 5 16 ⁄ 41 7 ⁄ 8<br />
Third 48 1 4 ⁄ 36 5 ⁄ 8<br />
Fourth 39 15 16 ⁄ 30 13 16 ⁄<br />
1999<br />
First $58 1 ⁄2 $51 5 ⁄8<br />
Second 61 1 ⁄8 48 1 ⁄2<br />
Third 61 3 ⁄4 51 3 ⁄16<br />
Fourth 58 13 ⁄16 44 9 ⁄16<br />
(44)
CONSOLIDATED STATEMENTS OF INCOME<br />
H.J. <strong>Heinz</strong> Company and Subsidiaries<br />
Fiscal year ended May 3, 2000 April 28, 1999 April 29, 1998<br />
(Dollars in thousands, except per share amounts) (53 Weeks) (52 Weeks) (52 Weeks)<br />
Sales $9,407,949 $9,299,610 $9,209,284<br />
Cost of products sold 5,788,525 5,944,867 5,711,213<br />
Gross profit 3,619,424 3,354,743 3,498,071<br />
Selling, general and administrative expenses 2,350,942 2,245,431 1,977,741<br />
Gain on sale of Weight Watchers 464,617 – –<br />
Operating income 1,733,099 1,109,312 1,520,330<br />
Interest income 25,330 25,082 32,655<br />
Interest expense 269,748 258,813 258,616<br />
Other expenses, net 25,005 40,450 39,388<br />
Income before income taxes 1,463,676 835,131 1,254,981<br />
Provision for income taxes 573,123 360,790 453,415<br />
Net income $ 890,553 $ 474,341 $ 801,566<br />
PER COMMON SHARE AMOUNTS:<br />
Netincome–diluted $ 2.47 $ 1.29 $ 2.15<br />
Netincome–basic $ 2.51 $ 1.31 $ 2.19<br />
Cash dividends $ 1.44 1 ⁄ 2 $ 1.34 1 ⁄4 $ 1.23 1 ⁄2<br />
Average common shares outstanding – diluted 360,095,455 367,830,419 372,952,851<br />
Average common shares outstanding – basic 355,272,696 361,203,539 365,982,290<br />
See Notes to Consolidated Financial Statements.<br />
(45)
CONSOLIDATED BALANCE SHEETS<br />
H.J. <strong>Heinz</strong> Company and Subsidiaries<br />
Assets (Dollars in thousands) May 3, 2000 April 28, 1999<br />
CURRENT ASSETS:<br />
Cash and cash equivalents $ 137,617 $ 115,982<br />
Short-term investments, at cost which approximates market 16,512 7,139<br />
Receivables (net of allowances: 2000 – $18,697 and 1999 – $21,633) 1,237,804 1,163,915<br />
Inventories:<br />
Finished goods and work-in-process 1,270,329 1,064,015<br />
Packaging material and ingredients 329,577 345,636<br />
1,599,906 1,409,651<br />
Prepaid expenses 171,599 154,619<br />
Other current assets 6,511 35,472<br />
Total current assets 3,169,949 2,886,778<br />
PROPERTY, PLANT AND EQUIPMENT:<br />
Land 45,959 48,649<br />
Buildings and leasehold improvements 860,873 798,307<br />
Equipment, furniture and other 3,440,915 3,227,019<br />
4,347,747 4,073,975<br />
Less accumulated depreciation 1,988,994 1,902,951<br />
Total property, plant and equipment, net 2,358,753 2,171,024<br />
OTHER NON-CURRENT ASSETS:<br />
Goodwill (net of amortization: 2000 – $312,433 and 1999 – $352,209) 1,609,672 1,781,466<br />
Trademarks (net of amortization: 2000 – $104,125 and 1999 – $84,672) 674,279 511,608<br />
Other intangibles (net of amortization: 2000 – $147,343 and<br />
1999 – $117,038) 127,779 177,290<br />
Other non-current assets 910,225 525,468<br />
Total other non-current assets 3,321,955 2,995,832<br />
Total assets $8,850,657 $8,053,634<br />
See Notes to Consolidated Financial Statements.<br />
(46)
Liabilities and Shareholders’ Equity (Dollars in thousands) May 3, 2000 April 28, 1999<br />
CURRENT LIABILITIES:<br />
Short-term debt $ 151,168 $ 290,841<br />
Portion of long-term debt due within one year 25,407 613,366<br />
Accounts payable 1,026,960 945,488<br />
Salaries and wages 48,646 74,098<br />
Accrued marketing 200,775 182,024<br />
Accrued restructuring costs 125,704 147,786<br />
Other accrued liabilities 358,738 372,623<br />
Income taxes 188,672 160,096<br />
Total current liabilities 2,126,070 2,786,322<br />
LONG-TERM DEBT AND OTHER LIABILITIES:<br />
Long-term debt 3,935,826 2,472,206<br />
Deferred income taxes 271,831 310,799<br />
Non-pension postretirement benefits 208,958 208,102<br />
Other 712,116 473,201<br />
Total long-term debt and other liabilities 5,128,731 3,464,308<br />
SHAREHOLDERS’ EQUITY:<br />
Capital stock:<br />
Third cumulative preferred, $1.70 first series, $10 par value 139 173<br />
Common stock, 431,096,485 shares issued, $0.25 par value 107,774 107,774<br />
107,913 107,947<br />
Additional capital 304,318 277,652<br />
Retained earnings 4,756,513 4,379,742<br />
5,168,744 4,765,341<br />
Less:<br />
Treasury shares, at cost (83,653,233 shares at May 3, 2000<br />
and 71,968,652 shares at April 28, 1999) 2,920,471 2,435,012<br />
Unearned compensation relating to the ESOP 7,652 11,728<br />
Accumulated other comprehensive loss 644,765 515,597<br />
Total shareholders’ equity 1,595,856 1,803,004<br />
Total liabilities and shareholders’ equity $8,850,657 $8,053,634<br />
(47)
CONSOLIDATED STATEMENTS OF SHAREHOLDERS’ EQUITY<br />
H.J. <strong>Heinz</strong> Company and Subsidiaries<br />
(Amounts in thousands, except per share amounts)<br />
Comprehensive<br />
Income<br />
Preferred Stock<br />
Shares<br />
Dollars<br />
Common Stock<br />
Shares<br />
Dollars<br />
Balance at April 30, 1997 24 $ 241 431,096 $ 107,774<br />
Comprehensive income – 1998:<br />
Net income – 1998 $ 801,566<br />
Other comprehensive income (loss), net of tax:<br />
Minimum pension liability, net of $1,428 tax expense 2,433<br />
Unrealized translation adjustments (180,284)<br />
Comprehensive income $ 623,715<br />
Cash dividends: Preferred @ $1.70 per share<br />
Shares reacquired<br />
Common @ $1.23 1 ⁄2 per share<br />
Conversion of preferred into common stock (4) (42)<br />
Stock options exercised, net of shares tendered for payment<br />
Unearned compensation relating to the ESOP<br />
Other, net<br />
Balance at April 29, 1998 20 199 431,096 107,774<br />
Comprehensive income – 1999:<br />
Net income – 1999 $ 474,341<br />
Other comprehensive income (loss), net of tax:<br />
Minimum pension liability, net of $6,975 tax benefit (11,880)<br />
Unrealized translation adjustments (88,040)<br />
Comprehensive income $ 374,421<br />
Cash dividends: Preferred @ $1.70 per share<br />
Shares reacquired<br />
Common @ $1.34 1 ⁄4 per share<br />
Conversion of preferred into common stock (3) (26)<br />
Stock options exercised, net of shares tendered for payment<br />
Unearned compensation relating to the ESOP<br />
Other, net<br />
Balance at April 28, 1999 17 173 431,096 107,774<br />
Comprehensive income – 2000:<br />
Netincome–2000 $ 890,553<br />
Other comprehensive income (loss), net of tax:<br />
Minimum pension liability, net of $10,894 tax expense 18,548<br />
Unrealized translation adjustments (154,962)<br />
Realized translation reclassification adjustment 7,246<br />
Comprehensive income $ 761,385<br />
Cash dividends: Preferred @ $1.70 per share<br />
Shares reacquired<br />
Common @ $1.44 1 ⁄2 per share<br />
Conversion of preferred into common stock (3) (34)<br />
Stock options exercised, net of shares tendered for payment<br />
Unearned compensation relating to the ESOP<br />
Other, net*<br />
Balance at May 3, 2000 14 $139 431,096 $107,774<br />
Authorized Shares – May 3, 2000 14 600,000<br />
See Notes to Consolidated Financial Statements.<br />
* Includes activity of the Global Stock Purchase Plan.<br />
(48)
Additional<br />
Capital<br />
Retained<br />
Earnings<br />
Treasury Stock<br />
Shares<br />
Dollars<br />
Unearned<br />
Compensation<br />
Relating to<br />
the ESOP<br />
Accumulated<br />
Other<br />
Comprehensive<br />
Loss<br />
Total<br />
Shareholders’<br />
Equity<br />
$ 175,811 $ 4,041,285 (63,912) $ (1,629,501) $ (17,363) $ (237,826) $ 2,440,421<br />
801,566 801,566<br />
(177,851) (177,851)<br />
(37) (37)<br />
(452,566) (452,566)<br />
(13,559) (677,193) (677,193)<br />
(1,322) 56 1,364 –<br />
77,830† 9,717 200,860 278,690<br />
2,541 2,541<br />
454 19 491 945<br />
252,773 4,390,248 (67,679) (2,103,979) (14,822) (415,677) 2,216,516<br />
474,341 474,341<br />
(99,920) (99,920)<br />
(30) (30)<br />
(484,817) (484,817)<br />
(7,464) (410,103) (410,103)<br />
(846) 34 872 –<br />
25,658† 3,138 78,150 103,808<br />
3,094 3,094<br />
67 2 48 115<br />
277,652 4,379,742 (71,969) (2,435,012) (11,728) (515,597) 1,803,004<br />
890,553 890,553<br />
(129,168) (129,168)<br />
(26) (26)<br />
(513,756) (513,756)<br />
(12,766) (511,480) (511,480)<br />
(1,136) 46 1,170 –<br />
26,830† 833 19,681 46,511<br />
4,076 4,076<br />
972 203 5,170 6,142<br />
$304,318 $4,756,513 (83,653) $(2,920,471) $ (7,652) $(644,765)‡ $1,595,856<br />
† Includes income tax benefit resulting from exercised stock options.<br />
‡ Comprised of unrealized translation adjustment of $(626,904) and minimum pension liability of $(17,861).<br />
(49)
CONSOLIDATED STATEMENTS OF CASH FLOWS<br />
H.J. <strong>Heinz</strong> Company and Subsidiaries<br />
Fiscal year ended May 3, 2000 April 28, 1999 April 29, 1998<br />
(Dollars in thousands) (53 Weeks) (52 Weeks) (52 Weeks)<br />
OPERATING ACTIVITIES:<br />
Net income $ 890,553 $ 474,341 $ 801,566<br />
Adjustments to reconcile net income to cash provided<br />
by operating activities:<br />
Depreciation 219,255 207,852 222,492<br />
Amortization 87,228 94,360 91,130<br />
Deferred tax provision 28,331 23,564 120,875<br />
Gain on sale of Weight Watchers (464,617) – –<br />
Gain on sale of bakery products unit – (5,717) –<br />
Gain on sale of Ore-Ida frozen foodservice business – – (96,563)<br />
Provision for restructuring 392,720 527,107 –<br />
Other items, net 48,905 (43,147) (126,805)<br />
Changes in current assets and liabilities, excluding<br />
effects of acquisitions and divestitures:<br />
Receivables (123,994) (88,742) (7,155)<br />
Inventories (217,127) (115,743) 47,917<br />
Prepaid expenses and other current assets (23,296) 2,604 4,874<br />
Accounts payable 111,976 3,410 54,345<br />
Accrued liabilities (372,999) (150,533) (131,400)<br />
Income taxes (33,860) (19,220) 84,468<br />
Cash provided by operating activities 543,075 910,136 1,065,744<br />
INVESTING ACTIVITIES:<br />
Capital expenditures (452,444) (316,723) (373,754)<br />
Acquisitions, net of cash acquired (394,418) (268,951) (142,112)<br />
Proceeds from divestitures 726,493 180,400 494,739<br />
Purchases of short-term investments (1,175,538) (915,596) (1,179,024)<br />
Sales and maturities of short-term investments 1,119,809 883,945 1,216,573<br />
Investment in The Hain Celestial Group, Inc. (99,764) – –<br />
Other items, net 7,188 46,396 10,740<br />
Cash (used for) provided by investing activities (268,674) (390,529) 27,162<br />
FINANCING ACTIVITIES:<br />
Proceeds from long-term debt 834,328 259,593 555,017<br />
Payments on long-term debt (627,498) (65,744) (572,905)<br />
Proceeds from (payments on) commercial paper and<br />
short-term borrowings, net 532,305 74,464 (288,346)<br />
Dividends (513,782) (484,847) (452,603)<br />
Purchase of treasury stock (511,480) (410,103) (677,193)<br />
Exercise of stock options 20,027 77,158 200,972<br />
Other items, net 6,937 33,989 88,457<br />
Cash used for financing activities (259,163) (515,490) (1,146,601)<br />
Effect of exchange rate changes on cash and cash<br />
equivalents 6,397 15,565 (6,991)<br />
Net increase (decrease) in cash and cash equivalents 21,635 19,682 (60,686)<br />
Cash and cash equivalents at beginning of year 115,982 96,300 156,986<br />
Cash and cash equivalents at end of year $ 137,617 $ 115,982 $ 96,300<br />
See Notes to Consolidated Financial Statements.<br />
(50)
NOTES TO CONSOLIDATED FINANCIAL STATEMENTS<br />
H.J. <strong>Heinz</strong> Company and Subsidiaries<br />
1. SIGNIFICANT<br />
ACCOUNTING POLICIES<br />
Fiscal Year: H.J. <strong>Heinz</strong> Company (the ‘‘company’’) operates on a 52- or 53-week fiscal year<br />
ending the Wednesday nearest April 30. However, certain foreign subsidiaries have earlier<br />
closing dates to facilitate timely reporting. Fiscal years for the financial statements included<br />
herein ended May 3, 2000, April 28, 1999 and April 29, 1998.<br />
Principles of Consolidation: The consolidated financial statements include the accounts<br />
of the company and its subsidiaries. All intercompany accounts and transactions were<br />
eliminated. Investments owned less than 50%, where significant influence exists, are accounted<br />
for on an equity basis. Certain prior-year amounts have been reclassified in order to conform<br />
with the Fiscal 2000 presentation.<br />
UseofEstimates:The preparation of financial statements, in conformity with generally accepted<br />
accounting principles, requires management to make estimates and assumptions that affect<br />
the reported amounts of assets and liabilities, the disclosure of contingent assets and liabilities<br />
at the date of the financial statements, and the reported amounts of revenues and expenses<br />
during the reporting period. Actual results could differ from these estimates.<br />
Translation of Foreign Currencies: For all significant foreign operations, the functional currency<br />
is the local currency. Assets and liabilities of these operations are translated at the exchange<br />
rate in effect at each year-end. Income statement accounts are translated at the average rate of<br />
exchange prevailing during the year. Translation adjustments arising from the use of differing<br />
exchange rates from period to period are included as a component of shareholders’ equity.<br />
Gains and losses from foreign currency transactions are included in net income for the period.<br />
Cash Equivalents: Cash equivalents are defined as highly liquid investments with original<br />
maturities of 90 days or less.<br />
Inventories: Inventories are stated at the lower of cost or market. Cost is determined principally<br />
under the average cost method.<br />
Property, Plant and Equipment: Land, buildings and equipment are recorded at cost. For<br />
financial reporting purposes, depreciation is provided on the straight-line method over<br />
the estimated useful lives of the assets. Accelerated depreciation methods are generally used<br />
for income tax purposes. Expenditures for new facilities and improvements that substantially<br />
extend the capacity or useful life of an asset are capitalized. Ordinary repairs and maintenance<br />
are expensed as incurred. When property is retired or otherwise disposed, the cost and<br />
related depreciation are removed from the accounts and any related gains or losses are<br />
included in income.<br />
Intangibles: Goodwill, trademarks and other intangibles arising from acquisitions are being<br />
amortized on a straight-line basis over periods ranging from three to 40 years. The company<br />
regularly reviews the individual components of the balances by evaluating the future cash<br />
flows of the businesses to determine the recoverability of the assets and recognizes, on a<br />
current basis, any diminution in value.<br />
(51)
Revenue Recognition: The company generally recognizes revenue upon shipment of goods<br />
to customers or upon performance of services. However, in certain overseas countries,<br />
revenue is recognized upon receipt of the product by the customer.<br />
Advertising Expenses: Advertising costs are generally expensed in the year in which the<br />
advertising first takes place.<br />
Income Taxes: Deferred income taxes result primarily from temporary differences between<br />
financial and tax reporting. If it is more likely than not that some portion or all of a deferred tax<br />
asset will not be realized, a valuation allowance is recognized.<br />
The company has not provided for possible U.S. taxes on the undistributed earnings of<br />
foreign subsidiaries that are considered to be reinvested indefinitely. Calculation of the<br />
unrecognized deferred tax liability for temporary differences related to these earnings is not<br />
practicable. Where it is contemplated that earnings will be remitted, credit for foreign taxes<br />
already paid generally will offset applicable U.S. income taxes. In cases where they will not<br />
offset U.S. income taxes, appropriate provisions are included in the Consolidated Statements<br />
of Income.<br />
Stock-Based Employee Compensation Plans: Stock-based compensation is accounted for by<br />
using the intrinsic value-based method in accordance with Accounting Principles Board<br />
Opinion No. 25, ‘‘Accounting for Stock Issued to Employees.’’<br />
Financial Instruments: The company uses derivative financial instruments for the purpose of<br />
hedging currency, price and interest rate exposures which exist as part of ongoing business<br />
operations. As a policy, the company does not engage in speculative or leveraged transactions,<br />
nor does the company hold or issue financial instruments for trading purposes.<br />
Interest Rate Swap Agreements: The company may utilize interest rate swap agreements<br />
to lower funding costs or to alter interest rate exposure. Amounts paid or received on interest<br />
rate swap agreements are deferred and recognized as adjustments to interest expense. Gains<br />
and losses realized upon the settlement of such contracts are deferred and amortized to interest<br />
expense over the remaining term of the debt instrument or are recognized immediately if the<br />
underlying instrument is settled.<br />
Foreign Currency Contracts: The company enters into forward, purchased option and swap<br />
contracts to hedge transactions denominated in foreign currencies in order to reduce the<br />
currency risk associated with fluctuating exchange rates. Such contracts are used primarily<br />
to hedge certain intercompany cash flows, purchases and sales of certain raw materials<br />
and finished goods and for payments arising from certain foreign currency denominated<br />
obligations. Realized and unrealized gains and losses from instruments qualifying as hedges<br />
are deferred as part of the cost basis of the underlying transaction. Realized and unrealized<br />
gains and losses from foreign currency contracts used as economic hedges but not qualifying<br />
for hedge accounting are recognized currently in miscellaneous income and expense.<br />
Commodity Contracts: In connection with purchasing certain commodities for future<br />
manufacturing requirements, the company enters into commodities futures and option<br />
contracts, as deemed appropriate, to reduce the effect of price fluctuations. Such contracts<br />
are accounted for as hedges, with gains and losses recognized as part of cost of products<br />
sold, and generally have a term of less than one year.<br />
(52)
The cash flows related to the above financial instruments are classified in the Statements<br />
of Cash Flows in a manner consistent with those of the transactions being hedged.<br />
Recently Issued Accounting Standards: In June 1998, the Financial Accounting Standards<br />
Board (the ‘‘FASB’’) issued Statement of Financial Accounting Standards (‘‘SFAS’’) No. 133,<br />
‘‘Accounting for Derivative Instruments and Hedging Activities.’’ This statement establishes<br />
accounting and reporting standards for derivative instruments. The statement requires<br />
that an entity recognize all derivatives as either assets or liabilities in the statement of financial<br />
position and measure those instruments at fair value. In June 1999, the FASB issued SFAS<br />
No. 137, ‘‘Accounting for Derivative Instruments and Hedging Activities – Deferral of the<br />
Effective Date of FAS Statement 133,’’ which postponed the adoption date of SFAS No. 133.<br />
As such, the company is not required to adopt the statement until Fiscal 2002. In June 2000,<br />
the FASB issued SFAS No. 138, ‘‘Accounting for Certain Derivative Instruments and Certain<br />
Hedging Activities – an Amendment of FASB Statement No. 133.’’ This statement amends the<br />
accounting and reporting standards of SFAS No. 133 for certain derivative instruments and<br />
certain hedging activities. The company is currently evaluating the effect that implementation<br />
of the new standard will have on its results of operations and financial position.<br />
In May 2000, the FASB Emerging Issues Task Force (the ‘‘EITF’’) issued new guidelines<br />
entitled ‘‘Accounting for Certain Sales Incentives’’ which address the recognition, measurement<br />
and income statement classification for certain sales incentives (e.g., coupons). These<br />
guidelines will be effective for the company beginning in the second quarter of Fiscal 2001.<br />
The implementation of these guidelines will require the company to make reclassifications<br />
between selling, general and administrative expenses (‘‘SG&A’’) and sales.<br />
In December 1999, the Securities and Exchange Commission (the ‘‘SEC’’) issued Staff<br />
Accounting Bulletin (‘‘SAB’’) No. 101, ‘‘Revenue Recognition in Financial Statements.’’<br />
SAB No. 101 provides guidance on the recognition, presentation and disclosure of revenue<br />
in financial statements filed with the SEC. SAB No. 101 outlines the basic criteria that must be<br />
met to recognize revenue and provides guidance for disclosure related to revenue recognition<br />
policies. Management believes that the impact of SAB No. 101, which will be effective in the<br />
fourth quarter of Fiscal 2001, will not have a material effect on its financial position or results<br />
of operations.<br />
2. ACQUISITIONS All of the following acquisitions have been accounted for as purchases and, accordingly, the<br />
respective purchase prices have been allocated to the respective assets and liabilities based<br />
upon their estimated fair values as of the acquisition date. Operating results of businesses<br />
acquired have been included in the Consolidated Statements of Income from the respective<br />
acquisition dates forward. Pro forma results of the company, assuming all of the following<br />
acquisitions had been made at the beginning of each period presented, would not be<br />
materially different from the results reported.<br />
Fiscal 2000: The company acquired businesses for a total of $404.9 million, including<br />
obligations to sellers of $10.4 million. The preliminary allocations of the purchase price resulted<br />
in goodwill of $153.4 million and trademarks and other intangible assets of $134.8 million,<br />
which are being amortized on a straight-line basis over periods not exceeding 40 years. Final<br />
allocation of the purchase price is not expected to differ significantly from the preliminary<br />
allocations and is expected to be completed in Fiscal 2001.<br />
On December 7, 1999, the company completed the acquisition of United Biscuit’s European<br />
Frozen and Chilled Division, one of the leading frozen food businesses in the U.K. and<br />
Ireland, which produces frozen desserts and vegetarian/meat-free products, frozen pizzas,<br />
frozen value-added potato products and fresh sandwiches. Also during Fiscal 2000, the<br />
(53)
company completed the acquisition of Quality Chef Foods, a leading manufacturer of frozen<br />
heat-and-serve soups, entrées and sauces; Yoshida, a line of Asian sauces marketed in the<br />
U.S.; Thermo Pac, Inc., a U.S. leader in single-serve condiments; and obtained a 51% share of<br />
Remedia Limited, Israel’s leading company in infant nutrition. The company also made other<br />
smaller acquisitions during the year.<br />
Fiscal 1999: The company acquired businesses for a total of $317.3 million, including obligations<br />
to sellers of $48.4 million. The allocations of the purchase price resulted in goodwill of<br />
$99.7 million and trademarks and other intangible assets of $215.0 million, which are being<br />
amortized on a straight-line basis over periods not exceeding 40 years.<br />
Acquisitions made during Fiscal 1999 include: the College Inn brand of canned broths and<br />
ABC Sauces in Indonesia, a leading provider of ketchup, sauces and condiments. The company<br />
also made other smaller acquisitions during the year.<br />
Fiscal 1998: The company acquired businesses for a total of $142.1 million. The allocations of<br />
the purchase price resulted in goodwill of $65.1 million and trademarks and other intangible<br />
assets of $27.2 million, which are being amortized on a straight-line basis over periods not<br />
exceeding 40 years.<br />
On June 30, 1997, the company acquired John West Foods Limited, the leading brand of<br />
canned tuna and fish in the U.K. Based in Liverpool, John West Foods Limited sells its canned<br />
fish products throughout Continental Europe and in a number of other international markets.<br />
(John West operations in Australia, New Zealand and South Africa were not included in the<br />
transaction.) During Fiscal 1998, the company also made other acquisitions, primarily in the<br />
Asia/Pacific region, Europe and South Africa.<br />
3. DIVESTITURES On September 29, 1999, the company completed the sale of the Weight Watchers classroom<br />
business for $735 million, which included $25 million of preferred stock. The transaction<br />
resulted in a pretax gain of $464.6 million ($0.72 per share). The company used a portion<br />
of the proceeds to retain a 6% equity interest in Weight Watchers International, Inc. The sale<br />
did not include WeightWatchersSmartOnesfrozen meals, desserts and breakfast items,<br />
Weight Watchers from <strong>Heinz</strong> intheU.K.andabroadrangeofotherWeight Watchers branded<br />
foods in <strong>Heinz</strong>’s global core product categories. The Weight Watchers classroom business<br />
contributed approximately $400 million in sales for Fiscal 1999. During Fiscal 2000, the<br />
company also made other smaller divestitures.<br />
On October 2, 1998, the company completed the sale of its bakery products unit for<br />
$178.0 million. The transaction resulted in a pretax gain of $5.7 million, which was recorded<br />
in SG&A. The bakery products unit contributed approximately $200 million in sales for<br />
Fiscal 1998.<br />
On June 30, 1997, the company completed the sale of its Ore-Ida frozen foodservice<br />
business. The transaction resulted in a pretax gain of approximately $96.6 million ($0.14 per<br />
share), and was recorded in SG&A. The transaction included the sale of the company’s<br />
Ore-Ida appetizer, pasta and potato foodservice business and five of the Ore-Ida plants that<br />
manufacture the products. The Ore-Ida frozen foodservice business contributed approximately<br />
$525 million in net sales for Fiscal 1997.<br />
Pro forma results of the company, assuming all of the above divestitures had been<br />
made at the beginning of each period presented, would not be materially different from<br />
the results reported.<br />
(54)
4. RESTRUCTURING<br />
CHARGES<br />
Operation Excel<br />
In Fiscal 1999, the company announced a transformative growth and restructuring initiative.<br />
The initiative, named ‘‘Operation Excel,’’ is a multi-year, multi-faceted program creating<br />
manufacturing centers of excellence, focusing the product portfolio, realigning the company’s<br />
management teams and investing in growth initiatives.<br />
Creating manufacturing centers of excellence is resulting in significant changes to the<br />
company’s manufacturing footprint including the following initiatives: closing the Harlesden<br />
factory in London, England and focusing the Kitt Green factory in Wigan, England on canned<br />
beans, soups and pasta production and focusing the Elst factory in the Netherlands on<br />
tomato ketchup and sauces; downsizing the Puerto Rico tuna processing facility and focusing<br />
this facility on lower volume/higher margin products (completed in Fiscal 2000); focusing<br />
the Pittsburgh, Pennsylvania factory on soup and baby food production and shifting other<br />
production to existing facilities; consolidating manufacturing capacity in the Asia/Pacific<br />
region; closing the Zabreh, Czech Republic factory and disposing of the Czech dairy business<br />
and transferring the infant formula business to the Kendal, England factory (completed in<br />
Fiscal 2000); downsizing the Pocatello, Idaho factory by shifting Bagel Bites production to the<br />
Ft. Myers, Florida factory, and shifting certain Smart Ones entrée production to the Massillon,<br />
Ohio factory (completed in Fiscal 2000); closing the Redditch, England factory and shifting<br />
production to the Telford, England factory and the Turnhout factory in Belgium (completed<br />
in Fiscal 2000); closing the El Paso, Texas pet treat facility and consolidating production<br />
in the Topeka, Kansas factory; and disposing of the Bloomsburg, Pennsylvania frozen pasta<br />
factory (completed in Fiscal 2000).<br />
As part of Operation Excel, the company is focusing the portfolio of product lines on six<br />
core food categories: ketchup, condiments and sauces; frozen foods; tuna; soup, beans and<br />
pasta meals; infant foods; and pet products. A consequence of this focus on the core categories<br />
was the sale of the Weight Watchers classroom business in Fiscal 2000.<br />
Additionally, seven other smaller businesses, which have combined annual revenues of<br />
approximately $80 million, are being disposed.<br />
Realigning the company’s management teams will provide processing and product<br />
expertise across the regions of North America, Europe and Asia/Pacific. Specifically, Operation<br />
Excel includes creating a single U.S. frozen food headquarters, resulting in the closure of the<br />
company’s Ore-Ida head office in Boise, Idaho (completed in Fiscal 2000); consolidating many<br />
European administrative support functions; creating a single North American Grocery &<br />
Foodservice headquarters in Pittsburgh, Pennsylvania, resulting in the relocation of the<br />
company’s domestic seafood and pet food headquarters from Newport, Kentucky; and creating<br />
two Asia/Pacific management teams with headquarters in Melbourne (for the Australian,<br />
New Zealand and Japanese businesses) and Singapore (for all other Asian businesses).<br />
The initiatives will result in the closure or exit of 21 factories or businesses. Management<br />
estimates that these actions will impact approximately 6,000 employees with a net reduction<br />
in the workforce of approximately 4,600, after expansion of certain facilities.<br />
During Fiscal 2000, the company recognized net restructuring charges and implementation<br />
costs totaling $392.7 million pretax ($0.74 per share). Pretax charges of $170.4 million were<br />
classified as cost of products sold and $222.3 million as SG&A. During Fiscal 1999, the<br />
company recognized restructuring charges and implementation costs totaling $552.8 million<br />
pretax ($1.11 per share). Pretax charges of $396.4 million were classified as cost of products<br />
sold and $156.4 million as SG&A.<br />
(55)
Included in the $392.7 million of net restructuring and implementation costs recognized<br />
in Fiscal 2000 is a reversal of $18.2 million pretax of Fiscal 1999 restructuring accruals (exit<br />
costs, $0.4 million and severance costs, $1.3 million) and asset write-downs ($16.5 million),<br />
primarily for the closure of the West Chester, Pennsylvania facility, which will now remain<br />
in operation as a result of the sale of the Bloomsburg facility in April of Fiscal 2000.<br />
The major components of the restructuring charges and implementation costs and the<br />
remaining accrual balances as of May 3, 2000 and April 28, 1999 were as follows:<br />
(Dollars in millions)<br />
Non-Cash<br />
Asset<br />
Write-Downs<br />
Employee<br />
Termination and<br />
Severance Costs<br />
Accrued<br />
Exit Costs<br />
Implementation<br />
Costs<br />
Total<br />
Restructuring and implementation costs – 1999 $ 294.9 $ 159.4 $ 45.3 $ 53.2 $ 552.8<br />
Amounts utilized – 1999 (294.9) (67.3) (9.8) (53.2) (425.2)<br />
Accrued restructuring costs – April 28, 1999 – 92.1 35.5 – 127.6<br />
Net restructuring and implementation costs – 2000 61.6 84.5 30.1 216.5 392.7<br />
Amounts utilized – 2000 (61.6) (86.3) (30.7) (216.5) (395.1)<br />
Accrued restructuring costs – May 3, 2000 $ – $ 90.3 $ 34.9 $ – $ 125.2<br />
Non-cash asset write-downs consisted primarily of long-term asset impairments that were<br />
recorded as a direct result of the company’s decision to exit businesses or facilities. Non-cash<br />
asset write-downs totaled $61.6 million in Fiscal 2000 and related to property, plant and<br />
equipment ($48.7 million) and current assets ($12.9 million). In Fiscal 1999, non-cash asset<br />
write-downs consisted of property, plant and equipment ($210.9 million), goodwill and other<br />
intangibles ($49.6 million) and current assets ($34.5 million). Long-term asset write-downs were<br />
based on third-party appraisals, contracted sales prices or management’s estimate of salvage<br />
value. The carrying value of these long-term assets was approximately $30 million at May 3,<br />
2000 and $50 million at April 28, 1999. These assets will be sold or removed from service<br />
within 12 months. Once the assets are removed from service, the company will actively market<br />
these assets for sale. The results of operations, related to these assets, including the effect<br />
of reduced depreciation were not material. Current asset write-downs included inventory<br />
and packaging material, prepaids and other current assets and were determined based on<br />
management’s estimate of net realizable value.<br />
Severance charges are primarily related to involuntary terminations and represent cash<br />
termination payments to be paid to affected employees as a direct result of the restructuring<br />
program. Non-cash pension and postretirement benefit charges related to the approved<br />
projects are also included as a component of total severance costs ($27.8 million and $60.5<br />
million in Fiscal 2000 and Fiscal 1999, respectively).<br />
Exit costs are primarily related to contract and lease termination costs ($12.0 million<br />
in Fiscal 2000 and $35.0 million in Fiscal 1999).<br />
Implementation costs were recognized as incurred in Fiscal 2000 ($216.5 million)<br />
and Fiscal 1999 ($53.2 million) and consist of incremental costs directly related to the<br />
implementation of Operation Excel, including consulting fees, employee relocation costs,<br />
unaccruable severance costs associated with terminated employees, training costs,<br />
equipment relocation costs and commissioning costs.<br />
In Fiscal 2000, 11 factories and four businesses were sold or closed including those located<br />
in England, Hungary, the Czech Republic, New Zealand and the U.S., resulting in a net<br />
reduction of the company’s workforce of approximately 3,000 employees. During Fiscal 1999,<br />
the company’s workforce was reduced by approximately 200 employees, principally through<br />
the closure of Ore-Ida’s Boise head office and through the divestiture of the Clarksville,<br />
Arkansas sweet potato business.<br />
(56)
Project Millennia<br />
During the fourth quarter of Fiscal 1997, the company announced a reorganization<br />
and restructuring program named ‘‘Project Millennia,’’ which resulted in a total cost of<br />
approximately $750 million over three years. The reorganization plan was designed<br />
to strengthen the company’s core businesses and improve profitability and global growth.<br />
Key initiatives were focused on process changes and product line rationalizations.<br />
The major components of the restructuring charges and implementation costs and the<br />
accrual balances as of May 3, 2000, April 28, 1999, April 29, 1998 and April 30, 1997 were<br />
as follows:<br />
(Dollars in millions)<br />
Non-Cash<br />
Asset<br />
Write-Downs<br />
Employee<br />
Termination and<br />
Severance Costs<br />
Accrued<br />
Exit Costs<br />
Exit Costs<br />
Implementation<br />
Costs<br />
Total<br />
Restructuring and implementation costs – 1997 $ 324.3 $ 164.5 $ 94.3 $ 64.1 $ 647.2<br />
Amounts utilized – 1997 (324.3) (32.1) (15.9) (64.1) (436.4)<br />
Accrued restructuring costs – April 30, 1997 – 132.4 78.4 — 210.8<br />
Implementation costs – 1998 – – – 84.1 84.1<br />
Amounts utilized – 1998 – (91.9) (24.5) (84.1) (200.5)<br />
Accrued restructuring costs – April 29, 1998 – 40.5 53.9 – 94.4<br />
Implementation costs – 1999 – – – 22.3 22.3<br />
Amounts utilized – 1999 – (28.7) (19.9) (22.3) (70.9)<br />
Accrual reversal – 1999 – (9.1) (16.6) – (25.7)<br />
Accrued restructuring costs – April 28, 1999 – 2.7 17.4 – 20.1<br />
Amounts utilized – 2000 – (2.7) (16.9) – (19.6)<br />
Accrued restructuring costs – May 3, 2000 $ – $ – $ 0.5 $ – $ 0.5<br />
The company has completed the implementation of Project Millennia. During Fiscal 2000, the<br />
company utilized $19.6 million of severance and exit accruals. The utilization of the accruals<br />
related principally to the closure of a tuna processing facility in Australia, the closure of a<br />
tomato processing facility in Spain and costs associated with contractual lease commitments<br />
of the U.S. Weight Watchers classroom business, which were transferred to the buyer of the<br />
classroom business.<br />
As of May 3, 2000, the company has closed or divested all of the 25 plants that were<br />
scheduled for closure or divestiture. Project Millennia has resulted in a net workforce reduction<br />
of 2,250 employees.<br />
As of May 3, 2000, there are $0.5 million of remaining Project Millennia accruals. These<br />
accruals relate to contractual lease commitments in the U.S.<br />
(57)
5. INCOME TAXES The following table summarizes the provision /(benefit) for U.S. federal and U.S. possessions,<br />
state and foreign taxes on income.<br />
(Dollars in thousands) 2000 1999 1998<br />
Current:<br />
U.S. federal and U.S. possessions $318,873 $110,490 $214,866<br />
State 45,935 15,389 17,667<br />
Foreign 179,984 211,347 100,007<br />
544,792 337,226 332,540<br />
Deferred:<br />
U.S. federal and U.S. possessions 71,602 66,944 103,630<br />
State (1,871) 2,441 1,536<br />
Foreign (41,400) (45,821) 15,709<br />
28,331 23,564 120,875<br />
Total tax provision $573,123 $360,790 $453,415<br />
The Fiscal 2000 effective tax rate was unfavorably impacted by the excess of basis in assets<br />
for financial reporting over the tax basis of assets included in the Weight Watchers sale and<br />
by gains in higher taxed states related to the sale. Tax expense related to the pretax gain<br />
of $464.6 million was $204.9 million. The Fiscal 2000 and Fiscal 1999 effective tax rates were<br />
unfavorably impacted by restructuring and implementation costs expected to be realized in<br />
lower tax rate jurisdictions and by nondeductible expenses related to the restructuring. Tax<br />
benefit related to the $392.7 million of Operation Excel net restructuring and implementation<br />
costs for Fiscal 2000 was $125.3 million. Tax benefit related to the $552.8 million of Operation<br />
Excel restructuring and implementation costs for 1999 was $143.1 million. In Fiscal 1998,<br />
reduced tax rates enacted in the U.K. and Italy decreased the tax provision by $21.6 million,<br />
representing the impact of the reduced tax rates on net deferred taxes payable as of the dates<br />
of enactment. Tax expense resulting from allocating certain tax benefits directly to additional<br />
capital was immaterial in Fiscal 2000. In Fiscal 1999 it was $26.6 million, and in Fiscal 1998<br />
it was $77.7 million.<br />
The components of income before income taxes consist of the following:<br />
(Dollars in thousands) 2000 1999 1998<br />
Domestic $ 805,464 $427,089 $ 742,665<br />
Foreign 658,212 408,042 512,316<br />
Total income before income taxes $1,463,676 $835,131 $1,254,981<br />
The differences between the U.S. federal statutory tax rate and the company’s consolidated<br />
effective tax rate are as follows:<br />
2000 1999 1998<br />
U.S. federal statutory tax rate 35.0% 35.0% 35.0%<br />
Tax on income of foreign subsidiaries (1.1) 1.3 (0.9)<br />
State income taxes (net of federal benefit) 1.9 1.5 1.1<br />
Earnings repatriation 1.7 (0.3) (0.2)<br />
Effect of foreign losses 1.4 3.8 –<br />
Tax on income of U.S. possessions subsidiaries (1.4) 0.6 (1.3)<br />
Other 1.7 1.3 2.4<br />
Effective tax rate 39.2% 43.2% 36.1%<br />
(58)
The deferred tax (assets) and deferred tax liabilities recorded on the balance sheets as of<br />
May 3, 2000 and April 28, 1999 are as follows:<br />
(Dollars in thousands) 2000 1999<br />
Depreciation/amortization $ 416,453 $ 429,101<br />
Benefit plans 48,180 70,006<br />
Other 63,626 57,925<br />
528,259 557,032<br />
Provision for estimated expenses (105,375) (148,519)<br />
Operating loss carryforwards (37,813) (37,104)<br />
Benefit plans (115,007) (122,007)<br />
Tax credit carryforwards (44,911) (10,573)<br />
Other (131,086) (98,674)<br />
(434,192) (416,877)<br />
Valuation allowance 75,109 40,811<br />
Net deferred tax liabilities $ 169,176 $ 180,966<br />
At the end of Fiscal 2000, net operating loss carryforwards totaled $81.1 million. Of that<br />
amount, $20.5 million expire through 2010; the other $60.6 million do not expire. Foreign<br />
tax credit carryforwards total $44.9 million and expire through 2005.<br />
The company’s consolidated U.S. income tax returns have been audited by the Internal<br />
Revenue Service for all years through 1994.<br />
Undistributed earnings of foreign subsidiaries considered to be reinvested permanently<br />
amounted to $2.25 billion at May 3, 2000.<br />
The Fiscal 2000 net change in the valuation allowance for deferred tax assets was an<br />
increase of $34.3 million, due principally to additional deferred tax asset related to foreign<br />
tax credit carryforward.<br />
During the first quarter of Fiscal 2000, the company reorganized certain of its foreign<br />
operations, and, as a result, expects to pay approximately $320 million in foreign income<br />
taxes through Fiscal 2005. Because the company increased tax basis in amortizable assets<br />
at the same time, cash flow related to the reorganization is expected to be neutral over<br />
the payment period.<br />
6. DEBT Short-term debt consisted of bank and other borrowings of $151.2 million and $290.8 million as<br />
of May 3, 2000 and April 28, 1999, respectively. Total short-term debt had a weighted-average<br />
interest rate during Fiscal 2000 of 6.2% and at year-end of 6.5%. The weighted-average interest<br />
rate on short-term debt during Fiscal 1999 was 6.3% and at year-end was 5.3%.<br />
The company maintains a $2.30 billion credit agreement that supports its domestic<br />
commercial paper program. The credit agreement expires in September 2001. In addition, the<br />
company had $760.3 million of foreign lines of credit available at year-end.<br />
As of May 3, 2000 and April 28, 1999, the company had $2.08 billion and $1.41 billion,<br />
respectively, of domestic commercial paper outstanding. Due to the long-term nature<br />
of the credit agreement, all of the outstanding domestic commercial paper has been classified<br />
as long-term debt as of May 3, 2000 and April 28, 1999. Aggregate domestic commercial paper<br />
(59)
had a weighted-average interest rate during Fiscal 2000 of 5.5% and at year-end of 6.2%.<br />
In Fiscal 1999, the weighted-average rate was 5.3% and at year-end was 4.9%.<br />
Long-Term (Dollars in thousands)<br />
Range of<br />
Interest<br />
Maturity<br />
(Fiscal Year) 2000 1999<br />
United States Dollars:<br />
Commercial paper Variable 2002 $2,084,175 $1,406,131<br />
Senior unsecured notes and debentures 6.00–6.88% 2001–2029 740,537 1,040,013<br />
Eurodollar notes 5.75–7.00 2002–2003 548,463 499,089<br />
Revenue bonds 3.40–7.70 2001–2027 14,892 15,092<br />
Promissory notes 3.00–10.00 2001–2005 20,967 67,397<br />
Other 6.50 2001–2020 12,287 5,860<br />
3,421,321 3,033,582<br />
Foreign Currencies<br />
(U.S. Dollar Equivalents):<br />
Promissory notes:<br />
Pound sterling 5.67–8.86% 2001–2030 235,388 10,230<br />
Euro 5.00 2005 268,674 –<br />
Italian lire 3.90–6.53 2001–2008 1,422 7,377<br />
Australian dollar 6.10 2001–2002 6,152 13,421<br />
Other 5.00–24.00 2001–2022 28,276 20,962<br />
539,912 51,990<br />
Total long-term debt 3,961,233 3,085,572<br />
Less portion due within one year 25,407 613,366<br />
$3,935,826 $2,472,206<br />
The amount of long-term debt that matures in each of the four years succeeding 2001 is:<br />
$2,404.8 million in 2002, $467.0 million in 2003, $7.7 million in 2004 and $279.7 million in 2005.<br />
On January 5, 2000, the company issued R300 million of 5% Notes due 2005. The proceeds<br />
were used to repay domestic commercial paper. On February 15, 2000, the company issued<br />
$300 million of 7.0% Notes due 2002. The proceeds were used to repay domestic commercial<br />
paper. On February 18, 2000, the company issued £125 million of 6.25% Notes due 2030.<br />
The proceeds were used for general corporate purposes, including repaying commercial paper<br />
borrowings that were incurred in connection with the acquisition of United Biscuit’s European<br />
Frozen and Chilled Division in December 1999. The company entered into an interest rate<br />
swap agreement with a notional amount of £50 million and a settlement date of April 2001.<br />
This swap converts the 6.25% fixed rate to a floating rate.<br />
On July 15, 1998, the company issued $250 million of 6.375% Debentures due July 2028.<br />
The proceeds were used to repay domestic commercial paper.<br />
7. SHAREHOLDERS’ EQUITY Capital Stock: The preferred stock outstanding is convertible at a rate of one share of<br />
preferred stock into 13.5 shares of common stock. The company can redeem the stock at<br />
$28.50 per share.<br />
As of May 3, 2000, there were authorized, but unissued, 2,200,000 shares of third<br />
cumulative preferred stock for which the series had not been designated.<br />
Employee Stock Ownership Plan (‘‘ESOP’’): The company established an ESOP in 1990 to<br />
replace in full or in part the company’s cash-matching contributions to the H.J. <strong>Heinz</strong> Company<br />
Employees Retirement and Savings Plan, a 401(k) plan for salaried employees. Matching<br />
contributions to the 401(k) plan are based on a percentage of the participants’ contributions,<br />
subject to certain limitations.<br />
(60)
Global Stock Purchase Plan (‘‘GSPP’’): On September 8, 1999, the stockholders authorized a<br />
GSPP, which qualifies under Internal Revenue Code Section 423, and provides for the purchase<br />
by employees of up to 3,000,000 shares of the company’s stock through payroll deductions.<br />
Employees who choose to participate in the plan will receive an option to acquire common<br />
stock at a discount. The purchase price per share will be the lower of 85% of the fair market<br />
value of the company’s stock on the first or last day of a purchase period. During Fiscal 2000,<br />
employees purchased 173,326 shares under this plan.<br />
Cumulative Translation Adjustments: Changes in the cumulative translation component of<br />
shareholders’ equity result principally from translation of financial statements of foreign<br />
subsidiaries into U.S. dollars. The reduction in shareholders’ equity related to the translation<br />
component increased $147.7 million in 2000, $88.0 million in 1999 and $180.3 million in 1998.<br />
During Fiscal 2000, a loss of $7.2 million was transferred from the cumulative translation<br />
component of shareholders’ equity and included in the determination of net income.<br />
Unfunded Pension Obligation: An adjustment for unfunded foreign pension obligations<br />
in excess of unamortized prior service costs was recorded, net of tax, as a reduction in<br />
shareholders’ equity.<br />
8. SUPPLEMENTAL CASH<br />
FLOWS INFORMATION<br />
(Dollars in thousands) 2000 1999 1998<br />
Cash Paid During the Year For:<br />
Interest $273,506 $266,395 $300,173<br />
Income taxes 485,267 287,544 188,567<br />
Details of Acquisitions:<br />
Fair value of assets $563,376 $350,575 $200,406<br />
Liabilities* 166,699 80,055 47,912<br />
Cash paid 396,677 270,520 152,494<br />
Less cash acquired 2,259 1,569 10,382<br />
Net cash paid for acquisitions $394,418 $268,951 $142,112<br />
* Includes obligations to sellers of $10.4 million and $48.4 million in 2000 and 1999, respectively.<br />
9. EMPLOYEES’ STOCK<br />
OPTION PLANS<br />
AND MANAGEMENT<br />
INCENTIVE PLANS<br />
Under the company’s stock option plans, officers and other key employees may be granted<br />
options to purchase shares of the company’s common stock. Generally, the option price on<br />
outstanding options is equal to the fair market value of the stock at the date of grant. Options<br />
are generally exercisable beginning from one to three years after date of grant and have a<br />
maximum term of 10 years. Beginning in Fiscal 1998, in order to place greater emphasis on<br />
creation of shareholder value, performance-accelerated stock options were granted to certain<br />
key executives. These options vest eight years after the grant date, subject to acceleration if<br />
predetermined share price goals are achieved.<br />
The company has adopted the disclosure-only provisions of SFAS No. 123, ‘‘Accounting for<br />
Stock-Based Compensation.’’ Accordingly, no compensation cost has been recognized for the<br />
company’s stock option plans. If the company had elected to recognize compensation cost<br />
(61)
ased on the fair value of the options granted at grant date as prescribed by SFAS No. 123, net<br />
income and earnings per share would have been reduced to the pro forma amounts indicated<br />
below:<br />
Fiscal year ended May3,2000 April 28, 1999 April 29, 1998<br />
(Dollars in thousands, except per share amounts) (53 Weeks) (52 Weeks) (52 Weeks)<br />
Pro forma net income $862,698 $440,080 $790,325<br />
Pro forma diluted net income per common share $ 2.40 $ 1.20 $ 2.12<br />
Pro forma basic net income per common share $ 2.43 $ 1.22 $ 2.16<br />
The pro forma effect on net income for Fiscal 2000, Fiscal 1999 and Fiscal 1998 is not<br />
representative of the pro forma effect on net income in future years because it does not take<br />
into consideration pro forma compensation expense related to grants made prior to 1996.<br />
The weighted-average fair value of options granted was $8.98 per share in Fiscal 2000,<br />
$11.34 per share in Fiscal 1999 and $12.45 per share in Fiscal 1998.<br />
The fair value of each option grant is estimated on the date of grant using the Black-Scholes<br />
option-pricing model with the following weighted-average assumptions:<br />
2000 1999 1998<br />
Dividend yield 3.5% 2.5% 2.5%<br />
Volatility 24.0% 22.0% 20.0%<br />
Risk-free interest rate 6.1% 5.3% 5.8%<br />
Expected term (years) 5.0 4.9 5.5<br />
Data regarding the company’s stock option plans follows:<br />
Shares<br />
Weighted-Average<br />
Exercise Price<br />
Per Share<br />
Shares under option April 30, 1997 33,074,848 $ 26.34<br />
Options granted 2,990,000 53.76<br />
Options exercised (10,283,073) 22.40<br />
Options surrendered (181,000) 34.22<br />
Shares under option April 29, 1998 25,600,775 $ 31.07<br />
Options granted 8,979,200 53.07<br />
Options exercised (3,138,445) 24.59<br />
Options surrendered (924,300) 40.11<br />
Shares under option April 28, 1999 30,517,230 $ 37.94<br />
Options granted 347,000 41.40<br />
Options exercised (858,283) 24.81<br />
Options surrendered (287,665) 44.70<br />
Shares under option May 3, 2000 29,718,282 $38.29<br />
Options exercisable at:<br />
April 29, 1998 14,397,175 $ 24.70<br />
April 28, 1999 13,507,295 27.60<br />
May 3, 2000 16,430,099 31.43<br />
(62)
The following summarizes information about shares under option in the respective exercise<br />
price ranges at May 3, 2000:<br />
Options Outstanding<br />
Options Exercisable<br />
Range of Exercise<br />
Price Per Share<br />
Number<br />
Outstanding<br />
Weighted-Average<br />
Remaining Life<br />
(Years)<br />
Weighted-Average<br />
Exercise Price<br />
Per Share<br />
Number<br />
Exercisable<br />
Weighted-Average<br />
Exercise Price<br />
Per Share<br />
$21.75 – 33.88 15,536,049 4.42 $27.00 12,902,472 $25.99<br />
36.75 – 48.38 3,591,333 7.01 41.13 1,079,967 39.54<br />
49.31 – 59.94 10,590,900 8.41 53.88 2,447,660 56.49<br />
29,718,282 16,430,099<br />
The shares authorized but not granted under the company’s stock option plans were 393,000<br />
at May 3, 2000 and 452,335 at April 28, 1999. Common stock reserved for options totaled<br />
30,111,282 at May 3, 2000 and 30,969,565 at April 28, 1999.<br />
The company’s management incentive plan covers officers and other key employees.<br />
Participants may elect to be paid on a current or deferred basis. The aggregate amount of all<br />
awards may not exceed certain limits in any year. Compensation under the management<br />
incentive plans was approximately $44 million in Fiscal 2000, $47 million in Fiscal 1999 and<br />
$46 million in Fiscal 1998.<br />
10. RETIREMENT PLANS The company maintains retirement plans for the majority of its employees. Current defined<br />
benefit plans are provided primarily for domestic union and foreign employees. Defined<br />
contribution plans are provided for the majority of its domestic non-union hourly and salaried<br />
employees.<br />
Total pension cost consisted of the following:<br />
(Dollars in thousands) 2000 1999 1998<br />
Components of defined benefit net periodic benefit cost:<br />
Service cost $ 27,352 $ 23,617 $ 21,038<br />
Interest cost 84,096 82,958 83,005<br />
Expected return on assets (121,735) (109,490) (103,421)<br />
Amortization of:<br />
Net initial asset (3,629) (3,632) (4,333)<br />
Prior service cost 8,067 8,026 8,466<br />
Net actuarial loss/(gain) 1,931 (3,752) (10,307)<br />
Loss due to curtailment, settlement and special<br />
termination benefits 27,908 60,485 6,482<br />
Net periodic benefit cost 23,990 58,212 930<br />
Defined contribution plans (excluding the ESOP) 20,558 23,980 23,571<br />
Total pension cost $ 44,548 $ 82,192 $ 24,501<br />
(63)
The following table sets forth the funded status of the company’s principal defined benefit plans<br />
at May 3, 2000 and April 28, 1999.<br />
(Dollars in thousands) 2000 1999<br />
Change in Benefit Obligation:<br />
Benefit obligation at the beginning of the year $1,387,043 $1,270,521<br />
Service cost 27,352 23,617<br />
Interest cost 84,096 82,958<br />
Participants’ contributions 6,895 7,044<br />
Amendments 20,505 18,625<br />
Actuarial (gain)/loss (34,023) 102,361<br />
Curtailment gain (939) (867)<br />
Settlement (15,976) (36,751)<br />
Special termination benefits 19,234 31,581<br />
Benefits paid (86,013) (86,615)<br />
Acquisition 78,729 –<br />
Exchange (29,493) (25,431)<br />
Benefit obligation at the end of the year 1,457,410 1,387,043<br />
Change in Plan Assets:<br />
Fair value of plan assets at the beginning of the year 1,440,357 1,444,080<br />
Actual return on plan assets 207,616 105,296<br />
Settlement (15,976) (36,751)<br />
Employer contribution 38,632 34,701<br />
Participants’ contributions 6,895 7,044<br />
Benefits paid (86,013) (86,615)<br />
Acquisition 102,396 –<br />
Exchange (36,483) (27,398)<br />
Fair value of plan assets at the end of the year 1,657,424 1,440,357<br />
Funded status 200,014 53,314<br />
Unamortized prior service cost 85,795 75,770<br />
Unamortized net actuarial (gain)/loss (35,529) 95,994<br />
Unamortized net initial asset (7,434) (11,501)<br />
Net amount recognized 242,846 213,577<br />
Amount recognized in the consolidated balance sheet consists of:<br />
Prepaid benefit cost 257,633 221,823<br />
Accrued benefit liability (46,537) (69,226)<br />
Intangible asset 3,402 3,189<br />
Accumulated other comprehensive loss 28,348 57,791<br />
Net amount recognized $ 242,846 $ 213,577<br />
The projected benefit obligation, accumulated benefit obligation and fair value of plan<br />
assets for plans with accumulated benefit obligations in excess of plan assets were<br />
$263.4 million, $231.3 million and $184.8 million, respectively, as of May 3, 2000<br />
and $278.8 million, $237.5 million and $168.3 million, respectively, as of April 28, 1999.<br />
(64)
The weighted-average rates used for the years ended May 3, 2000, April 28, 1999 and<br />
April 29, 1998 in determining the net pension costs and projected benefit obligations for<br />
defined benefit plans were as follows:<br />
2000 1999 1998<br />
Expected rate of return 9.5% 9.5% 9.6%<br />
Discount rate 6.8% 6.3% 6.9%<br />
Compensation increase rate 4.6% 4.7% 4.9%<br />
11. POSTRETIREMENT<br />
BENEFITS OTHER THAN<br />
PENSIONS AND OTHER<br />
POSTEMPLOYMENT<br />
BENEFITS<br />
The company and certain of its subsidiaries provide health care and life insurance benefits for<br />
retired employees and their eligible dependents. Certain of the company’s U.S. and Canadian<br />
employees may become eligible for such benefits. The company currently does not fund these<br />
benefit arrangements and may modify plan provisions or terminate plans at its discretion.<br />
Net postretirement costs consisted of the following:<br />
(Dollars in thousands) 2000 1999 1998<br />
Components of defined benefit net periodic benefit cost:<br />
Service cost $ 3,903 $ 3,603 $ 3,339<br />
Interest cost 10,475 10,483 11,280<br />
Amortization of:<br />
Prior service cost (655) (649) (5,633)<br />
Net actuarial gain (3,144) (3,430) (3,664)<br />
Loss due to curtailment and special termination<br />
benefits 1,536 3,732 1,085<br />
Net periodic benefit cost $12,115 $13,739 $ 6,407<br />
The following table sets forth the combined status of the company’s postretirement benefit<br />
plans at May 3, 2000 and April 28, 1999.<br />
(Dollars in thousands) 2000 1999<br />
Change in benefit obligation:<br />
Benefit obligation at the beginning of the year $ 158,488 $ 157,975<br />
Service cost 3,903 3,603<br />
Interest cost 10,475 10,483<br />
Participants’ contributions 889 858<br />
Actuarial loss/(gain) 6,644 (3,688)<br />
Curtailment (154) –<br />
Special termination benefits 1,389 2,779<br />
Benefits paid (11,864) (12,709)<br />
Exchange (220) (813)<br />
Benefit obligation at the end of the year 169,550 158,488<br />
Funded status (169,550) (158,488)<br />
Unamortized prior service cost (6,583) (6,711)<br />
Unamortized net actuarial gain (42,825) (52,826)<br />
Net accrued benefit liability $(218,958) $(218,025)<br />
(65)
The weighted-average discount rate used in the calculation of the accumulated postretirement<br />
benefit obligation and the net postretirement benefit cost was 7.7% in 2000, 6.9% in 1999<br />
and 1998. The assumed annual composite rate of increase in the per capita cost of companyprovided<br />
health care benefits begins at 7.2% for 2000, gradually decreases to 5.3% by 2007,<br />
and remains at that level thereafter. Assumed health care cost trend rates have a significant<br />
effect on the amounts reported for postretirement medical benefits. A one-percentage-point<br />
change in assumed health care cost trend rates would have the following effects:<br />
1% Increase 1% Decrease<br />
Effect on total service and interest cost components $ 1,537 $ (1,349)<br />
Effect on postretirement benefit obligation 15,860 (13,988)<br />
12. FINANCIAL<br />
INSTRUMENTS<br />
Interest Rate Swap Agreements: As of May 3, 2000, the company was party to an interest rate<br />
swap with a notional amount of £50 million and a settlement date of April 2001. The swap<br />
converts a 6.25% fixed rate exposure, on long-term debt maturing in 2030, to a floating rate<br />
exposure. As of April 28, 1999, no such agreements were outstanding.<br />
Foreign Currency Contracts: As of May 3, 2000 and April 28, 1999, the company held currency<br />
swap contracts with an aggregate notional amount of approximately $90 million and<br />
$110 million, respectively. As of May 3, 2000, these contracts mature in 2002. The company<br />
held separate contracts to purchase certain foreign currencies as of May 3, 2000 and April 28,<br />
1999 totaling approximately $490 million and $510 million, respectively, which mature within<br />
one year of the respective fiscal year-end. The company also held separate contracts to sell<br />
certain foreign currencies as of May 3, 2000 and April 28, 1999 of approximately $105 million<br />
and $390 million, respectively. As of May 3, 2000, these contracts mature in 2001 and 2002.<br />
Net unrealized gains and losses associated with the company’s foreign currency contracts as<br />
of May 3, 2000 and April 28, 1999 were not material.<br />
Commodity Contracts: As of May 3, 2000 and April 28, 1999, the notional values and unrealized<br />
gains or losses related to commodity contracts held by the company were not material.<br />
Fair Value of Financial Instruments: The company’s significant financial instruments include<br />
cash and cash equivalents, short- and long-term investments, short- and long-term debt,<br />
currency exchange agreements, interest rate swaps and guarantees.<br />
In evaluating the fair value of significant financial instruments, the company generally<br />
uses quoted market prices of the same or similar instruments or calculates an estimated fair<br />
value on a discounted cash flow basis using the rates available for instruments with the<br />
same remaining maturities. As of May 3, 2000 and April 28, 1999, the fair value of financial<br />
instruments held by the company approximated the recorded value.<br />
Concentrations of Credit Risk: Counterparties to currency exchange and interest rate derivatives<br />
consist of large major international financial institutions. The company continually monitors<br />
its positions and the credit ratings of the counterparties involved and, by policy, limits the<br />
amount of credit exposure to any one party. While the company may be exposed to potential<br />
losses due to the credit risk of non-performance by these counterparties, losses are not<br />
anticipated. Concentrations of credit risk with respect to accounts receivable are limited due<br />
to the large number of customers, generally short payment terms, and their dispersion across<br />
geographic areas.<br />
(66)
13. NET INCOME PER<br />
COMMON SHARE<br />
The following table sets forth the computation of basic and diluted earnings per share in<br />
accordance with the provisions of SFAS No. 128.<br />
Fiscal year ended May3,2000 April 28, 1999 April 29, 1998<br />
(Dollars in thousands, except per share amounts) (53 Weeks) (52 Weeks) (52 Weeks)<br />
Net income per share – basic:<br />
Net income $890,553 $474,341 $801,566<br />
Preferred dividends 26 30 37<br />
Net income applicable to common stock $890,527 $474,311 $801,529<br />
Average common shares outstanding – basic 355,273 361,204 365,982<br />
Net income per share – basic $ 2.51 $ 1.31 $ 2.19<br />
Net income per share – diluted:<br />
Net income $890,553 $474,341 $801,566<br />
Average common shares outstanding 355,273 361,204 365,982<br />
Effect of dilutive securities:<br />
Convertible preferred stock 218 243 297<br />
Stock options 4,604 6,383 6,674<br />
Average common shares outstanding – diluted 360,095 367,830 372,953<br />
Net income per share – diluted $ 2.47 $ 1.29 $ 2.15<br />
Stock options outstanding of 11.7 million, 6.0 million and 2.0 million as of May 3, 2000, April 28,<br />
1999 and April 29, 1998, respectively, were not included in the above net income per diluted<br />
share calculations because to do so would have been antidilutive for the periods presented.<br />
14. SEGMENT INFORMATION The company’s segments are primarily organized by geographical area. The composition<br />
of segments and measure of segment profitability is consistent with that used by the company’s<br />
management. Descriptions of the company’s reportable segments are as follows:<br />
North American Grocery & Foodservice – This segment consists of <strong>Heinz</strong> U.S.A., <strong>Heinz</strong> Pet<br />
Products, Star-Kist Seafood and <strong>Heinz</strong> Canada. This segment’s operations include products<br />
in all of the company’s core categories.<br />
North American Frozen – This segment consists of <strong>Heinz</strong> Frozen Food Company, which<br />
markets frozen potatoes, entrées and appetizers.<br />
Europe – This segment includes the company’s operations in Europe and sells products in<br />
all of the company’s core categories.<br />
Asia/Pacific – This segment includes the company’s operations in New Zealand, Australia,<br />
Japan, China, South Korea, Indonesia, Thailand and India. This segment’s operations<br />
include products in all of the company’s core categories.<br />
Other Operating Entities – This segment includes the company’s Weight Watchers classroom<br />
business through September 29, 1999, the date of divestiture, as well as the company’s<br />
operations in Africa, Venezuela and other areas which sell products in all of the company’s<br />
core categories.<br />
The company’s management evaluates performance based on several factors; however, the<br />
primary measurement focus is operating income excluding unusual costs and gains. The<br />
accounting policies used are the same as those described in Note 1, ‘‘Significant Accounting<br />
Policies.’’ Intersegment sales are accounted for at current market values. Items below the<br />
operating income line of the Consolidated Statements of Income are not presented by segment,<br />
since they are excluded from the measure of segment profitability reviewed by the company’s<br />
management.<br />
(67)
The following table presents information about the company’s reportable segments.<br />
Fiscal year ended May3,2000 April 28, 1999 April 29, 1998 May3,2000 April 28, 1999 April 29, 1998<br />
(Dollars in thousands) (53 Weeks) (52 Weeks) (52 Weeks) (53 Weeks) (52 Weeks) (52 Weeks)<br />
Net External Sales<br />
Intersegment Sales<br />
North American Grocery<br />
& Foodservice $4,124,060 $4,062,683 $3,935,269 $ 37,987 $ 32,144 $ 28,492<br />
North American Frozen 1,023,915 1,014,370 1,076,080 12,782 21,131 14,467<br />
Europe 2,583,684 2,460,698 2,332,594 2,687 6,661 3,756<br />
Asia/Pacific 1,196,049 1,011,764 1,072,856 2,853 13 –<br />
Other Operating Entities 480,241 750,095 792,485 2,526 6,971 6,298<br />
Non-Operating (a) – – – (58,835) (66,920) (53,013)<br />
Consolidated Totals $9,407,949 $9,299,610 $9,209,284 $ – $ – $ –<br />
Operating Income (Loss)<br />
Operating Income (Loss) Excluding Special Items (b)<br />
North American Grocery<br />
& Foodservice $ 694,449 $ 716,979 $ 797,191 $ 875,268 $ 834,629 $ 825,981<br />
North American Frozen 152,018 80,231 258,199 181,511 183,409 170,732<br />
Europe 364,207 246,187 386,874 502,302 467,159 405,425<br />
Asia/Pacific 124,125 89,830 136,501 177,454 145,654 142,348<br />
Other Operating Entities 540,155 95,715 53,677 77,004 121,950 63,586<br />
Non-Operating (a) (141,855) (119,630) (112,112) (102,337) (99,792) (100,219)<br />
Consolidated Totals $1,733,099 $1,109,312 $1,520,330 $1,711,202 $1,653,009 $1,507,853<br />
Depreciation and Amortization Expense<br />
Capital Expenditures (c)<br />
North American Grocery<br />
& Foodservice $133,471 $121,363 $117,739 $171,295 $138,081 $121,783<br />
North American Frozen 36,480 39,773 41,855 79,575 35,293 34,244<br />
Europe 81,802 85,408 84,583 127,595 100,569 90,829<br />
Asia/Pacific 28,871 20,549 30,406 60,795 25,209 53,856<br />
Other Operating Entities 13,066 23,278 28,291 8,495 12,757 40,076<br />
Non-Operating (a) 12,793 11,841 10,748 4,689 4,814 32,966<br />
Consolidated Totals $306,483 $302,212 $313,622 $452,444 $316,723 $373,754<br />
Identifiable Assets<br />
North American Grocery<br />
& Foodservice $3,711,691 $3,418,096 $3,248,068<br />
North American Frozen 882,225 832,226 918,807<br />
Europe 2,781,238 2,208,208 2,230,857<br />
Asia/Pacific 1,085,491 998,685 839,176<br />
Other Operating Entities 187,684 374,852 564,391<br />
Non-Operating (d) 202,328 221,567 222,122<br />
Consolidated Totals $8,850,657 $8,053,634 $8,023,421<br />
(a) Includes corporate overhead, intercompany eliminations and charges not directly attributable to operating segments.<br />
(b) Fiscal year ended May 3, 2000: Excludes net restructuring and implementation costs of Operation Excel as follows: North American Grocery & Foodservice<br />
$160.8 million, North American Frozen $29.5 million, Europe $138.1 million, Asia/Pacific $53.3 million, Other Operating Entities $1.5 million and Non-Operating<br />
$9.5 million. Excludes costs related to Ecuador in North American Grocery & Foodservice $20.0 million. Excludes the gain on the sale of the Weight Watchers classroom<br />
business in Other Operating Entities $464.6 million. Excludes the Foundation contribution in Non-Operating $30.0 million.<br />
Fiscal year ended April 28, 1999: Excludes restructuring and implementation costs of Operation Excel as follows: North American Grocery & Foodservice<br />
$110.4 million, North American Frozen $116.9 million, Europe $225.1 million, Asia/Pacific $52.9 million, Other Operating Entities $29.2 million and Non-Operating<br />
$18.3 million. Excludes costs related to the implementation of Project Millennia as follows: North American Grocery & Foodservice $7.2 million, North American Frozen<br />
$2.9 million, Europe $4.9 million, Asia/Pacific $3.0 million, Other Operating Entities $2.8 million and Non-Operating $1.5 million. Excludes the gain on the sale of the<br />
bakery division in Other Operating Entities of $5.7 million. Excludes the reversal of unutilized Project Millennia accruals for severance and exit costs in North American<br />
Frozen and Europe of $16.6 million and $9.1 million, respectively.<br />
Fiscal year ended April 29, 1998: Excludes costs related to the implementation of Project Millennia as follows: North American Grocery & Foodservice $28.8 million,<br />
North American Frozen $9.1 million, Europe $18.6 million, Asia/Pacific $5.8 million, Other Operating Entities $9.9 million and Non-Operating $11.9 million. Excludes<br />
the North American Frozen gain on the sale of the Ore-Ida frozen foodservice business of $96.6 million.<br />
(c) Excludes property, plant and equipment obtained through acquisitions.<br />
(d) Includes identifiable assets not directly attributable to operating segments.<br />
(68)
The company’s revenues are generated via the sale of products in the following categories:<br />
(Unaudited)<br />
Fiscal year ended May3,2000 April 28, 1999 April 29, 1998<br />
(Dollars in thousands) (53 Weeks) (52 Weeks) (52 Weeks)<br />
Ketchup, condiments and sauces $2,439,109 $2,230,403 $2,046,578<br />
Frozen foods 1,561,488 1,399,111 1,473,228<br />
Tuna 1,059,317 1,084,847 1,080,576<br />
Soups, beans and pasta meals 1,197,466 1,117,328 1,085,438<br />
Infant foods 1,041,401 1,039,781 986,203<br />
Pet products 1,237,671 1,287,356 1,315,774<br />
Other 871,497 1,140,784 1,221,487<br />
Total $9,407,949 $9,299,610 $9,209,284<br />
The company has significant sales and long-lived assets in the following geographic areas.<br />
Sales are based on the location in which the sale originated. Long-lived assets include property,<br />
plant and equipment, goodwill, trademarks and other intangibles, net of related depreciation<br />
and amortization.<br />
Net External Sales<br />
Long-Lived Assets<br />
Fiscal year ended May3,2000 April 28, 1999 April 29, 1998 May3,2000 April 28, 1999 April 29, 1998<br />
(Dollars in thousands) (53 Weeks) (52 Weeks) (52 Weeks)<br />
United States $4,848,125 $4,917,967 $4,873,710 $2,705,735 $2,856,315 $2,885,359<br />
United Kingdom 1,314,550 1,182,690 1,170,935 549,213 399,669 491,850<br />
Other 3,245,274 3,198,953 3,164,639 1,515,535 1,385,404 1,393,505<br />
Total $9,407,949 $9,299,610 $9,209,284 $4,770,483 $4,641,388 $4,770,714<br />
15. QUARTERLY RESULTS<br />
(UNAUDITED)<br />
2000<br />
(Dollars in thousands,<br />
except per share amounts)<br />
First<br />
(13 Weeks)<br />
Second<br />
(13 Weeks)<br />
Third<br />
(13 Weeks)<br />
Fourth<br />
(14 Weeks)<br />
Total<br />
(53 Weeks)<br />
Sales $2,181,007 $2,344,084 $2,294,637 $2,588,221 $9,407,949<br />
Gross profit 856,750 912,440 902,750 947,484 3,619,424<br />
Net income 206,668 415,498 171,112 97,275 890,553<br />
Per Share Amounts:<br />
Net income – diluted $ 0.57 $ 1.14 $ 0.47 $ 0.27 $ 2.47<br />
Net income – basic 0.58 1.16 0.48 0.27 2.51<br />
Cash dividends 0.34 1 4 ⁄ 0.36 3 4 ⁄ 0.36 3 4 ⁄ 0.36 3 4 ⁄ 1.44 1 ⁄ 2<br />
1999<br />
(Dollars in thousands,<br />
except per share amounts)<br />
First<br />
(13 Weeks)<br />
Second<br />
(13 Weeks)<br />
Third<br />
(13 Weeks)<br />
Fourth<br />
(13 Weeks)<br />
Total<br />
(52 Weeks)<br />
Sales $2,228,230 $2,322,402 $2,282,062 $2,466,916 $9,299,610<br />
Gross profit 868,453 936,399 852,580 697,311 3,354,743<br />
Net income (loss) 213,787 231,332 120,554 (91,332) 474,341<br />
Per Share Amounts:<br />
Net income (loss) – diluted $ 0.58 $ 0.63 $ 0.33 $ (0.25) $ 1.29<br />
Net income (loss) – basic 0.59 0.64 0.33 (0.25) 1.31<br />
Cash dividends 0.31 1 ⁄2 0.34 1 ⁄4 0.34 1 ⁄4 0.34 1 ⁄4 1.34 1 ⁄4<br />
(69)
The first quarter of Fiscal 2000 includes restructuring and implementation costs related to<br />
Operation Excel of $0.07 per share, costs related to Ecuador of $0.05 per share and the gain<br />
on the sale of an office building in the U.K. of $0.03 per share. The first quarter of Fiscal 1999<br />
includes implementation costs related to Project Millennia of $0.02 per share.<br />
The second quarter of Fiscal 2000 includes restructuring and implementation costs related<br />
to Operation Excel of $0.17 per share, the gain on the sale of the Weight Watchers classroom<br />
business of $0.72 per share (see Note 3 to the Consolidated Financial Statements) and a pretax<br />
contribution to the H.J. <strong>Heinz</strong> Company Foundation of $0.05 per share. The second quarter<br />
of Fiscal 1999 includes implementation costs related to Project Millennia of $0.01 per share,<br />
reversal of unutilized Project Millennia accruals for severance and exit costs of $0.04 per share<br />
(see Note 4 to the Consolidated Financial Statements) and the gain on the sale of the bakery<br />
products unit (see Note 3 to the Consolidated Financial Statements).<br />
The third quarter includes restructuring and implementation costs related to Operation<br />
Excel of $0.15 per share in Fiscal 2000 and $0.27 in Fiscal 1999.<br />
The fourth quarter of Fiscal 2000 includes restructuring and implementation costs related<br />
to Operation Excel of $0.40 per share and a reversal of Fiscal 1999 Operation Excel accruals<br />
and asset write-downs of $0.04 per share, for net restructuring and implementation costs of<br />
$0.36 per share. The fourth quarter of Fiscal 1999 includes restructuring and implementation<br />
costs related to Operation Excel of $0.84 per share.<br />
16. COMMITMENTS AND<br />
CONTINGENCIES<br />
Legal Matters: Certain suits and claims have been filed against the company and have not<br />
been finally adjudicated. These suits and claims when finally concluded and determined, in<br />
the opinion of management, based upon the information that it presently possesses, will not<br />
have a material adverse effect on the company’s consolidated financial position, results of<br />
operations or liquidity.<br />
Lease Commitments: Operating lease rentals for warehouse, production and office facilities<br />
and equipment amounted to approximately $111.1 million in 2000, $99.5 million in 1999<br />
and $98.3 million in 1998. Future lease payments for non-cancellable operating leases as of<br />
May 3, 2000 totaled $182.4 million (2001–$38.5 million, 2002–$29.5 million, 2003–$22.0 million,<br />
2004–$19.7 million, 2005–$15.4 million and thereafter–$57.3 million).<br />
17. ADVERTISING COSTS Advertising costs for fiscal years 2000, 1999 and 1998 were $374.0 million, $373.9 million and<br />
$363.1 million, respectively.<br />
(70)
RESPONSIBILITY STATEMENTS<br />
RESPONSIBILITY FOR FINANCIAL STATEMENTS<br />
REPORT OF INDEPENDENT ACCOUNTANTS<br />
Management of H.J. <strong>Heinz</strong> Company is responsible for<br />
the preparation of the financial statements and other<br />
information included in this annual report. The financial<br />
statements have been prepared in conformity with<br />
generally accepted accounting principles, incorporating<br />
management’s best estimates and judgments, where<br />
applicable.<br />
Management believes that the company’s internal<br />
control systems provide reasonable assurance that<br />
assets are safe-guarded, transactions are recorded and<br />
reported appropriately, and policies are followed. The<br />
concept of reasonable assurance recognizes that the cost<br />
of a control procedure should not exceed the expected<br />
benefits. Management believes that its systems provide<br />
this appropriate balance. An important element of<br />
the company’s control systems is the ongoing program<br />
to promote control consciousness throughout the<br />
organization. Management’s commitment to this program<br />
is emphasized through written policies and procedures<br />
(including a code of conduct), an effective internal audit<br />
function and a qualified financial staff.<br />
The company engages independent public accountants<br />
who are responsible for performing an independent audit<br />
of the financial statements. Their report, which appears<br />
herein, is based on obtaining an understanding of the<br />
company’s accounting systems and procedures and testing<br />
them as they deem necessary.<br />
The company’s Audit Committee is composed entirely<br />
of outside directors. The Audit Committee meets regularly,<br />
and when appropriate separately, with the independent<br />
public accountants, the internal auditors and financial<br />
management to review the work of each and to satisfy<br />
itself that each is discharging its responsibilities properly.<br />
Both the independent public accountants and the internal<br />
auditors have unrestricted access to the Audit Committee.<br />
To the Shareholders of<br />
H.J. <strong>Heinz</strong> Company:<br />
In our opinion, the accompanying consolidated balance<br />
sheets and the related consolidated statements of income,<br />
shareholders’ equity and cash flows present fairly, in<br />
all material respects, the financial position of H.J. <strong>Heinz</strong><br />
Company and its subsidiaries (the ‘‘Company’’) at May 3,<br />
2000 and April 28, 1999, and the results of its operations<br />
and its cash flows for each of the three years in the period<br />
ended May 3, 2000, in conformity with accounting<br />
principles generally accepted in the United States.<br />
These financial statements are the responsibility of the<br />
Company’s management; our responsibility is to express<br />
an opinion on these financial statements based on our<br />
audits. We conducted our audits of these statements in<br />
accordance with auditing standards generally accepted in<br />
the United States, which require that we plan and perform<br />
the audit to obtain reasonable assurance about whether<br />
the financial statements are free of material misstatement.<br />
An audit includes examining, on a test basis, evidence<br />
supporting the amounts and disclosures in the financial<br />
statements, assessing the accounting principles used and<br />
significant estimates made by management, and evaluating<br />
the overall financial statement presentation. We believe<br />
that our audits provide a reasonable basis for the opinion<br />
expressed above.<br />
Pittsburgh, Pennsylvania<br />
June 14, 2000<br />
(71)
ELEVEN-YEAR SUMMARY OF OPERATIONS AND OTHER RELATED DATA<br />
H.J. <strong>Heinz</strong> Company and Subsidiaries<br />
(Dollars in thousands, except per share amounts) 2000* 1999 1998 1997<br />
SUMMARY OF OPERATIONS:<br />
Sales $9,407,949 $9,299,610 $9,209,284 $9,357,007<br />
Cost of products sold 5,788,525 5,944,867 5,711,213 6,385,091<br />
Interest expense 269,748 258,813 258,616 274,746<br />
Provision for income taxes 573,123 360,790 453,415 177,193<br />
Income before cumulative effect of accounting change 890,553 474,341 801,566 301,871<br />
Cumulative effect of SFAS No. 106 adoption – – – –<br />
Net income 890,553 474,341 801,566 301,871<br />
Income per share before cumulative effect of accounting<br />
change – diluted 2.47 1.29 2.15 0.81<br />
Cumulative effect of SFAS No. 106 adoption – – – –<br />
Net income per share – diluted 2.47 1.29 2.15 0.81<br />
Net income per share – basic 2.51 1.31 2.19 0.82<br />
OTHER RELATED DATA:<br />
Dividends paid:<br />
Common 513,756 484,817 452,566 416,923<br />
per share 1.44 1 ⁄ 2 1.34 1 ⁄4 1.23 1 ⁄2 1.13 1 ⁄2<br />
Preferred 26 30 37 43<br />
Average common shares outstanding – diluted 360,095,455 367,830,419 372,952,851 374,043,705<br />
Average common shares outstanding – basic 355,272,696 361,203,539 365,982,290 367,470,850<br />
Number of employees 46,900 38,600 40,500 44,700<br />
Capital expenditures 452,444 316,723 373,754 377,457<br />
Depreciation and amortization expense 306,483 302,212 313,622 340,490<br />
Total assets 8,850,657 8,053,634 8,023,421 8,437,787<br />
Total debt 4,112,401 3,376,413 3,107,903 3,447,435<br />
Shareholders’ equity 1,595,856 1,803,004 2,216,516 2,440,421<br />
Pretax return on average invested capital 31.4% 20.4% 26.4% 11.9%<br />
Return on average shareholders’ equity before cumulative<br />
effect of accounting change 52.4% 23.6% 34.4% 11.7%<br />
Book value per common share 4.59 5.02 6.10 6.64<br />
Price range of common stock:<br />
High 54 61 3 ⁄4 59 15 ⁄16 44 7 ⁄8<br />
Low 30 13 ⁄ 16 44 9 ⁄16 41 1 ⁄8 29 3 ⁄4<br />
The 2000 results include, on a pretax basis, net restructuring and implementation costs of $392.7 million for Operation Excel, a contribution of<br />
$30.0 million to the H.J. <strong>Heinz</strong> Company Foundation, costs related to Ecuador of $20.0 million, a gain of $464.6 million on the sale of the Weight<br />
Watchers classroom business and a gain of $18.2 million on the sale of an office building in the U.K.<br />
The 1999 results include, on a pretax basis, restructuring and implementation costs of $552.8 million for Operation Excel and costs of $22.3 million<br />
related to the implementation of Project Millennia, offset by the reversal of unutilized Project Millennia accruals for severance and exit costs of<br />
$25.7 million and a gain of $5.7 million on the sale of the bakery products unit.<br />
The 1998 results include costs of $84.1 million pretax related to the implementation of Project Millennia, offset by the gain on the sale of the Ore-Ida<br />
frozen foodservice business, $96.6 million pretax.<br />
The 1997 results include a pretax charge for Project Millennia restructuring and implementation costs of $647.2 million, offset by capital gains<br />
of $85.3 million from the sale of non-strategic assets in New Zealand and the U.K. The 1994 results include a pretax gain of $127.0 million relating<br />
to the divestiture of the confectionery and specialty rice businesses. The 1993 results include a pretax restructuring charge of $192.3 million.<br />
The 1992 results include a pretax gain of $221.5 million for the sale of The Hubinger Company, a pretax restructuring charge of $88.3 million<br />
and a pretax pension curtailment gain of $38.8 million.<br />
*Fiscal year consisted of 53 weeks.<br />
(72)
1996 1995* 1994 1993 1992 1991 1990<br />
$9,112,265 $8,086,794 $7,046,738 $7,103,374 $6,581,867 $6,647,118 $6,085,687<br />
5,775,357 5,119,597 4,381,745 4,530,563 4,102,816 4,063,423 3,726,613<br />
277,411 210,585 149,243 146,491 134,948 137,592 108,542<br />
364,342 346,982 319,442 185,838 346,050 335,014 306,979<br />
659,319 591,025 602,944 529,943 638,295 567,999 504,451<br />
– – – (133,630) – – –<br />
659,319 591,025 602,944 396,313 638,295 567,999 504,451<br />
1.75 1.58 1.56 1.36 1.59 1.42 1.26<br />
– – – (0.34) – – –<br />
1.75 1.58 1.56 1.02 1.59 1.42 1.26<br />
1.79 1.61 1.59 1.04 1.65 1.48 1.32<br />
381,871 345,358 325,887 297,009 270,512 239,212 207,387<br />
1.03 1 ⁄2 0.94 0.86 0.78 0.70 0.62 0.54<br />
56 64 71 78 86 91 113<br />
377,606,606 373,317,480 385,778,757 390,374,298 400,267,734 400,696,424 399,980,757<br />
368,799,645 367,685,810 378,483,701 380,728,905 386,331,811 384,983,564 383,507,801<br />
43,300 42,200 35,700 37,700 35,500 34,100 37,300<br />
334,787 341,788 275,052 430,713 331,143 345,334 355,317<br />
343,809 315,267 259,809 234,935 211,786 196,138 168,523<br />
8,623,691 8,247,188 6,381,146 6,821,321 5,931,901 4,935,382 4,487,451<br />
3,363,828 3,401,076 2,166,703 2,613,736 1,902,483 1,226,694 1,256,607<br />
2,706,757 2,472,869 2,338,551 2,320,996 2,367,398 2,274,863 1,886,899<br />
21.0% 21.4% 21.9% 18.1% 27.6% 30.3% 30.4%<br />
25.5% 24.6% 25.9% 22.0% 27.5% 27.3% 27.5%<br />
7.34 6.76 6.26 6.08 6.21 5.84 4.96<br />
36 5 ⁄8 28 5 ⁄8 26 5 ⁄8 30 3 ⁄8 32 3 ⁄8 27 3 ⁄8 23 7 ⁄8<br />
27 5 ⁄8 21 1 ⁄8 20 1 ⁄2 23 1 ⁄2 23 3 ⁄8 19 5 ⁄8 16 3 ⁄8<br />
(73)
DIRECTORS AND OFFICERS*<br />
H.J. <strong>Heinz</strong> Company<br />
DIRECTORS<br />
Anthony J.F. O’Reilly<br />
Chairman of the Board.<br />
Director since 1971. (6)<br />
William R. Johnson<br />
President and<br />
Chief Executive Officer.<br />
Director since 1993. (1,5)<br />
Nicholas F. Brady<br />
Chairman and President, Darby<br />
Advisors, Inc. and Chairman,<br />
Darby Overseas Investments,<br />
Ltd., Easton, Maryland.<br />
Director from 1987 through<br />
September 1988.<br />
Reelected 1993. (3,4)<br />
Mary C. Choksi<br />
Managing Director, Strategic<br />
Investment Partners, Inc. and<br />
Emerging Markets Investors<br />
Corporation, Washington, D.C.<br />
Director since 1998. (4,6)<br />
Leonard S. Coleman, Jr.<br />
Senior Advisor–Major League<br />
Baseball, New York, New York.<br />
Director since 1998. (4,6)<br />
Edith E. Holiday<br />
Attorney and Director,<br />
Various Corporations.<br />
Director since 1994. (3,4,6)<br />
Samuel C. Johnson<br />
Nonexecutive Chairman,<br />
S.C. Johnson & Son, Inc.,<br />
Racine, Wisconsin.<br />
Director since 1988. (2,4)<br />
Candace Kendle<br />
Chairman and Chief Executive<br />
Officer, Kendle International Inc.,<br />
Cincinnati, Ohio.<br />
Director since 1998. (2,3)<br />
Donald R. Keough<br />
Chairman of the Board,<br />
Allen & Co. Incorporated,<br />
New York, New York.<br />
Director since 1990. (2,3)<br />
Dean R. O’Hare<br />
Chairman and Chief Executive<br />
Officer, The Chubb Corporation,<br />
Warren, New Jersey.<br />
Director since July 2000.<br />
* As of July 2000.<br />
Paul F. Renne<br />
Executive Vice President<br />
and Chief Financial Officer.<br />
Director since 1997. (1,5)<br />
A.G. Malcolm Ritchie<br />
Executive Vice President.<br />
Director since 1998. (1)<br />
Herman J. Schmidt<br />
Independent Businessman.<br />
Director since 1977. (2,3,4,6)<br />
Eleanor B. Sheldon<br />
Social Scientist.<br />
Director since 1979. (2,4,6)<br />
William P. Snyder III<br />
President, The Wilpen Group,<br />
Inc., Pittsburgh, Pennsylvania.<br />
Director since 1961. (2,3,4)<br />
S. Donald Wiley<br />
Vice Chairman, H.J. <strong>Heinz</strong><br />
Company Foundation.<br />
Director from 1972 through<br />
September 1990.<br />
Reelected 1991. (6)<br />
David R. Williams<br />
Executive Vice President.<br />
Director since 1992. (1,5)<br />
James M. Zimmerman<br />
Chairman and Chief Executive<br />
Officer, Federated Department<br />
Stores, Inc., Cincinnati, Ohio.<br />
Director since 1998. (2,3)<br />
COMMITTEES OF THE BOARD<br />
(1) Executive Committee<br />
(2) Management Development and<br />
Compensation Committee<br />
(3) Nominating Committee<br />
(4) Audit Committee<br />
(5) Investment Committee<br />
(6) Public Issues Committee<br />
OFFICERS<br />
William R. Johnson<br />
President and<br />
Chief Executive Officer<br />
Paul F. Renne<br />
Executive Vice President<br />
and Chief Financial Officer<br />
A.G. Malcolm Ritchie<br />
Executive Vice President<br />
(74)<br />
Richard H. Wamhoff<br />
Executive Vice President<br />
David R. Williams<br />
Executive Vice President<br />
Michael J. Bertasso<br />
Senior Vice President–Strategy,<br />
Process and Business<br />
Development<br />
William C. Goode III<br />
Senior Vice President and<br />
Chief Administrative Officer<br />
Michael D. Milone<br />
Senior Vice President–Global<br />
Category Development<br />
D. Edward I. Smyth<br />
Senior Vice President–Corporate<br />
and Government Affairs<br />
Laura Stein<br />
Senior Vice President and<br />
General Counsel<br />
R. Scott Allen<br />
Vice President and<br />
Chief Procurement Officer<br />
Theodore N. Bobby<br />
Vice President–Legal Affairs<br />
John C. Crowe<br />
Vice President–Taxes<br />
Steven C. Morelli<br />
Vice President and<br />
Chief Information Officer<br />
Diane Owen<br />
Vice President–Corporate Audit<br />
Lelio G. Parducci<br />
Vice President–Nutrition &<br />
Technical Affairs and Chief<br />
Scientist<br />
Mitchell A. Ring<br />
Vice President–Business<br />
Development<br />
John Runkel<br />
Vice President–Investor Relations<br />
William R. Showalter<br />
Vice President and<br />
Corporate Controller<br />
Karyll A. Davis<br />
Corporate Secretary<br />
F. Nicholas Grasberger III<br />
Treasurer
WORLD LOCATIONS*<br />
H.J. <strong>Heinz</strong> Company and Subsidiaries<br />
WORLD HEADQUARTERS<br />
600 Grant Street, Pittsburgh, Pennsylvania.<br />
THE AMERICAS<br />
HEINZ NORTH AMERICA<br />
<strong>Heinz</strong> U.S.A. Established 1869. Pittsburgh, Pennsylvania.<br />
Thermo Pac, Inc. Acquired 1999. Stone Mountain,<br />
Georgia.<br />
Portion Pac, Inc. Acquired 1989. Mason, Ohio.<br />
Quality Chef Foods, Inc. Acquired 1999.<br />
Cedar Rapids, Iowa.<br />
Chef Francisco, Inc. Acquired 1991. King of Prussia,<br />
Pennsylvania.<br />
Escalon Premier Brands, Inc. Acquired 1989.<br />
Escalon, California.<br />
Star-Kist Foods, Inc. Acquired 1963. Pittsburgh,<br />
Pennsylvania.<br />
<strong>Heinz</strong> Pet Products. Established 1988. Pittsburgh,<br />
Pennsylvania.<br />
StarKist Seafood. Established 1988. Pittsburgh,<br />
Pennsylvania.<br />
Star-Kist Caribe, Inc. Acquired 1963. Mayaguez,<br />
Puerto Rico.<br />
Star-Kist Samoa, Inc. Acquired 1963. Pago Pago,<br />
American Samoa.<br />
Empresa Pesquera Ecuatoriana. Acquired 1991.<br />
Guayaquil, Ecuador.<br />
H.J. <strong>Heinz</strong> Company of Canada Ltd. Established 1909.<br />
North York, Ontario, Canada.<br />
Omstead Foods Limited. Acquired 1991. Wheatley,<br />
Ontario, Canada.<br />
Martin Pet Foods. Acquired 1996. Elmira, Ontario,<br />
Canada.<br />
<strong>Heinz</strong> Frozen Food Company. Established 1998.<br />
Pittsburgh, Pennsylvania.<br />
Alimentos <strong>Heinz</strong> C.A. Established 1959. Caracas,<br />
Venezuela.<br />
* As of May 3, 2000.<br />
EUROPE, MIDDLE EAST AND AFRICA<br />
H.J. <strong>Heinz</strong> European Grocery. Established 1995. Stockley<br />
Park, Middlesex, England.<br />
H.J. <strong>Heinz</strong> Company Limited. Established 1917.<br />
Stockley Park, Middlesex, England.<br />
H.J. <strong>Heinz</strong> B.V. Acquired 1958. Elst, Gelderland,<br />
The Netherlands.<br />
H.J. <strong>Heinz</strong> Branch Belgium. Established 1984.<br />
Brussels, Belgium.<br />
H.J. <strong>Heinz</strong> GmbH. Established 1970.<br />
Cologne, Germany.<br />
Sonnen Bassermann. Acquired 1998.<br />
Seesen, Germany.<br />
<strong>Heinz</strong> Iberica, S.A. Established 1987. Madrid, Spain.<br />
IDAL (Industrias de Alimentação, Lda). Acquired<br />
1965. Lisbon, Portugal.<br />
COPAIS Food and Beverage S.A. Acquired 1990.<br />
Athens, Greece.<br />
<strong>Heinz</strong> Polska Sp. Z.O.O. Established 1994.<br />
Warsaw, Poland.<br />
Cairo Food Industries SAE. Established 1992.<br />
Cairo, Egypt.<br />
H.J. <strong>Heinz</strong> European Infant Feeding. Established 1999.<br />
Stockley Park, Middlesex, England.<br />
<strong>Heinz</strong> Italia S.r.l. (formerly Plasmon Dietetici<br />
Alimentari S.r.l.). Acquired 1963. Milan, Italy.<br />
H.J. <strong>Heinz</strong> Company Limited. Established 1917.<br />
Stockley Park, Middlesex, England.<br />
Farley’s Healthcare Products. Established 1994.<br />
Kendal, Cumbria, England.<br />
H.J. <strong>Heinz</strong> Company C.I.S. Established 1994.<br />
Moscow, Russia.<br />
<strong>Heinz</strong> Remedia Limited. Established 1999.<br />
Tel Aviv, Israel.<br />
H.J. <strong>Heinz</strong> European Foodservice. Established 1997.<br />
Stockley Park, Middlesex, England.<br />
<strong>Heinz</strong> Single Serve Limited. Acquired 1995.<br />
Telford, England.<br />
Serv-A-Portion. Acquired 1999. Turnhout, Belgium.<br />
AIAL (Arimpex Industrie Alimentari S.r.l.). Acquired<br />
1992. Rovereto, Italy.<br />
Dega S.r.l. Acquired 1994. Rovereto, Italy.<br />
(75)
H.J. <strong>Heinz</strong> Frozen and Chilled Foods Limited. Acquired<br />
1999. Dublin, Ireland.<br />
H.J. <strong>Heinz</strong> European Frozen and Chilled Foods<br />
Limited. Established 1993. Dundalk, Ireland.<br />
H.J. <strong>Heinz</strong> European Frozen and Chilled Foods<br />
Limited. Incorporated 1966. Dublin, Ireland.<br />
H.J. <strong>Heinz</strong> European Seafood. Established 1997.<br />
Paris, France.<br />
H.J. <strong>Heinz</strong> Company Limited. Established 1917.<br />
Stockley Park, Middlesex, England.<br />
John West Foods Limited. Acquired 1997.<br />
Liverpool, England.<br />
Pioneer Food Cannery Ltd. Acquired 1995.<br />
Tema, Ghana.<br />
H.J. <strong>Heinz</strong> S.A.R.L. Established 1979. Paris, France.<br />
Indian Ocean Tuna, Ltd. Acquired 1995. Victoria,<br />
Republic of Seychelles.<br />
Ets. Paul Paulet S.A. Acquired 1981. Douarnenez,<br />
France.<br />
IDAL (Industrias de Alimentação, Lda.) Fish Division.<br />
Acquired 1988. Peniche, Portugal.<br />
Mareblu S.r.l. Acquired 1996. Latina, Italy.<br />
H.J. <strong>Heinz</strong> Central Eastern Europe. Established 1994.<br />
H.J. <strong>Heinz</strong> Company C.I.S. Established 1994.<br />
Moscow, Russia.<br />
<strong>Heinz</strong> Polska Sp. Z.O.O. Established 1994.<br />
Warsaw, Poland.<br />
Pudliszki S.A. Acquired 1997. Pudliszki, Poland.<br />
H.J. <strong>Heinz</strong> Southern Africa (Proprietary) Limited.<br />
Established 1995. Johannesburg, South Africa.<br />
H.J. <strong>Heinz</strong> (Botswana) (Proprietary) Ltd. Formed<br />
1988. Gaborone, Botswana.<br />
Kgalagadi Soap Industries (Pty) Ltd. Acquired 1988.<br />
Gaborone, Botswana.<br />
Refined Oil Products (Pty) Ltd. Formed 1987.<br />
Gaborone, Botswana.<br />
Olivine Industries (Private) Limited. Acquired 1982.<br />
Harare, Zimbabwe.<br />
Chegutu Canners (Pvt) Ltd. Established 1992.<br />
Chegutu, Zimbabwe.<br />
<strong>Heinz</strong> South Africa (Pty) Ltd. Established 1995.<br />
Johannesburg, South Africa.<br />
Pets Products (Pty) Limited. Acquired 1997.<br />
Cape Town, South Africa.<br />
<strong>Heinz</strong> Frozen Foods (Pty) Ltd. Established 1995.<br />
Klerksdorp, South Africa.<br />
<strong>Heinz</strong> Wellington’s (Pty) Ltd. Acquired 1997.<br />
Wellington, South Africa.<br />
PACIFIC RIM AND SOUTHWEST ASIA<br />
<strong>Heinz</strong> Wattie’s Australasia. Established 1998.<br />
H.J. <strong>Heinz</strong> Company Australia Ltd. Established 1935.<br />
Doveton, Victoria, Australia.<br />
<strong>Heinz</strong>-Wattie’s Limited. Acquired 1992. Auckland,<br />
New Zealand.<br />
Tegel Foods Ltd. Acquired 1992. Newmarket,<br />
Auckland, New Zealand.<br />
<strong>Heinz</strong> Japan Ltd. Established 1961. Tokyo, Japan.<br />
<strong>Heinz</strong>-UFE Ltd. Established 1984. Guangzhou, People’s<br />
Republic of China.<br />
<strong>Heinz</strong> Cosco. Established 1999. Qingdao, People’s Republic<br />
of China.<br />
Seoul-<strong>Heinz</strong> Ltd. Established 1986. Inchon, South Korea.<br />
<strong>Heinz</strong> Win Chance Ltd. Established 1987.<br />
Bangkok, Thailand.<br />
<strong>Heinz</strong> India (Private) Limited. Acquired 1994.<br />
Mumbai, India.<br />
PT <strong>Heinz</strong> ABC Indonesia. Established 1999.<br />
Jakarta, Indonesia.<br />
PT <strong>Heinz</strong> Suprama. Acquired 1997. Surabaya, Indonesia.<br />
<strong>Heinz</strong> UFC Philippines. Established 2000. Manila,<br />
The Philippines.<br />
<strong>Heinz</strong> Hong Kong Limited. Established 2000. Wanchai,<br />
Hong Kong.<br />
(76)
CORPORATE DATA<br />
<strong>Heinz</strong>: A Definition H.J. <strong>Heinz</strong> Company is one of the<br />
world’s leading marketers of branded foods to retail<br />
and foodservice channels. <strong>Heinz</strong> has number-one<br />
or number-two branded businesses in more than<br />
50 world markets.<br />
Among the company’s famous brands are <strong>Heinz</strong><br />
(a global mega-brand approaching $3 billion in annual<br />
sales), Ore-Ida, Smart Ones, Weight Watchers, Boston<br />
Market, Bagel Bites, The Budget Gourmet, Wattie’s,<br />
Linda McCartney, San Marco, Go Ahead!, 9-Lives,<br />
Skippy, Kibbles ’n Bits, Pounce, Wagwells, Nature’s<br />
Recipe, Farley’s, Plasmon, BioDieterba, StarKist, John<br />
West, Petit Navire, Greenseas, UFC, Orlando, ABC,<br />
Olivine and Pudliszki.<br />
<strong>Heinz</strong> provides employment for approximately<br />
46,900 people full-time, plus thousands of others on<br />
a part-time basis and during seasonal peaks.<br />
Annual Meeting The annual meeting of the company’s<br />
shareholders will be held at 2:00 p.m. on Tuesday,<br />
September 12, 2000 in Pittsburgh at <strong>Heinz</strong> Hall for the<br />
Performing Arts.<br />
Copies of This Publication and Others Mentioned on<br />
This Page are available from the Corporate Affairs<br />
Department at the <strong>Heinz</strong> World Headquarters address<br />
or by calling (412) 456-6000.<br />
Form 10-K The company submits an annual report to the<br />
Securities and Exchange Commission on Form 10-K.<br />
Copies of this Form 10-K are available from the<br />
Corporate Affairs Department.<br />
Investor Information Securities analysts and investors<br />
seeking additional information about the company<br />
should contact Jack Runkel, Vice President–Investor<br />
Relations, at (412) 456-6034.<br />
Equal Employment Opportunity H.J. <strong>Heinz</strong> Company<br />
hires, trains, promotes, compensates and makes all<br />
other employment decisions without regard to race,<br />
color, sex, age, religion, national origin, disability<br />
or other protected conditions or characteristics.<br />
It has affirmative action programs in place at all<br />
domestic locations to ensure equal opportunity for<br />
every employee.<br />
Copies of the H.J. <strong>Heinz</strong> Company Equal<br />
Opportunity Review are available from the Corporate<br />
Affairs Department.<br />
Environmental Policy H.J. <strong>Heinz</strong> Company is committed<br />
to protecting the environment. Each affiliate has<br />
established programs to review its environmental<br />
impact, to safeguard the environment and to train<br />
employees.<br />
Copies of the H.J. <strong>Heinz</strong> Company Environmental<br />
Report are available from the Corporate Affairs<br />
Department.<br />
Corporate Data Transfer Agent, Registrar and Disbursing<br />
Agent (for inquiries and changes in shareholder accounts<br />
or to arrange for the direct deposit of dividends):<br />
ChaseMellon Shareholder Services, L.L.C.,<br />
85 Challenger Road, Overpeck Centre,<br />
Ridgefield Park, New Jersey 07660.<br />
(800)253-3399(withinU.S.A.)or(201)329-8660<br />
or http://www.chasemellon.com.<br />
Auditors: PricewaterhouseCoopers LLP,<br />
600 Grant Street, Pittsburgh, Pennsylvania 15219<br />
Stock Listings: New York Stock Exchange, Inc.<br />
Ticker Symbols: Common–HNZ; Third Cumulative<br />
Preferred–HNZ PR<br />
Pacific Exchange, Inc.<br />
Ticker Symbol: Common–HNZ<br />
(77)
TDD Services ChaseMellon Shareholder Services can<br />
be accessed through telecommunications devices for<br />
the hearing impaired by dialing (800) 231-5469 (within<br />
U.S.A.)or(201)329-8354.<br />
<strong>Heinz</strong> on the Internet Financial results, news and<br />
information about <strong>Heinz</strong> and its affiliates can be found<br />
on <strong>Heinz</strong>’s home page at http://www.heinz.com.<br />
Company News On-Call <strong>Heinz</strong> news releases,<br />
including earnings announcements, are available by<br />
fax 24 hours a day through Company News On-Call<br />
at (800) 758-5804. The <strong>Heinz</strong> extension is 575757.<br />
H<br />
H.J. <strong>Heinz</strong> Company<br />
P.O. Box 57<br />
Pittsburgh, Pennsylvania 15230-0057<br />
(412) 456-5700<br />
heinz.com<br />
4 This entire report is printed on recycled paper.<br />
Design: RKC! (Robinson Kurtin Communications! Inc)<br />
Editorial: Catherine Erickson, Matt Doherty<br />
Photography: Bob Day<br />
Produced by H.J. <strong>Heinz</strong> Company<br />
Corporate Affairs Department<br />
Pokémon, Tweenies and Star Wars are trademarks of Nintendo of America Inc., BBC Worldwide and Lucasfilm Ltd., respectively.<br />
(78)
KER PLOP!<br />
DOWNLOAD THE<br />
HEINZ SCREENSAVER<br />
FREE.<br />
It’s always a good time for <strong>Heinz</strong> ketchup, and now<br />
<strong>Heinz</strong> can help you keep time as well. As you make<br />
<strong>Heinz</strong> ketchup part of your breakfast, lunch, dinner or<br />
snack, the <strong>Heinz</strong> screensaver keeps track of the hour<br />
in 29 locations around the globe.<br />
Download it for free at<br />
http://www.heinz.com/jsp/screensaver.jsp<br />
(31)
H.J. HEINZ COMPANY ANNUAL REPORT 2000<br />
ANYTIME k ANYPLACE k ANYWHERE