UNCORRECTED PROOF
UNCORRECTED PROOF
UNCORRECTED PROOF

Create successful ePaper yourself
Turn your PDF publications into a flip-book with our unique Google optimized e-Paper software.
12 J. Brynjarsdóttir, G. Stefánsson / Fisheries Research xxx (2004) xxx–xxx<br />
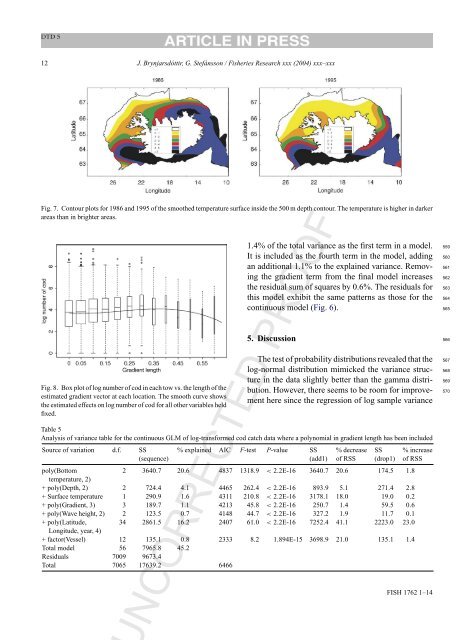
Fig. 7. Contour plots for 1986 and 1995 of the smoothed temperature surface inside the 500 m depth contour. The temperature is higher in darker<br />
areas than in brighter areas.<br />
Fig. 8. Box plot of log number of cod in each tow vs. the length of the<br />
estimated gradient vector at each location. The smooth curve shows<br />
the estimated effects on log number of cod for all other variables held<br />
fixed.<br />
Table 5<br />
Analysis of variance table for the continuous GLM of log-transformed cod catch data where a polynomial in gradient length has been included<br />
Source of variation d.f. SS<br />
(sequence)<br />
poly(Bottom<br />
temperature, 2)<br />
1.4% of the total variance as the first term in a model. 559<br />
It is included as the fourth term in the model, adding 560<br />
an additional 1.1% to the explained variance. Remov- 561<br />
ing the gradient term from the final model increases 562<br />
the residual sum of squares by 0.6%. The residuals for 563<br />
this model exhibit the same patterns as those for the 564<br />
continuous model (Fig. 6). 565<br />
5. Discussion 566<br />
The test of probability distributions revealed that the 567<br />
log-normal distribution mimicked the variance struc- 568<br />
ture in the data slightly better than the gamma distri- 569<br />
bution. However, there seems to be room for improve- 570<br />
ment here since the regression of log sample variance<br />
% explained AIC F-test P-value SS<br />
(add1)<br />
NCORRECTED <strong>PROOF</strong><br />
% decrease<br />
of RSS<br />
SS<br />
(drop1)<br />
2 3640.7 20.6 4837 1318.9 < 2.2E-16 3640.7 20.6 174.5 1.8<br />
+ poly(Depth, 2) 2 724.4 4.1 4465 262.4 < 2.2E-16 893.9 5.1 271.4 2.8<br />
+ Surface temperature 1 290.9 1.6 4311 210.8 < 2.2E-16 3178.1 18.0 19.0 0.2<br />
+ poly(Gradient, 3) 3 189.7 1.1 4213 45.8 < 2.2E-16 250.7 1.4 59.5 0.6<br />
+ poly(Wave height, 2) 2 123.5 0.7 4148 44.7 < 2.2E-16 327.2 1.9 11.7 0.1<br />
+ poly(Latitude, 34 2861.5 16.2 2407 61.0 < 2.2E-16 7252.4 41.1 2223.0 23.0<br />
Longitude, year, 4)<br />
+ factor(Vessel) 12 135.1 0.8 2333 8.2 1.894E-15 3698.9 21.0 135.1 1.4<br />
Total model 56 7965.8 45.2<br />
Residuals 7009 9673.4<br />
Total 7065 17639.2 6466<br />
% increase<br />
of RSS<br />
FISH 1762 1–14