
You also want an ePaper? Increase the reach of your titles
YUMPU automatically turns print PDFs into web optimized ePapers that Google loves.
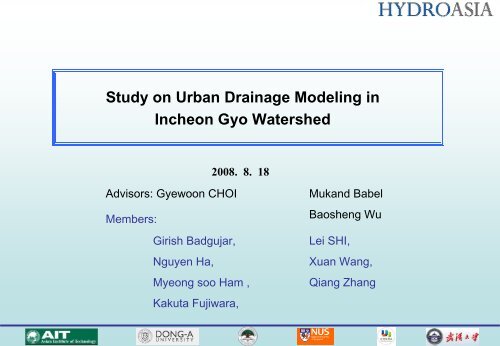
Study on Urban Drainage Modeling in<br />
Incheon Gyo Watershed<br />
2008. 8. 18<br />
Advisors: Gyewoon CHOI<br />
Members:<br />
Girish Badgujar,<br />
Nguyen Ha,<br />
Myeong soo Ham ,<br />
Mukand Babel<br />
Baosheng Wu<br />
Lei SHI,<br />
Xuan Wang,<br />
Qiang Zhang<br />
Kakuta Fujiwara,
<strong>HydroAsia</strong> –<strong>Team</strong> <strong>Blue</strong><br />
• Advisor : Gye woon Choi<br />
• Nationality : Korean<br />
• Professor of National University of Incheon<br />
• Executive director of Incheon Regional<br />
Environmental Technology Development Center
<strong>Team</strong> <strong>Blue</strong><br />
Name: Nguyen Thi Thu Ha<br />
Nationality: Vietnamese<br />
School: Asian Institute of Technology<br />
(AIT)<br />
Major: Water Engineering &<br />
Management<br />
AIT<br />
Nguyen Ha
<strong>Team</strong> <strong>Blue</strong><br />
Name: Girish Badgujar<br />
Nationality: Indian<br />
AIT<br />
Girish Badgujar<br />
School: Asian Institute of Technology<br />
(AIT)<br />
Major: Water Engineering &<br />
Management<br />
AIT<br />
Nguyen Ha
<strong>Team</strong> <strong>Blue</strong><br />
Name: Lei Shi<br />
Nationality: Chinese<br />
AIT<br />
Girish Badgujar<br />
School: Dong-A University<br />
Major: Civil Engineering<br />
AIT<br />
Nguyen Ha<br />
Dong-A University<br />
Lei Shi
<strong>Team</strong> <strong>Blue</strong><br />
Name: Kakuta Fujiwara<br />
Nationality: Japanese<br />
AIT<br />
Girish Badgujar<br />
School: Kyoto University<br />
Major: Civil & Environment Hydrauics<br />
Kyoto University<br />
Kakuta Fujiwara<br />
AIT<br />
Nguyen Ha<br />
Dong-A University<br />
Lei Shi
<strong>Team</strong> <strong>Blue</strong><br />
Name: Xuan Wang<br />
Nationality: Chinese<br />
AIT<br />
Girish Badgujar<br />
School: National University of Singapore<br />
Major: Civil Engineering<br />
Kyoto University<br />
Kakuta Fujiwara<br />
AIT<br />
Nguyen Ha<br />
National Univ. of Singapore<br />
Xuan Wang<br />
Dong-A University<br />
Lei Shi
<strong>Team</strong> <strong>Blue</strong><br />
University of Incheon<br />
Myeong soo Ham<br />
AIT<br />
Girish Badgujar<br />
Name: Myeong Soo Ham<br />
Nationality: Korean<br />
School: University of Incheon)<br />
Major: Water Engineering &<br />
Management<br />
Kyoto University<br />
Kakuta Fujiwara<br />
AIT<br />
Nguyen Ha<br />
National Univ. of Singapore<br />
Xuan Wang<br />
Dong-A University<br />
Lei Shi
<strong>Team</strong> <strong>Blue</strong><br />
Wuhan University<br />
Qiang Zhang<br />
University of Incheon<br />
Myeong soo Ham<br />
AIT<br />
Girish Badgujar<br />
Name: Qiang Zhang<br />
Nationality: Chinese<br />
School: Wuhan University<br />
Major: River Hydraulics<br />
Kyoto University<br />
Kakuta Fujiwara<br />
AIT<br />
Nguyen Ha<br />
National Univ. of Singapore<br />
Xuan Wang<br />
Dong-A University<br />
Lei Shi
<strong>Team</strong> <strong>Blue</strong><br />
Wuhan University<br />
Qiang Zhang<br />
University of Incheon<br />
Myeong soo Ham<br />
AIT<br />
Girish Badgujar<br />
The <strong>Blue</strong> World!<br />
The <strong>Blue</strong> <strong>Team</strong>!<br />
Kyoto University<br />
Kakuta Fujiwara<br />
AIT<br />
Nguyen Ha<br />
8 Weekly Meeting<br />
8 Reports for now<br />
National Univ. of Singapore<br />
Xuan Wang<br />
Dong-A University<br />
Lei Shi
Introduction<br />
Flood occurred in Incheon Gyo<br />
watershed for five years (1997 -2001)<br />
Area of Incheon city 1002.07 km 2<br />
Population 2,686,022<br />
Density of population 2,680 /km 2<br />
• Incheon is located in the mid-west Korea<br />
peninsula abutting the Yellow Sea.<br />
• A gateway to Northeast Asia with both<br />
international port and international airport<br />
Incheon International Airport<br />
Incheon Port
Introduction<br />
Flood occurrence in Incheon Gyo watershed<br />
due to:<br />
• Mild slope of the watershed<br />
• High rate of impervious area (urban area)<br />
• Abundant rainfall in wet season<br />
• Sewer network capacity<br />
Elevation 5.4~24.0 m (EL+)<br />
Avg. Slope 0.01 %<br />
33.1% of area is less than 7m (EL+)<br />
Avg. of Rainfall : 1,702.3 mm/year<br />
• Effect of Sea Level
Objectives<br />
The objectives of this project are:<br />
- Runoff analysis based on rainfall data and DEM<br />
- Simulation of Incheon Gyo watershed for the flood Aug 1997<br />
- Validation of simulation results by measurement data<br />
- Discuss recommendations for management of Incheon Gyo<br />
watershed<br />
- Discuss alternative solutions for flood prevention in the lower<br />
valley of the river
Working Flow – <strong>Team</strong> <strong>Blue</strong><br />
- Water Level at<br />
each node<br />
- Link water<br />
level, discharge,<br />
and velocity<br />
- Flood extent<br />
and flood depth,<br />
etc.<br />
General Analysis<br />
Data Collection<br />
Analysis of the collected data<br />
Model Choosing and Setup<br />
Calibration and Validation of<br />
model parameters<br />
Evaluation of the existing<br />
drainage capacity of the system<br />
- Hydrologic & Hydraulic Data: Rainfall, rain<br />
gauge coordinates, gate and pump operation,<br />
retention pond condition, etc.<br />
- Catchment Data: Coordinates, area,<br />
impervious area, population, time of<br />
concentration, Length, hydrological losses for<br />
the individual catchment, Manning number,<br />
land use type, etc.<br />
- Links: Material (Manning number),<br />
longitudinal profile, Cross section data (shape,<br />
size)<br />
- Nodes: manholes, basins, outlets,<br />
- Road system, building system<br />
- Available GIS Digital Map (0bserved flood<br />
inundation map, etc.)<br />
Design and examine technical<br />
solutions for flood alleviation<br />
Results and Recommendations
Models for urban area<br />
1. Rationale method<br />
2. STORM (Storage, Treatment, Overflow, Runoff Model, 974)<br />
3. ILLUDAS (Illinois Urban Drainage Area Simulator, 1974)<br />
4. ILSAX<br />
5. SOBEK-Urban<br />
6. SWMM models (Storm Water Management Model)<br />
7. MIKE NET – Water Distribution Networks<br />
8. MOUSE<br />
9. MIKE FLOOD model<br />
etc.
MOUSE - Introduction<br />
Surface Runoff<br />
MOUSE for surface runoff, open channel flow, pipe flow, water quality and<br />
sediment transportation.<br />
For urban watershed: Modeling package for urban drainage systems, storm<br />
sewer system and sanitary sewers.<br />
The runoff model describes the surface runoff and follows the process from<br />
rainfall to the point where the water enters the urban drainage system.<br />
The runoff discharge are used as boundary condition for the pipe flow<br />
computation.<br />
Surface runoff models<br />
Time Area Curve model A<br />
Kinematic wave Model B<br />
MODEL C (C1)<br />
MODEL C (C2)<br />
RDI ( SOLO)<br />
RDI + T-A CURVE (A)<br />
RDI+KINEMATIC WAVE (B)<br />
UHM
MOUSE – Runoff Modeling<br />
Time Area Curve Model for<br />
Run off computation<br />
The runoff amount governed<br />
by<br />
‣Initial loss<br />
‣Size of contributing area<br />
‣Continuous hydrological<br />
loss<br />
The runoff in this simulations<br />
was computed by time area<br />
curve 1.
MOUSE - Pipe flow computation<br />
MOUSE simulates the case in unsteady flow conditions with alternative free<br />
surface and pressurized flow conditions.<br />
Computation 1-D, implicit finite difference scheme, St Venant equation<br />
Model<br />
Kinematic wave model<br />
Diffusive wave model<br />
Dynamic wave model<br />
Forces<br />
Frictional and Gravitational<br />
forces<br />
Gravitational, Frictional,<br />
Pressure gradient<br />
Gravitational , Frictional,<br />
Inertia,Pressure
MOUSE - Pipe flow computation
MOUSE - Pipe flow computation<br />
The model was run for 4 August 1997 rainfall event which occurred from 3<br />
a.m. to 11 pm (This particular event was selected because flood map<br />
available.)<br />
Results of MOUSE and DEM were used as inputs in MIKE 11GIS to create<br />
inundation map. Subsequently the simulated depth of flooding and extent of<br />
flooding was compared with recording flood map (available for that time)<br />
Later model was run with different precipitation events. This precipitation<br />
events were generated using formulae of probable rainfall intensity for<br />
evaluation of existing capacity of the system
MOUSE – Result<br />
Water Level at different nodes at 11 P.M on 4.08.1997
MIKE SWMM<br />
MIKE SWMM<br />
•developed by DHI<br />
•versatile, cost-effective<br />
•modeling package<br />
•analysis of storm water systems<br />
•analysis of wastewater systems
MIKE SWMM – Example domain<br />
Given: Set up<br />
4 subcatchment boundaries hydrologic model using flow measurements at culvert C-2(ID 110).<br />
hydrologic model Set parameters up & Calibrate<br />
hydraulic network hydraulic data model using measurements at culvert C-1(ID 60)
MIKE SWMM – Example domain<br />
a. Subcatchment boundaries<br />
b. 25-Year rainfall data (time interval is 30 min.):<br />
c. The network parameters<br />
(junction, conduit and cross-section data):<br />
Conduit<br />
ID<br />
Upstream<br />
Junction ID<br />
Downstream<br />
Junction<br />
ID Type Height<br />
Length<br />
Channel<br />
slope<br />
10 10 20 Natural channel 0 2612 0.008<br />
20 20 30 Natural channel 0 878 0.015<br />
30 30 40 Natural channel 0 834 0.002<br />
40 40 50 Natural channel 0 2190 0.002<br />
50 50 60 Natural channel 0 768 0.036<br />
60 60 70 Round pipe 4 60 0<br />
70 70 80 Natural channel 0 959 0.034<br />
80 80 90 Natural channel 0 598 0.016<br />
100 100 110 Natural channel 0 1184 0.004<br />
110 110 120 Round pipe 2 45 0<br />
120 120 30 Natural channel 0 943 0.017
MIKE SWMM – Example domain<br />
[m]<br />
[m3/s]<br />
57.0<br />
4.0<br />
56.5<br />
Time Series SWMM EXTRAN, WATER LEVEL JUNCTIONS<br />
Time Series SWMM Runoff Discharge<br />
SWMM EXTRAN, WATER LEVEL JUNCTIONS<br />
60<br />
SWMM Runoff Discharge<br />
20<br />
External TS 1<br />
50<br />
Salem Street (Stage,ft) 80<br />
100<br />
56.0<br />
3.5<br />
55.5<br />
3.0<br />
55.0<br />
54.5<br />
2.5<br />
54.0<br />
2.0<br />
53.5<br />
53.0<br />
1.5<br />
52.5<br />
52.0<br />
1.0<br />
51.5<br />
0.5<br />
51.0<br />
0.0 00:00:00<br />
1-5-2000<br />
00:00:00<br />
21-5-2001<br />
06:00:00 12:00:00 18:00:00 00:00:00 06:00:00 12:00:00 18:00:00 00:00:00<br />
2-5-2000<br />
3-5-2000<br />
04:00:00 08:00:00 12:00:00 16:00:00 20:00:00 00:00:00<br />
22-5-2001<br />
04:00:00 08:00:00 12:00:00<br />
Figure 2: The simulated and calibrated results in junction<br />
Figure 1: The simulated flow rates in four subcathments
Hydro-BEAM (Basic concept)<br />
• watershed schematization<br />
• precipitation – evapotranspiration, snowfall&snowmelt - runoff<br />
• water temperature<br />
1. runoff<br />
2. evapotranspiration<br />
3. snowfall&snowmelt<br />
recovery<br />
flow<br />
evapotranspiration<br />
waste water<br />
precipitation<br />
surface runoff<br />
River flow<br />
surface<br />
river<br />
A layer<br />
B layer<br />
C layer<br />
D layer<br />
infiltration<br />
groundwat<br />
er runoff
Hydro-BEAM - Result<br />
30<br />
25<br />
20<br />
15<br />
10<br />
5<br />
0<br />
1 36 71 106 141 176 211 246 281 316 351 386 421 456 491 526 561 596 631 666 701 736<br />
30<br />
25<br />
20<br />
15<br />
10<br />
(Aug.1999)<br />
5<br />
0<br />
1 36 71 106 141 176 211 246 281 316 351 386 421 456 491 526 561 596 631 666 701 736
Work Summary<br />
Conclusion from present work (From Net meeting)<br />
The flooding event in August of 1997 was simulated with MOUSE<br />
DEM was generated from contour map<br />
Flood inundation map for August 1997 was created using ArcGIS and<br />
MIKE 11 GIS<br />
Various rainfall events associated with different return periods has been<br />
generated using formula of probable rainfall intensity to evaluate existing<br />
drainage system.<br />
Application of MIKE SWMM and Hydro-Beam.<br />
Limitation<br />
Time Limitation<br />
Experience<br />
Data availability<br />
Uncertainties in making some assumptions on running the model
Target in the Workshop<br />
Try to improve calibration<br />
Evaluate existing system with improved model<br />
and generated rainfall events with different<br />
return periods.<br />
Provide recommendations to alleviate the<br />
problem.