Eckhard Krepper
Eckhard Krepper
Eckhard Krepper

Create successful ePaper yourself
Turn your PDF publications into a flip-book with our unique Google optimized e-Paper software.
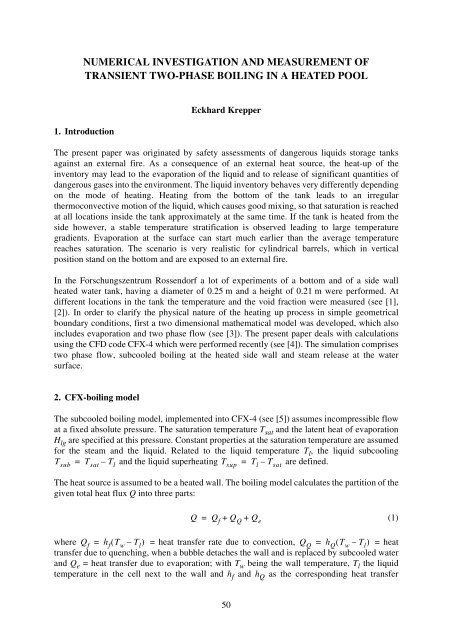
NUMERICAL INVESTIGATION AND MEASUREMENT OF<br />
TRANSIENT TWO-PHASE BOILING IN A HEATED POOL<br />
1. Introduction<br />
<strong>Eckhard</strong> <strong>Krepper</strong><br />
The present paper was originated by safety assessments of dangerous liquids storage tanks<br />
against an external fire. As a consequence of an external heat source, the heat-up of the<br />
inventory may lead to the evaporation of the liquid and to release of significant quantities of<br />
dangerous gases into the environment. The liquid inventory behaves very differently depending<br />
on the mode of heating. Heating from the bottom of the tank leads to an irregular<br />
thermoconvective motion of the liquid, which causes good mixing, so that saturation is reached<br />
at all locations inside the tank approximately at the same time. If the tank is heated from the<br />
side however, a stable temperature stratification is observed leading to large temperature<br />
gradients. Evaporation at the surface can start much earlier than the average temperature<br />
reaches saturation. The scenario is very realistic for cylindrical barrels, which in vertical<br />
position stand on the bottom and are exposed to an external fire.<br />
In the Forschungszentrum Rossendorf a lot of experiments of a bottom and of a side wall<br />
heated water tank, having a diameter of 0.25 m and a height of 0.21 m were performed. At<br />
different locations in the tank the temperature and the void fraction were measured (see [1],<br />
[2]). In order to clarify the physical nature of the heating up process in simple geometrical<br />
boundary conditions, first a two dimensional mathematical model was developed, which also<br />
includes evaporation and two phase flow (see [3]). The present paper deals with calculations<br />
using the CFD code CFX-4 which were performed recently (see [4]). The simulation comprises<br />
two phase flow, subcooled boiling at the heated side wall and steam release at the water<br />
surface.<br />
2. CFX-boiling model<br />
The subcooled boiling model, implemented into CFX-4 (see [5]) assumes incompressible flow<br />
at a fixed absolute pressure. The saturation temperature T sat and the latent heat of evaporation<br />
H lg are specified at this pressure. Constant properties at the saturation temperature are assumed<br />
for the steam and the liquid. Related to the liquid temperature T l , the liquid subcooling<br />
T sub<br />
= T sat<br />
– T l<br />
and the liquid superheating T sup<br />
= T l<br />
– T sat<br />
are defined.<br />
The heat source is assumed to be a heated wall. The boiling model calculates the partition of the<br />
given total heat flux Q into three parts:<br />
Q = Q f<br />
+ Q Q<br />
+ Q e<br />
(1)<br />
where Q f<br />
= h f<br />
( T w<br />
– T l<br />
) = heat transfer rate due to convection, Q Q<br />
= h Q<br />
( T w<br />
– T l<br />
) = heat<br />
transfer due to quenching, when a bubble detaches the wall and is replaced by subcooled water<br />
and Q e = heat transfer due to evaporation; with T w being the wall temperature, T l the liquid<br />
temperature in the cell next to the wall and h f and h Q as the corresponding heat transfer<br />
50
coefficients. For a given set of Q, T sub and U l (tangential velocity in the cell next to the wall)<br />
the bubble diameter at departure, the bubble departure frequency, the nucleation site density,<br />
the wall area fraction covered by liquid, the wall area fraction covered by vapour, the<br />
evaporation rate and the quenching heat transfer coefficient are calculated using corresponding<br />
correlations. During the heat flux partition algorithm, the composites of the given overall heat<br />
flux Q and the wall temperature T w are calculated by iteration.<br />
The rate of vapour generated at the wall is calculated by<br />
m· = Q e<br />
⁄ H lg<br />
. (2)<br />
The vapour is then assumed to be always at the saturation temperature. In the subcooled liquid<br />
(T l < T sat ), heat flows from vapour to liquid and the bulk condensation is calculated by:<br />
m· max h lg( T sat<br />
– T l<br />
)A<br />
--------------------------------------- lg<br />
= ⎛<br />
, 0⎞<br />
⎝<br />
⎠<br />
H lg<br />
(3)<br />
In the superheated liquid (T l > T sat ), all the heat flows from the liquid into the bubbles<br />
contributing to bulk evaporation:<br />
m· max h lg( T l – T sat )A<br />
--------------------------------------- lg<br />
= ⎛<br />
, 0⎞<br />
⎝<br />
⎠<br />
H lg<br />
(4)<br />
A lg is the interfacial area and h lg the interphase heat transfer coefficient, which is calculated<br />
according the Ranz-Marshall correlation.<br />
The model describes the heating up of a subcooled fluid until boiling occurs. It is assumed, that<br />
the liquid phase is continuous and the gas phase is in the form of disperse bubbles at saturation<br />
temperature. Kurul (1990, [5]) and Anglart and Nylund (1996, [6]) proposed to assume the<br />
bubble mean diameter d p to be linearly dependent on the subcooling temperature T sub :<br />
d<br />
d 1 ( T sub – T 0 ) + d 0 ( T 1 – T sub )<br />
p = -----------------------------------------------------------------------<br />
T 1<br />
– T 0<br />
(5)<br />
The recommended reference bubble diameters and subcooling are d 0 =1.0e-4 m at a subcooling<br />
temperature of 13.5 K i.e. T 0 =13.5 K and d 1 =2.0e-3 m at a superheating temperature of 5 K i.e.<br />
T 1 =-5 K (see [6]). The bubble diameter determines the drag force and the interfacial area.<br />
3. CFX-calculations<br />
The tank was modelled in two-dimensional cylindrical coordinates with 52 axial and 41 radial<br />
nodes. The radial nodes are unequally distributed with the minimum radial cell thickness near<br />
the wall of 5.0 . 10 -4 m.<br />
The Euler/Euler approach was applied for the description of the establishing steam/water<br />
mixture the two fluid model. The Rayleigh Number was estimated in the order of 7.5 . 10 10 . No<br />
turbulence was modelled. The drag of the bubbles according to the Ishii-Zuber viscous regime<br />
correlation was considered in the momentum equations. A non-slip boundary condition was set<br />
at the wall for the fluid phase while a free slip condition was set for the gas. Buoyancy was<br />
51
considered using the Boussinesq approximation. The conservation equations were solved<br />
adopting a higher order discretisation scheme according to van Leer. For the time<br />
discretisation, a fully implicit backward time stepping procedure was used. Except for the<br />
pressure equation, the discretised equations were solved using a strongly implicit procedure<br />
according to Stone. The pressure equation was solved applying an Algebraic Multigrid Solver.<br />
The vapour release into the environment at the upper surface was modelled introducing a<br />
degassing boundary. It acts as a vapour sink depending on the rising velocity of vapour and on<br />
the vapour volume fraction. The heat flux from the side wall into the water was reconstructed<br />
from temperature measurements and was given as a boundary condition.<br />
During the first period of the transient, the problem was regarded as a single phase problem<br />
until the subcooling temperature T sub falls below 15 K in the first cell of the volume. This<br />
occurs at the upper outer cell after about 810 s. Then a restart of the calculation was initiated<br />
applying the two phase models including the boiling model. The calculation was continued<br />
until convergence could not be reached at an increased vapour content at about 1220 s.<br />
380<br />
360<br />
340<br />
0.195 m<br />
0.160 m<br />
0.125 m<br />
0.090 m<br />
0.065 m<br />
0.020 m<br />
380<br />
360<br />
340<br />
0.195 m<br />
0.160 m<br />
0.125 m<br />
0.090 m<br />
0.055 m<br />
0.020 m<br />
[K]<br />
[K]<br />
320<br />
320<br />
300<br />
300<br />
280<br />
0 500 1000 1500<br />
Time [s]<br />
280<br />
0 500 1000 1500<br />
Time [s]<br />
a) measured b) calculated<br />
Fig. 1: Temperatures at different height levels in the centre of the tank<br />
0.20<br />
0.15<br />
V12 (0.195 m)<br />
V11 (0.160 m)<br />
V10 (0.125 m)<br />
V09 (0.090 m)<br />
0.20<br />
0.15<br />
V12 (0.195 m)<br />
V11 (0.160 m)<br />
V10 (0.125 m)<br />
V09 (0.090 m)<br />
[-]<br />
0.10<br />
[-]<br />
0.10<br />
0.05<br />
0.05<br />
0.00<br />
800 1000 1200 1400 1600<br />
Time [s]<br />
0.00<br />
800 1000 1200 1400 1600<br />
Time [s]<br />
a) measured b) calculated<br />
Fig. 2: Void fractions at different height levels at a wall distance of 1 mm<br />
52
4. Results and discussion<br />
Fig. 1 shows the measured<br />
and calculated temperatures<br />
in the centre of the tank at<br />
different levels. The strong<br />
temperature stratification<br />
observed in the experiment<br />
was confirmed by the<br />
calculations too. The<br />
measured temperature<br />
courses show subsequent<br />
temperature jumps, which<br />
are modelled in qualitatively<br />
good accordance to the<br />
experiment. An explanation<br />
of the jumps will be given<br />
below.<br />
Fig. 2 shows the measured<br />
and calculated void fraction<br />
signals near the wall. Boiling<br />
is found first at the probe<br />
V12 (highest level, 1 mm<br />
wall distance) in the<br />
measurements at 1050 sec<br />
and in the calculations at<br />
920 sec. The deviation could<br />
be explained by the<br />
measurement probe size. The<br />
probes had a diameter of 1<br />
millimetre. Therefore they<br />
are not capable of detecting<br />
bubbles with a diameter<br />
smaller than about 1.5<br />
millimetres. During the tests,<br />
small bubbles were seen at<br />
the wall already after about<br />
950 seconds. Also the typical<br />
noise at subcooled boiling<br />
was detected. The large<br />
gradient of the void fraction<br />
near the wall and the<br />
sensitive influence of the<br />
probe location might be a<br />
further explanation for the<br />
discrepancy.<br />
The experimental data and<br />
t = 1000 s<br />
t = 1100 s<br />
t = 1200 s<br />
z [m]<br />
z [m]<br />
z [m]<br />
0.20<br />
0.16<br />
0.12<br />
0.08<br />
0.04<br />
0.00<br />
320 360 400 440<br />
T [K]<br />
0.20<br />
0.16<br />
0.12<br />
0.08<br />
0.04<br />
0.00<br />
320 360 400 440<br />
T [K]<br />
[-]<br />
0 0.2 0.4 0.6 0.8 1<br />
0.20<br />
0.16<br />
0.12<br />
0.08<br />
0.04<br />
0.00<br />
[-]<br />
0 0.1 0.2 0.3 0.4<br />
[m/s]<br />
0 0.1 0.2 0.3<br />
[-]<br />
0 0.2 0.4 0.6 0.8<br />
[m/s]<br />
0 0.3 0.6 0.9<br />
[m/s]<br />
0 0.5 1 1.5<br />
320 360 400 440<br />
T [K]<br />
Fig. 3: Calculated temperature and velocity field and parameter<br />
at the heated wall<br />
Tl<br />
Tw<br />
vf<br />
Ul<br />
Tl<br />
Tw<br />
vf<br />
Ul<br />
Tl<br />
Tw<br />
vf<br />
Ul<br />
53
the calculated results give a deeper insight into the<br />
physical processes during the heating-up. Fig. 3<br />
represents on the left side the temperature and velocity<br />
distribution in the tank after 1000 s, 1100 s and 1200 s.<br />
Heating from the side walls and steam degassing at the top<br />
are marked by arrows. The right side of Fig. 3 shows the<br />
parameter of the heated wall. The liquid temperature T l ,<br />
the void fraction vf and the fluid velocity U l are the<br />
parameters of the first cell near the wall. The wall<br />
temperature T w is calculated by the boiling model.<br />
During the first few hundreds seconds of the test,<br />
remarkable upward movement of the fluid is observed<br />
only in a thin layer near the wall. Correspondingly there is<br />
only a slow downward movement in the bulk of the tank.<br />
Heated fluid is transported to the upper surface and a quite<br />
stable temperature stratification is established. After the<br />
first occurrence of boiling at the upper part of the side<br />
wall the rising steam accelerates the fluid. This is clearly<br />
Fig. 4: Calculated volume fraction<br />
distribution after<br />
1200 s<br />
reflected by the wall parameters on the right side of Fig. 3. The temperature stratification is<br />
mixed up by the generated steam. Fig. 3 shows the well mixed upper region at saturation<br />
temperature, a horizontal boundary and a lower region showing the remaining temperature<br />
stratification. Above the boundary a strong upward movement at the wall and a strong<br />
downward movement in the centre is established. Further heating up, the boundary moves<br />
gradually downward. In Fig. 3, the boundary is found at 0.17 m after 1000 s, at 0.10 m after<br />
1100 s and after at 0.04 m 1200 s. When the boundary crosses a thermocouple, the<br />
measurement shows a temperature jump. This explains the temperature jumps. Remarkably<br />
amounts of vapour are found only in a thin layer near the heated wall during long periods of the<br />
transient (see Fig. 4 after 1200 s). When finally the boundary reaches the bottom of the tank<br />
and the downward velocity in the centre exceeds the bubble rising velocity, the whole tank is<br />
well mixed and pool boiling occurs. Then a second temperature jump is observed in the<br />
measured temperature course after 1300 s (see Fig. 1a). The calculations however yielded<br />
reasonable results only up to about 1220 sec. The last phenomenon could not be simulated<br />
since convergence could not be achieved. The slight decreasing of the maximum fluid<br />
temperature after the corresponding jump seen in Fig. 1b could not be explained.<br />
5. Conclusions<br />
The code CFX-4 and the implemented boiling model are capable of simulating a transient two<br />
phase phenomenon including subcooled boiling. Numerical problems were solved for low<br />
volume fractions by large iteration number per time step and by underrelaxation. The<br />
numerical effort compared to a single phase situation is enhanced by a factor of about 10.<br />
Situations with higher void fraction in the last period of the transient could not be simulated.<br />
There is criticism found in the literature against the simplified linear dependence of the bubble<br />
diameter on the subcooling temperature according eq. (5) (see [7]). The correlations to describe<br />
creation, growth and detachment of bubbles should be reviewed and validated by additional<br />
experiments.<br />
54
References<br />
[1] A. Aszódi, E. <strong>Krepper</strong> and H.-M. Prasser (2000), Experimental and numerical<br />
investigations of one and two phase natural circulation in storage tanks, Heat and Mass<br />
Transfer 36, 497-504<br />
[2] A. Aszódi, E. <strong>Krepper</strong>, H.-M. Prasser (1999), Investigation of heating up and<br />
evaporation processes in storage tanks by experiments and by numerical investigations,<br />
Proceedings of the Second International Symposium on Two-Phase Flow Modeling and<br />
Experimentation Pisa, Vol. III, pp. 1667<br />
[3] A. Aszódi (1997), Modelling of transient natural convection – Thermal-hydraulic<br />
analysis for an accident of dangerous fluid storage tanks, PhD. Thesis, Technical<br />
University Budapest<br />
[4] E. <strong>Krepper</strong>, A. Aszódi, H.-M. Prasser (2001), Experimental and numerical<br />
investigations of one and two phase natural circulation in storage tanks, 4th International<br />
Conference on Multiphase Flow, New Orleans, May 2001, paper 515<br />
[5] Kurul, N., M. Z. Podowski (1990), Multidimensional effects in sub-cooled boiling, Proc.<br />
of 9’th Heat Transfer Conference<br />
[6] H. Anglart, O. Nylund (1996), CFD Application to prediction of void distribution in<br />
two-phase bubbly flows in rod bundles, Nuclear Science and Engineering 163, 81-98<br />
[7] J. Y. Tu (1999), Improvement of a two-fluid model for predicting subcooled flow<br />
boiling at low pressure, NURETH-9, San Francisco, October 1999<br />
55