Annual Report 2011 - Canlan Ice Sports
Annual Report 2011 - Canlan Ice Sports
Annual Report 2011 - Canlan Ice Sports

You also want an ePaper? Increase the reach of your titles
YUMPU automatically turns print PDFs into web optimized ePapers that Google loves.
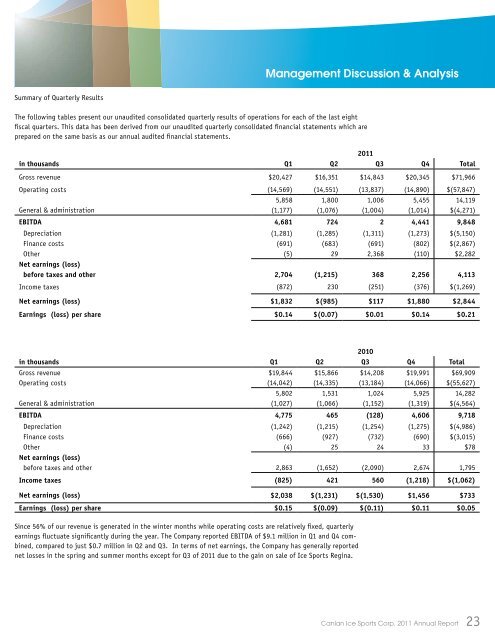
Management Discussion & Analysis<br />
Summary of Quarterly Results<br />
The following tables present our unaudited consolidated quarterly results of operations for each of the last eight<br />
fiscal quarters. This data has been derived from our unaudited quarterly consolidated financial statements which are<br />
prepared on the same basis as our annual audited financial statements.<br />
<strong>2011</strong><br />
in thousands Q1 Q2 Q3 Q4 Total<br />
Gross revenue $20,427 $16,351 $14,843 $20,345 $71,966<br />
Operating costs (14,569) (14,551) (13,837) (14,890) $(57,847)<br />
5,858 1,800 1,006 5,455 14,119<br />
General & administration (1,177) (1,076) (1,004) (1,014) $(4,271)<br />
EBITDA 4,681 724 2 4,441 9,848<br />
Depreciation (1,281) (1,285) (1,311) (1,273) $(5,150)<br />
Finance costs (691) (683) (691) (802) $(2,867)<br />
Other (5) 29 2,368 (110) $2,282<br />
Net earnings (loss)<br />
before taxes and other 2,704 (1,215) 368 2,256 4,113<br />
Income taxes (872) 230 (251) (376) $(1,269)<br />
Net earnings (loss) $1,832 $(985) $117 $1,880 $2,844<br />
Earnings (loss) per share $0.14 $(0.07) $0.01 $0.14 $0.21<br />
2010<br />
in thousands Q1 Q2 Q3 Q4 Total<br />
Gross revenue $19,844 $15,866 $14,208 $19,991 $69,909<br />
Operating costs (14,042) (14,335) (13,184) (14,066) $(55,627)<br />
5,802 1,531 1,024 5,925 14,282<br />
General & administration (1,027) (1,066) (1,152) (1,319) $(4,564)<br />
EBITDA 4,775 465 (128) 4,606 9,718<br />
Depreciation (1,242) (1,215) (1,254) (1,275) $(4,986)<br />
Finance costs (666) (927) (732) (690) $(3,015)<br />
Other (4) 25 24 33 $78<br />
Net earnings (loss)<br />
before taxes and other 2,863 (1,652) (2,090) 2,674 1,795<br />
Income taxes (825) 421 560 (1,218) $(1,062)<br />
Net earnings (loss) $2,038 $(1,231) $(1,530) $1,456 $733<br />
Earnings (loss) per share $0.15 $(0.09) $(0.11) $0.11 $0.05<br />
Since 56% of our revenue is generated in the winter months while operating costs are relatively fixed, quarterly<br />
earnings fluctuate significantly during the year. The Company reported EBITDA of $9.1 million in Q1 and Q4 combined,<br />
compared to just $0.7 million in Q2 and Q3. In terms of net earnings, the Company has generally reported<br />
net losses in the spring and summer months except for Q3 of <strong>2011</strong> due to the gain on sale of <strong>Ice</strong> <strong>Sports</strong> Regina.<br />
<strong>Canlan</strong> <strong>Ice</strong> <strong>Sports</strong> Corp. <strong>2011</strong> <strong>Annual</strong> <strong>Report</strong><br />
23