MANUAL Part II Visual Assessment of Crown Condition - ICP Forests
MANUAL Part II Visual Assessment of Crown Condition - ICP Forests
MANUAL Part II Visual Assessment of Crown Condition - ICP Forests

Create successful ePaper yourself
Turn your PDF publications into a flip-book with our unique Google optimized e-Paper software.
8 <strong>II</strong>. CROWN CONDITION ASSESSMENTS<br />
3. Selection <strong>of</strong> sample plots and trees<br />
Level I<br />
Within the transnational survey (Level I) sample plots and trees Kraft classes 1-3 (1 = dominant;<br />
2 = codominant, 3 = subdominant; see Fig. A1-1 in Annex 1) should be selected according to a<br />
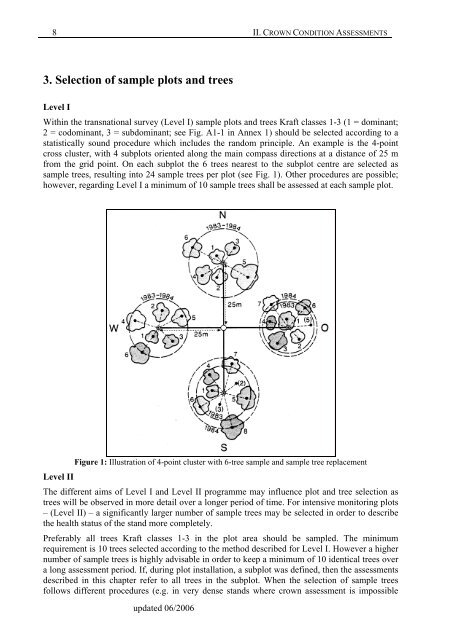
statistically sound procedure which includes the random principle. An example is the 4-point<br />
cross cluster, with 4 subplots oriented along the main compass directions at a distance <strong>of</strong> 25 m<br />
from the grid point. On each subplot the 6 trees nearest to the subplot centre are selected as<br />
sample trees, resulting into 24 sample trees per plot (see Fig. 1). Other procedures are possible;<br />
however, regarding Level I a minimum <strong>of</strong> 10 sample trees shall be assessed at each sample plot.<br />
Figure 1: Illustration <strong>of</strong> 4-point cluster with 6-tree sample and sample tree replacement<br />
Level <strong>II</strong><br />
The different aims <strong>of</strong> Level I and Level <strong>II</strong> programme may influence plot and tree selection as<br />
trees will be observed in more detail over a longer period <strong>of</strong> time. For intensive monitoring plots<br />
– (Level <strong>II</strong>) – a significantly larger number <strong>of</strong> sample trees may be selected in order to describe<br />
the health status <strong>of</strong> the stand more completely.<br />
Preferably all trees Kraft classes 1-3 in the plot area should be sampled. The minimum<br />
requirement is 10 trees selected according to the method described for Level I. However a higher<br />
number <strong>of</strong> sample trees is highly advisable in order to keep a minimum <strong>of</strong> 10 identical trees over<br />
a long assessment period. If, during plot installation, a subplot was defined, then the assessments<br />
described in this chapter refer to all trees in the subplot. When the selection <strong>of</strong> sample trees<br />
follows different procedures (e.g. in very dense stands where crown assessment is impossible<br />
updated 06/2006