Tariff Study Executive Summary - ICPDR
Tariff Study Executive Summary - ICPDR
Tariff Study Executive Summary - ICPDR

Create successful ePaper yourself
Turn your PDF publications into a flip-book with our unique Google optimized e-Paper software.
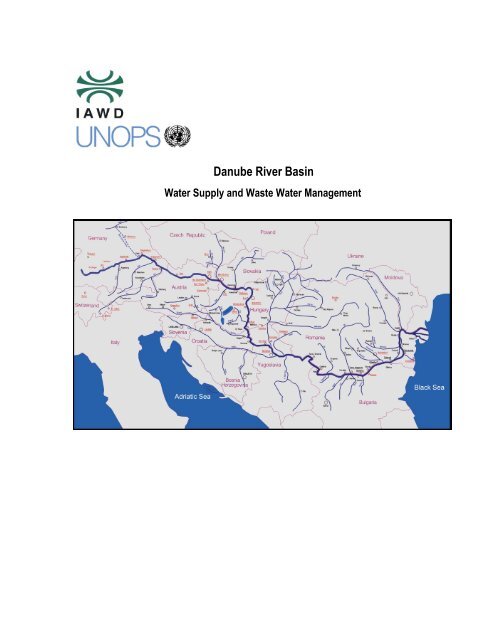
Danube River Basin<br />
Water Supply and Waste Water Management
Water <strong>Tariff</strong> <strong>Study</strong><br />
Charges, Fees and Fines compared with operating costs<br />
(and investment demand)<br />
Final Report - <strong>Executive</strong> <strong>Summary</strong><br />
August 2002<br />
Table of Contents<br />
Participants of the<strong>Tariff</strong> <strong>Study</strong>…………………………………………………………………………3<br />
ForewordbyDipl.Ing.HansSailer,President<br />
ofIAWD……………………………………………………...4<br />
PreamblebyIng.MaxHammerer,ProjectManager………………………………………………………5<br />
1.Objectiveofthe<strong>Tariff</strong><br />
<strong>Study</strong>………………………………………………………………………………….6<br />
2.Results/Charts……………………………………………………………………………………………9<br />
3.Adresses…………………………………………………………………………………………………32<br />
Participants of the <strong>Tariff</strong> <strong>Study</strong><br />
Generally, the <strong>Study</strong> is focussing on the Danube catchment area: Bosnia and Herzegovina<br />
(Republica Srpska, Federation), Bulgaria (Sofia district), Croatia (Zagreb), Czech Republic (Brno,<br />
Prerov), Hungary (Budapest, Miskolc), Romania (Cluj), Slovak Republic (Bratislava), Slovenia<br />
(Ptuj, Velenje), Yugoslavia (Belgrade, Indija, Novi Sad, Leskovac).
Foreword<br />
One of the main objectives of IAWD according to our statutes is to solve water supply problems<br />
within the Danube catchment area and to improve solidarity and the transboundary cooperation in<br />
the area. It is obvious that the particular circumstances of water companies in the Eastern<br />
European countries need to be treated in a special way. Exchange of information, mutual transfer<br />
of know-how, and professional education and training are important tools. This will lead to<br />
institutional and technical capacity necessary in order to cope with the various problems of<br />
drinking water management. There is a large number of problems to be solved and we are facing<br />
a long way with a log of possible discongruity until reaching good and sustainable results which<br />
will improve the water sector. Moreover, every nation has its own special economic, social,<br />
topographic and historic conditions which have an important impact among factors we want to<br />
influence such as designing, financing and building water supply systems.<br />
The “<strong>Tariff</strong> <strong>Study</strong>” - supported by UNOPS - should be seen as the beginning of an important<br />
process. Creating knowledge for decision makers in our member countries to assess the needs of<br />
their capital requirements on investment and operation. Additionally it should provide an overview<br />
on the status of water sector facilities in different countries along the Danube.<br />
We agree that this study is a first step of improvement and we have to improve the methodology<br />
and the way of data collection, but we have to start facing it. IAWD is aware of all the other<br />
associations dealing with the topics mentioned above, and it will be our focus to cooperate with all<br />
national and international bodies to view best results for the benefit of our members.
Dipl.-Ing. Hans SAILER<br />
IAWD - President<br />
Preamble<br />
The project was financed by the Austrian GEF Trust Fund, the counterpart as contracting authority<br />
being United Nations Office for Project Services (UNOPS) whereas the day to day project work<br />
was accompanied by the International Commission for the Protection of the Danube River<br />
(<strong>ICPDR</strong>)<br />
Methodology and scope of data was discussed in the scope of three workshops with<br />
representatives from Austria, Bosnia and Herzegovina, Bulgaria, Croatia, Czech Republic,<br />
Germany, Hungary, Romania, Slovak Republic, Slovenia and Yugoslavia.<br />
The consistency and plausibility checks revealed imperfections in the Draft Final Report, namely<br />
in the field of systematic data collection and methodology (impact of planned investments on<br />
tariffs) which in the light of the very limited time budget had to be left uncorrected at the late stage.<br />
In particular the very ambitious task to look at future investment costs and operation &<br />
maintenance costs could not be achieved in a fully satisfactory manner.<br />
It however has to be pointed out that this a well known problem of many other tariff surveys which<br />
have attempted to provide an international comparison, or even with surveys at national level. So<br />
far no other international tariff survey has looked at the impact of aggregated future investment<br />
costs and operation & maintenance costs on future revenue requirements and water/wastewater<br />
tariffs.<br />
Max Hammerer<br />
Project Manager<br />
1. Objective of the <strong>Tariff</strong> <strong>Study</strong><br />
1.1 Original Wording<br />
• Conceptional formulation:determine investment requirements for renewal/rehabilitation,<br />
extension and upgrade of facilities,<br />
• estimate cost for investment, operation & management,<br />
• determine future revenue/tariff requirements for capital investment, debt service,<br />
• within the constraints of the target populations’ ability and willingness to pay (to be<br />
assessed on the basis of readily available socio-economic data).<br />
The overall objective was “to structure a water tariff system, which is appropriate to cover the<br />
main costs of water management activities (operating costs and part of investment depreciation)<br />
and is social acceptable which means, that the tariff should not exceed a defined percentage of<br />
average income.”<br />
1.2 Reality Check<br />
This study covers 9 countries (Bosnia Herzegovina, Bulgaria, Croatia, Czech Republic, Hungary,<br />
Romania, Slovak Republic, Slovenia, Yugoslavia) with different languages, legal systems, state of<br />
institutional/economic reform and different grades of recovery from war. At the national levels we
find that water and wastewater services are executed by a large number of small enterprises,<br />
public or private, or municipalities. In each of the nine countries, socio-economic conditions,<br />
water/wastewater service levels, tariffs and costs are not at all uniform between urban and rural<br />
areas, between small and large towns.<br />
Determining future revenue/tariff requirements for capital investment and debt service would<br />
require fairly elaborated cost-time schedules with fairly detailed assumptions on financing costs<br />
(interest, term etc.). This is typically done at the level of individual feasibility studies. Determining<br />
future revenue/tariff requirements for operation & maintenance costs is a no lesser or easier task,<br />
but again requires individual case studies.<br />
With regard to the limited resources for the study, a mixed approach was chosen, with elements<br />
of a survey for collecting aggregate and averaged data at national levels and a small number of<br />
case studies.<br />
But what are others doing in the field of surveys and studies on water and wastewater charges or<br />
tariff systems?<br />
a) United Kingdom<br />
Since the early 1990s the Office of Water Services (OFWAT) is responsible for making sure that<br />
the water and sewerage companies in England and Wales give you a good-quality, efficient<br />
service at a fair price. OFWAT is a government department. OFWAT is the economic regulator of<br />
the water industry in England and Wales:<br />
• limit the amount companies can charge customers;<br />
• make sure that companies can carry out their responsibilities under the Water Industry<br />
Act 1991;<br />
• protect the standard of services water customers receive;<br />
• encourage companies to be more efficient; and<br />
• work to encourage competition where appropriate.<br />
OFWAT compares the activities of all the companies. This helps poor performers to rise to the<br />
standards of the best.<br />
OFWAT is imposing price caps. The current directive (2002) is to annual decrease prices by<br />
2.1%. OFWAT is annually collecting, analysing and publishing financial and technical key data.<br />
The printed version of the annual questionnaire has app. 50 pages. The complementary<br />
Regulatory Accounting Guidelines (RAGs) fills app. 200 pages, containing definitions of<br />
terminology and descriptions of methodology:<br />
• RAG 1 Guideline for accounting for current costs 50 pages<br />
• RAG 2 Classification of infrastructure expenditure 20 pages<br />
• RAG 3 Guideline for the contents of regulatory accounts 53 pages<br />
• RAG 4 Guideline for the analysis of operating costs and assets 22 pages<br />
• RAG 5 Transfer pricing in the water industry 25 pages<br />
b) Germany<br />
In Germany there is no equivalent institution to OFWAT, since water and wastewater services are<br />
under different legal frames and typically under the umbrella of different municipal departments<br />
and enterprises, with water leaning more to the private/commercial side and wastewater being a<br />
government task, to be financed from taxes and fees.<br />
Of interest for us are the regular, national surveys on wastewater charges, executed by the<br />
association of wastewater engineering (Abwassertechnische Vereinigung, ATV and the<br />
Bundesverband Gas- und Wasserfach, BGW), professional associations of individual experts,<br />
firms of consulting engineers, university departments, equipment suppliers, municipal enterprise<br />
etc.<br />
In addition to current O&M costs, asset values (historic/replacement values) depreciation and<br />
imputed interested is asking for treatment standards, service levels and capital investment during<br />
the past couple of years. When the ATV/BGW survey is asking for costs, the municipalities (or<br />
water enterprises) can easily draw this information from their databases. But as explained above,<br />
the cost data is however not calculated with the same methodology. At least the multiple-choice<br />
questions on institutional set-up and cost calculation methodology help to put this in the right<br />
perspective.
The survey is asking for next year’s planned investment and for expected increases in future<br />
costs, but generally is more status-quo oriented. In fact the initial motivation was to justify the<br />
consistently increasing wastewater fees in Germany during the past decade. Due to the<br />
fragmented institutional set-up and a limited public interest, systematic financial and cost data on<br />
the German water sector was poor before the first survey in 1994. Only the steep increases of<br />
costs prices in the 1990s<br />
• introduction of phosphor and nitrogen removal<br />
• progressively tighter standards on sewage sludge disposal, making reuse in agriculture<br />
more and more difficult, if not impossible<br />
• planning errors in East-Germany<br />
raised the attention of the general public. In 1992 a water expert from the World Bank visited<br />
Germany in order to prepare an assessment of the German Water Sector, with special emphasis<br />
on the experience right after the reunification. The overall praise of achievements in dramatically<br />
improving the water quality in rivers, service levels and quality standards was somewhat lowered<br />
by a negative comment on the sector’s economic efficiency. Policy makers as well as the service<br />
providers at municipal level only look at these standards which were progressively improved and<br />
tightened.<br />
1.3 Experience in East and South-Eastern Europe<br />
In the relevant group of countries, there is still an economic and institutional reform in process.<br />
The former Yugoslavia in addition suffered from many years of civil war and, lately, a war with<br />
NATO.<br />
(1) low or no volumetric charges and high per capita water use, wastewater charges well<br />
below water charges (?30%),<br />
(2) a decay of public institutions in general, suffering from severe budget constraints (low<br />
salaries, low pensions, low liquidity),<br />
(3) a decay of old industries (low salaries, low liquidity) only partially complemented by few<br />
booming, new industries,<br />
(4) high official unemployment rates,<br />
(5) very active shadow economies,<br />
(6) transfers from relatives living and working abroad,<br />
(7) a very uneven distribution of income, not only between rural and urban areas or between<br />
regions, but even within a city or region,<br />
(8) periods of hyperinflation and currency reforms,<br />
(9) lack of experience in “Western” budgeting procedures and financial reporting,<br />
(10) lack of or at least fragmentary legislation and/or guidelines on the former,<br />
(11) general reluctance to give presumably “confidential” data to outsiders,<br />
(12) application of old planning guidelines,<br />
(13) central government as predominant source of funding in the past.<br />
According to experience from East-German after re-unification, future price increases will lead to<br />
a substantial drop of per capita water use, e.g. to well below 150 l/c/d as it is now common in<br />
Central Europe. In particular (industrial) bulk water users have a relatively great potential to<br />
economise water use. Even without price increases, we expect a reduction of industrial water use<br />
as the result of industrial reforms, moving away from traditional “heavy industries” with high water<br />
use.<br />
The ongoing institutional and economic reform is to change from centralised, hierarchical planning<br />
towards decentralised planning. The latter requires an elaborated regulative and legislative frame<br />
which at the current stage is still under development and thus incomplete. Ask for accounting data<br />
and you get inconsistent answers. Published, financial and cost data are unreliable. The following<br />
shortfalls are common:<br />
• Quantitative inventories are often missing (e.g. complementary maps and lists showing<br />
type, age and length of pipes). There is no uniform concept to value fixed assets in the<br />
context of high inflation or currency reforms. In worst cases, the published values of fixed<br />
assets are useless.
• The lack of production water meters, district water meters and wastewater flow meters<br />
makes leak detection and quantitative accounting difficult, if not impossible.<br />
• There is no uniform concept for writing off bad debt (customer arrears). In the light of nonpaying<br />
government and industrial water users, actual liquidity may substantially differ from<br />
reported revenue.<br />
• Multi-utility enterprises do not separate expenditure by type of service, e.g. water,<br />
wastewater and others. Municipal sewerage bureaus are unable to isolate the complete,<br />
water and wastewater related cost from the municipal budget.<br />
We never know whether reported costs or expenditure are adequate and represent a good,<br />
economic use of resources:<br />
• Separating expenditure on preventative maintenance, repairs and reinvestment needs is<br />
a matter of definitions which should be uniform. A nominal, full recovery of maintenance,<br />
repair and reinvestment cost in reality may be only a partial recovery of cost. A typical<br />
indicator for this is the absence of preventative maintenance schemes, or a deterioration<br />
of physical performance indicators (no. of pipe breaks, % of water losses etc.).<br />
• Public utilities are typically overstaffed, but on the other hand public sector salaries are<br />
too low to motivate staff or are even to low to feed families. In either case the salaries buy<br />
only part-time labour.<br />
• Due to poor design standards, a backlog in reinvestment/repair/maintenance, poorly<br />
executed works or quality of materially physical water losses and infiltration into sewers<br />
are generally higher than in “Western“ Europe. There certainly is room for optimisation<br />
towards reducing variable production costs and, more important, in delaying future<br />
capacity extensions. But usually we don’t know how far this should go.<br />
• Local consultants and local institutions still like to use old planning sand design standards<br />
for determining the necessary, future capacity of water or wastewater treatment facilities.<br />
2. Results/Charts<br />
The tables/charts on the following pages summarise the data collected from the local consultants<br />
and the local water utilities. As such they represent the essence of the tariff study in hand.<br />
List of Charts<br />
Chart 1 Overview Map............................................................................................................................ 11<br />
Chart 2 Population, No. of Water Utilities and Municipalities ................................................................. 12<br />
Chart 3 Service Levels Piped Water Supply........................................................................................... 13<br />
Chart 4 Service Levels Piped Sewerage / Sewers ................................................................................. 13<br />
Chart 5 Service Levels Wastewater Treatment...................................................................................... 15<br />
Chart 6 Specific Water Consumption [ l/c/d ] ......................................................................................... 17<br />
Chart 7 Level of Household Income [ U$ / Capita / Month ] ................................................................... 18<br />
Chart 8 Affordable Water and Wastewater <strong>Tariff</strong> --> 4% of Income and 130 l/c/d [ U$ / m³ ]................ 19<br />
Chart 9 Present (2001) Average Water and Wastewater <strong>Tariff</strong>s [ U$ / m³ ] .......................................... 20<br />
Chart 10 Current Household Expenditure on Water and Wastewater as % of Income ........................... 22<br />
Chart 11 Possible Increase of <strong>Tariff</strong>s [ U$ / m³ ] ...................................................................................... 23<br />
Chart 12 Current Level of Operation & Maintenance Cost [ U$ / m³ ]...................................................... 24<br />
Chart 13 Nominal Cost Recovery [ U$ / m³ ] ............................................................................................ 25<br />
Chart 14 No. of Staff per 1000 Connections ............................................................................................ 26<br />
Chart 15 No. of Staff per 1000 Inhabitants............................................................................................... 27<br />
Chart 16 Fee Collection Rate [ % ] and Accounts Receivable [ No. of Months of Billed Revenue ]......... 28<br />
Chart 17 Future Investment Budgets [ U$ ] per Capita until 2010............................................................. 29<br />
Chart 18 Additional Operation & Maintenance Costs and Depreciation [ U$ / m³ ].................................. 30<br />
Chart 19 Additional Unit Costs versus Affordable <strong>Tariff</strong> Increase [ U$ / m³ ] ........................................... 31
2.1 The <strong>Study</strong> Area<br />
Chart 1 Overview Map<br />
Generally, the <strong>Study</strong> is focussing on the Danube catchment area: Bosnia and Herzegovina<br />
(Republica Srpska, Federation), Bulgaria (Sofia district), Croatia (Zagreb), Czech Republic (Brno,<br />
Prerov), Hungary (Budapest, Miskolc), Romania (Cluj), Slovak Republic (Bratislava), Slovenia<br />
(Ptuj, Velenje), Yugoslavia (Belgrade, Indija, Novi Sad, Leskovac).
Chart 2<br />
Population, No. of Water Utilities and Municipalities<br />
> 10.000 No. of Municipalities / Water Utilities<br />
0 50 100 150 200 250 300<br />
Bosnia-Herzegovina 3,8 Million<br />
Federation of Bosnia-<br />
Srpska 1,3 Million<br />
Bulgaria 8,2 Million<br />
Sofia District 0,2 Million<br />
Croatia 4,3 Million<br />
Zagreb 0,9 Million<br />
Czech Republic 10,3 Million<br />
Brno 0,4 Million<br />
Perov 0,1 Million<br />
Hungary 10,1 Million<br />
Budapest 1,9 Million<br />
Miskolc 0,2 Million<br />
Romania 22,5 Million<br />
Cluj 0,5 Million<br />
Slovenia 2,0 Million<br />
Ptuj 0,1 Million<br />
Velenje 0,0 Million<br />
Slovakia 5,4 Million<br />
Bratislava 0,5 Million<br />
Yugoslavia 10,6 Million<br />
Belgrade 1,8 Million<br />
Indjija 0,1 Million<br />
Novi Sad 0,3 Million<br />
Leskovac 0,1 Million<br />
The study area covers some 55 million inhabitants, served by at least 1,000 to 1,500 regional or<br />
municipal water and wastewater schemes. This figure may not even include village water<br />
schemes.<br />
2.2 Service Levels<br />
Service Level indicates the percentage of population connected to piped water supply scheme,<br />
sewers or wastewater treatment.
0% 10% 20% 30% 40% 50% 60% 70% 80% 90% 100%<br />
Bosnia-Herzegovina<br />
Federation of<br />
Srpska<br />
Bulgaria<br />
Sofia District<br />
Croatia<br />
Zagreb<br />
Czech Republic<br />
Brno<br />
Perov<br />
Hungary<br />
Budapest<br />
Miskolc<br />
Romania<br />
Cluj<br />
Slovenia<br />
Ptuj<br />
Velenje<br />
Slovakia<br />
Bratislava<br />
Yugoslavia<br />
Belgrade<br />
Indjija<br />
Novi Sad<br />
Leskovac<br />
Chart 3<br />
Service Levels Piped Water Supply<br />
Very obviously, service levels are not uniform. Not necessarily, service levels below 70% indicate<br />
sub-standard supply levels or public health hazards. Rural areas with low population density and<br />
easy access to high quality spring- or ground water may live well, safe and cheap without piped<br />
water supply.<br />
International donors consider water and wastewater services as complementary. Increasing<br />
connection rates to piped water supply scheme or increasing per capita consumption will<br />
immediately raise the question, whether then the complementary sewerage system will remain<br />
affordable.<br />
Chart 4<br />
Service Levels Piped Sewerage / Sewers
0% 10% 20% 30% 40% 50% 60% 70% 80% 90% 100%<br />
Bosnia-Herzegovina<br />
Federation of<br />
Srpska<br />
Bulgaria<br />
Sofia District<br />
Croatia<br />
Zagreb<br />
Czech Republic<br />
Brno<br />
Perov<br />
Hungary<br />
Budapest<br />
Miskolc<br />
Romania<br />
Cluj<br />
Slovenia<br />
Ptuj<br />
Velenje<br />
Slovakia<br />
Bratislava<br />
Yugoslavia<br />
Belgrade<br />
Indjija<br />
Novi Sad<br />
Leskovac<br />
Again, having connected more than 90% of Germany’s population to public sewers and treatment<br />
plants has contributed to the high cost of services and the high level of charges. Increasing<br />
current service levels in the study area should not follow uniform 90% or 100% target, but should<br />
depend on population density (required length of sewers per connected inhabitant, specific<br />
investment cost) and evident conflicts in water use (necessity to protect groundwater or surface<br />
waters from pollution).<br />
Chart 5<br />
Service Levels Wastewater Treatment
0% 10% 20% 30% 40% 50% 60% 70% 80% 90% 100%<br />
Bosnia-Herzegovina<br />
Federation of<br />
Srpska<br />
Bulgaria<br />
Sofia District<br />
Croatia<br />
Zagreb<br />
Czech Republic<br />
Brno<br />
Perov<br />
Hungary<br />
Budapest<br />
Miskolc<br />
Romania<br />
Cluj<br />
Slovenia<br />
Ptuj<br />
Velenje<br />
Slovakia<br />
Bratislava<br />
Yugoslavia<br />
Belgrade<br />
Indjija<br />
Novi Sad<br />
Leskovac<br />
As matter of priorities, service levels for wastewater treatment are typically lower than for<br />
wastewater treatment. First and foremost private water users in town are interested in piped water<br />
supply. A clean urban neighbourhood requires sound on-site sanitation facilities (septic tanks) or<br />
even sewers, but is of secondary priority to the property owners and may even require some<br />
social pressure. Adequate maintenance of septic tanks (de-sludging) or even wastewater<br />
treatment requires more social pressure and ultimately binding regulations and bye-laws at<br />
municipality level.<br />
From the data collected it was not always possible to determine whether “wastewater treatment” is<br />
mechanical, biological or more advanced treatment (phosphor precipitation, nitrification/denitrification).<br />
In case of non-operative or poorly performing treatment plants, it is matter of<br />
definition whether physical connection or actual function matters. Adding wastewater treatment to<br />
a piped sewerage system may require complementary investment for main collectors and/or to reorientate<br />
a sewerage system to a central wastewater treatment plant.
Domestic Consumption<br />
Non-Domestic Consumption<br />
0 100 200 300<br />
Chart 6 Specific Water Consumption [ l/c/d ]<br />
The above data was obtained from (partially estimated) sales figures rather than from outdated<br />
design criteria which in some cases were within the range of 400 l/c/d. The observed levels of<br />
domestic water consumption already show a reaction to the substantial price increases in the<br />
study area. Again, donors and IFIs will hardly accept to fund projects with design criteria in excess<br />
of 150 l/c/d. For comparison, domestic water use in Germany has dropped to below 130 l/c/d.<br />
Still, there is a high percentage of non-domestic water usage. It is expected that this will go down<br />
furthermore, in the course of the ongoing industrial restructuring (less heavy industry with high<br />
water usage) and in economising water industrial water usage (partial switch to private wells,<br />
closed loop systems, industrial wastewater treatment plants).<br />
Bosnia-Herzegovina<br />
Federation of<br />
Srpska<br />
Bulgaria<br />
Sofia District<br />
Croatia<br />
Zagreb<br />
Czech Republic<br />
Brno<br />
Perov<br />
Hungary<br />
Budapest<br />
Miskolc<br />
Romania<br />
Cluj<br />
Slovenia<br />
Ptuj<br />
Velenje<br />
Slovakia<br />
Bratislava<br />
Yugoslavia<br />
Belgrade<br />
Indjija<br />
Novi Sad<br />
Leskovac<br />
2.3 Household Income and <strong>Tariff</strong>s<br />
Chart 7 Level of Household Income [ U$ /Capita/ Month ]
0 50 100 150 200 250 300<br />
Bosnia-Herzegovina<br />
Federation of<br />
Srpska<br />
Bulgaria<br />
Sofia District<br />
Croatia<br />
Zagreb<br />
Czech Republic<br />
Brno<br />
Perov<br />
Hungary<br />
Budapest<br />
Miskolc<br />
Romania<br />
Cluj<br />
Slovenia<br />
Ptuj<br />
Velenje<br />
Slovakia<br />
Bratislava<br />
Yugoslavia<br />
Belgrade<br />
Indjija<br />
Novi Sad<br />
Leskovac<br />
Water and wastewater tariffs have to remain affordable in relation to the water users disposable<br />
income. Data on average household income was obtained from official statistics which however<br />
may not draw an exact and adequate image of actual income levels and distribution. Pensioners,<br />
the unemployed and even public sector or “old industry” employees may earn well below the<br />
average. On the other hand, official statistics do not include income from shadow economy.<br />
Therefore a good feasibility and tariff study should preferably include a household survey to<br />
investigate the water users’ presumed ability and willingness to pay.<br />
Since this tariff survey has to work with limited resources and public available, it was agreed to<br />
utilise official statistics. As such, this may include reserves regarding actual average income (incl.<br />
shadow economy), but on the other hand is not able to deliver income distribution or income by<br />
city or sub-region.<br />
Chart 8 Affordable Water & Wastewater<strong>Tariff</strong> -- > 4% of Income and 130 l/c/d [ U$ / m³ ]
0,00 0,50 1,00 1,50 2,00 2,50 3,00<br />
Bosnia-Herzegovina<br />
Federation of<br />
Srpska<br />
Bulgaria<br />
Sofia District<br />
Croatia<br />
Zagreb<br />
Czech Republic<br />
Brno<br />
Perov<br />
Hungary<br />
Budapest<br />
Miskolc<br />
Romania<br />
Cluj<br />
Slovenia<br />
Ptuj<br />
Velenje<br />
Slovakia<br />
Bratislava<br />
Yugoslavia<br />
Belgrade<br />
Indjija<br />
Novi Sad<br />
Leskovac<br />
A commonly accepted guideline is that expenditure on water and sanitation charges shall not<br />
exceed 4% of a household’s disposable income. Whilst the (expensive) water and wastewater<br />
tariffs in Austria and German still remain well below these limits, there are cases in developing<br />
countries where water users pay much more to private water vendors, for lesser water quantity<br />
and quality. As such the 4% should be taken as it is, as a simplified guideline, but not as solid law.<br />
Because the 4% and 130 l/c/d are uniformly applied for all countries of the study area, the<br />
resulting chart has the same visual appearance as the chart on household income.<br />
Chart 9 Present (2001) Average Water and Wastewater <strong>Tariff</strong>s [ U$ / m³ ]
Water<br />
Wastew ater<br />
0,80 0,60 0,40 0,20 0,00 0,20 0,40 0,60<br />
Bosnia-Herzegovina<br />
Federation of<br />
Srpska<br />
Bulgaria<br />
Sofia District<br />
Croatia<br />
Zagreb<br />
Czech Republic<br />
Brno<br />
Perov<br />
Hungary<br />
Budapest<br />
Miskolc<br />
Romania<br />
Cluj<br />
Slovenia<br />
Ptuj<br />
Velenje<br />
Slovakia<br />
Bratislava<br />
Yugoslavia<br />
Belgrade<br />
Indjija<br />
Novi Sad<br />
Leskovac
Water Wastew ater Domestic Average Non-Domestic<br />
1,00 0,80 0,60 0,40 0,20 0,00 0,20 0,40 0,60 0,80 1,00 1,20<br />
Bosnia-Herzegovina<br />
Federation of<br />
Srpska<br />
Bulgaria<br />
Sofia District<br />
Croatia<br />
Zagreb<br />
Czech Republic<br />
Brno<br />
Perov<br />
Hungary<br />
Budapest<br />
Miskolc<br />
Romania<br />
Cluj<br />
Slovenia<br />
Ptuj<br />
Velenje<br />
Slovakia<br />
Bratislava<br />
Yugoslavia<br />
Belgrade<br />
Indjija<br />
Novi Sad<br />
Leskovac<br />
Whilst there are comprehensive statistical data on average tariff rates from Croatia and from the<br />
Czech Republic, average tariff rates for the remaining countries had to be estimated. In fact, there<br />
are no uniform tariff systems or tariff rates in the study area, but these vary between<br />
municipalities. Consequently the shown average rates by country should be seen with a grain of<br />
salt, because the estimated averages are not always based on sound statistical methodology.<br />
Croatia represents a special case, because there is an elaborated system of special taxes and<br />
fees in addition to those going straight to the regional or municipal water enterprise.<br />
Chart 10 Current Household Expenditure on Water and Wastewater as % of Income
0,00% 0,50% 1,00% 1,50% 2,00% 2,50% 3,00% 3,50% 4,00% 4,50%<br />
Bosnia-Herzegovina<br />
Federation of<br />
Srpska<br />
Bulgaria<br />
Sofia District<br />
Croatia<br />
Zagreb<br />
Czech Republic<br />
Brno<br />
Perov<br />
Hungary<br />
Budapest<br />
Miskolc<br />
Romania<br />
Cluj<br />
Slovenia<br />
Ptuj<br />
Velenje<br />
Slovakia<br />
Bratislava<br />
Yugoslavia<br />
Belgrade<br />
Indjija<br />
Novi Sad<br />
Leskovac<br />
Based on the before mentioned tariff and water consumption data, households’ current<br />
expenditure on water and wastewater tariffs are calculated in relation to household income. Since<br />
the service levels for wastewater are in many cases below water supply, not all water users in<br />
these particular countries pay water and wastewater tariffs.<br />
Keeping in mind the 4% threshold, this chart indirectly indicates the potential to increase current<br />
tariff levels within conventionally assumed affordability constraints.<br />
Chart 11 Possible Increase of <strong>Tariff</strong>s [ U$ / m³ ]
0,50 0,00 0,50 1,00 1,50 2,00 2,50 3,00<br />
Bosnia-Herzegovina<br />
Federation of<br />
Srpska<br />
Bulgaria<br />
Sofia District<br />
Croatia<br />
Zagreb<br />
Czech Republic<br />
Brno<br />
Perov<br />
Hungary<br />
Budapest<br />
Miskolc<br />
Romania<br />
Cluj<br />
Slovenia<br />
Ptuj<br />
Velenje<br />
Slovakia<br />
Bratislava<br />
Yugoslavia<br />
Belgrade<br />
Indjija<br />
Novi Sad<br />
Leskovac<br />
Vice versa, this chart shows the possible scope for increasing tariffs, starting from current water<br />
consumption, household income and tariff levels. When comparing for instance Brno and Perov, it<br />
should be considered that Brno is starting with a high current tariff and a relatively high per-capita<br />
water use.<br />
2.4 Cost Recovery<br />
Chart 12 Current Level of Operation & Maintenance Cost [ U$ / m³ ]
Water<br />
Wastew ater<br />
0,40 0,30 0,20 0,10 0,00 0,10 0,20 0,30 0,40<br />
Bosnia-Herzegovina<br />
Federation of<br />
Srpska<br />
Bulgaria<br />
Sofia District<br />
Croatia<br />
Zagreb<br />
Czech Republic<br />
Brno<br />
Perov<br />
Hungary<br />
Budapest<br />
Miskolc<br />
Romania<br />
Cluj<br />
Slovenia<br />
Ptuj<br />
Velenje<br />
Slovakia<br />
Bratislava<br />
Yugoslavia<br />
Belgrade<br />
Indjija<br />
Novi Sad<br />
Leskovac<br />
Chart 13 Nominal Cost Recovery [ U$ / m³ ]
Operating Ratio Operating Surplus [ U$/m³ ]<br />
2,50 2,00 1,50 1,00 0,50 0,00 0,50<br />
Bosnia-Herzegovina<br />
Federation of<br />
Srpska<br />
Bulgaria<br />
Sofia District<br />
Croatia<br />
Zagreb<br />
Czech Republic<br />
Brno<br />
Perov<br />
Hungary<br />
Budapest<br />
Miskolc<br />
Romania<br />
Cluj<br />
Slovenia<br />
Ptuj<br />
Velenje<br />
Slovakia<br />
Bratislava<br />
Yugoslavia<br />
Belgrade<br />
Indjija<br />
Novi Sad<br />
Leskovac<br />
Operating ratio is relating average revenue per m³ of water/wastewater sold to average operation<br />
& maintenance costs per m³ of water/wastewater sold. The resulting operation ratio is factor<br />
without dimension. An operating ratio below 1.00 or 100% indicates that revenue do not cover<br />
operation & maintenance costs. An operating ratio above 1.00 or 100% indicates at least full<br />
recovery of operation & maintenance costs. Anything earned beyond contributes to the recovery<br />
of capital costs.<br />
Operating surplus is the operating revenue minus operation & maintenance costs. Operating<br />
surplus can be used for internal funding of investment and/or for paying debt service. To make the<br />
figures comparable, operating surplus is not shown in absolute terms, but per m³ of water sold.<br />
What we see in the comparative chart is that operating revenue in the District of Sofia and the City<br />
of Belgrade cover only 95% operating costs. Only few candidates achieve operating ratios in<br />
excess of 150%. Due to a lack of aggregate cost data at national levels, no statements on<br />
Bulgaria, Croatia, Hungary and Yugoslavia can be made. The cost data from Bosnia-Herzegovina<br />
is based on very bold estimates.<br />
Chart 14<br />
No. of Staff per 1000 Connections
0 5 10 15 20 25 30 35 40<br />
Bosnia-Herzegovina<br />
Federation of<br />
Srpska<br />
Bulgaria<br />
Sofia District<br />
Croatia<br />
Zagreb<br />
Czech Republic<br />
Brno<br />
Perov<br />
Hungary<br />
Budapest<br />
Miskolc<br />
Romania<br />
Cluj<br />
Slovenia<br />
Ptuj<br />
Velenje<br />
Slovakia<br />
Bratislava<br />
Yugoslavia<br />
Belgrade<br />
Indjija<br />
Novi Sad<br />
Leskovac<br />
This is a standard parameter to assess the overall efficiency of water utilities that is found in most<br />
statistical evaluations and benchmarking exercises. The resulting quotient is however highly<br />
sensitive to the definition of numerator (no. of staff) and denominator (nbo. of connections).<br />
Chart 15<br />
No. of Staff per 1000 Inhabitants
3,5<br />
3,0<br />
2,5<br />
2,0<br />
1,5<br />
1,0<br />
0,5<br />
0,0<br />
Bosnia-Herzegovina<br />
Federation of<br />
Srpska<br />
Bulgaria<br />
Sofia District<br />
Croatia<br />
Zagreb<br />
Czech Republic<br />
Brno<br />
Perov<br />
Hungary<br />
Budapest<br />
Miskolc<br />
Romania<br />
Cluj<br />
Slovenia<br />
Ptuj<br />
Velenje<br />
Slovakia<br />
Bratislava<br />
Yugoslavia<br />
Belgrade<br />
Indjija<br />
Novi Sad<br />
Leskovac<br />
Chart 16 Fee Collection Rate [ % ] and Accounts Receivable [ No. of Months of Billed<br />
Revenue ]
Fee Collection Rate<br />
Accounts Receivable as Months of Billed Revenue<br />
-200% -100% 0% 100% 200% 300% 400% 500% 600% 700% 800% 900% 1000% 1100%<br />
Bosnia-Herzegovina<br />
Federation of<br />
Srpska<br />
Bulgaria<br />
Sofia District<br />
Croatia<br />
Zagreb<br />
Czech Republic<br />
Brno<br />
Perov<br />
Hungary<br />
Budapest<br />
Miskolc<br />
Romania<br />
Cluj<br />
Slovenia<br />
Ptuj<br />
Velenje<br />
Slovakia<br />
Bratislava<br />
Yugoslavia<br />
Belgrade<br />
Indjija<br />
Novi Sad<br />
Leskovac<br />
The fee collection rate relates actually collected fees against billed water and wastewater charges.<br />
If all water users are paying their bills, the fee collection should amount to 100%. There could be<br />
however problems with allocating collected fees to financial years. This data could only be<br />
retrieved from few water enterprises (Sofia District, Brno, Perov and Belgrade). Fee collection<br />
rates above 100% are possible, if accounts receivables from previous financial years are collected<br />
in the current financial year.<br />
Another relevant parameter is accounts receivable (=unpaid bills as shown in the enterprise’s<br />
balance sheet). To make figures comparable and intuitive, the amounts are not shown in absolute<br />
terms, but as month of billed revenue. The 5,3 indicated for Belgrade means that accounts<br />
receivable are equivalent to 5,3 months of billed revenue. One month would be adequate, allowing<br />
for ample time to settle water bills. More than one month is an indicator for problems.<br />
When looking at the raw data as supplied from the water enterprises, Belgrade is the exception<br />
from this general rule. In Belgrade, the accounts receivable from all water users are uniformly<br />
high.<br />
2.5 Future Investment Budgets and Impact on <strong>Tariff</strong>s<br />
One stated objective of this tariff study is to show the impact of future investments in the water<br />
sector on tariffs. The country reports show bold estimates on published investment budgets for<br />
the water and wastewater until the year 2010.
Water<br />
Wastew ater<br />
Bosnia-Herzegovina<br />
Federation of<br />
Srpska<br />
Bulgaria<br />
Sofia District<br />
Croatia<br />
Zagreb<br />
Czech Republic<br />
Brno<br />
Perov<br />
Hungary<br />
Budapest<br />
Miskolc<br />
Romania<br />
Cluj<br />
Slovenia<br />
Ptuj<br />
Velenje<br />
Slovakia<br />
Bratislava<br />
Yugoslavia<br />
Belgrade<br />
Indjija<br />
Novi Sad<br />
Leskovac<br />
300,00 200,00 100,00 0,00 100,00 200,00 300,00 400,00<br />
Chart 17 Future Investment Budgets [ U$ ] per Capita until 2010<br />
To make the investment budgets comparable, the above chart is showing bold estimates on<br />
published investment budgets for the water sector. Evidently, the priority is in the field of<br />
wastewater. It however was neither possible to prepare a comparative chart on other priorities,<br />
e.g. rural versus urban investments, nor to allocate the above, national investment budgets to<br />
individual water enterprises.<br />
Consequently, a much simpler approach had to be employed to generate at least some indicative<br />
data on future, additional unit costs for the water sector:<br />
(1) utilise the published data on national investment budget for water and wastewater;<br />
(2) calculate depreciation charges from the above by assuming an average economic life of<br />
30 years;<br />
(3) calculate additional operation & maintenance costs<br />
(4) divide the total capital and operation & maintenance costs by the total volume of water<br />
sold in the country<br />
Chart 18 Additional Operation & Maintenance Costs and Depreciation [ U$ / m³ ]
Additional Depreciation Water<br />
Additional O&M Wastew ater<br />
Additional O&M Water<br />
Additional Depreciation Wastew ater<br />
0,20 0,10 0,00 0,10 0,20 0,30 0,40<br />
Bosnia-Herzegovina<br />
Federation of<br />
Srpska<br />
Bulgaria<br />
Sofia District<br />
Croatia<br />
Zagreb<br />
Czech Republic<br />
Brno<br />
Perov<br />
Hungary<br />
Budapest<br />
Miskolc<br />
Romania<br />
Cluj<br />
Slovenia<br />
Ptuj<br />
Velenje<br />
Slovakia<br />
Bratislava<br />
Yugoslavia<br />
Belgrade<br />
Indjija<br />
Novi Sad<br />
Leskovac<br />
The left side of the chart shows the additional unit costs for water concerning the depreciation. In<br />
line with the above described assumptions, there are only depreciation charges shown. The right<br />
side of the chart shows operation & maintenance unit costs and, on top of that, depreciation unit<br />
costs concerning wastewater<br />
Chart 19 Additional Unit Costs versus Affordable <strong>Tariff</strong> Increase [ U$ / m³ ]
Possible Increase Additional O&M Costs Additional Depreciation<br />
3,00 2,50 2,00 1,50 1,00 0,50 0,00 0,50 1,00<br />
Bosnia-Herzegovina<br />
Federation of<br />
Srpska<br />
Bulgaria<br />
Sofia District<br />
Croatia<br />
Zagreb<br />
Czech Republic<br />
Brno<br />
Perov<br />
Hungary<br />
Budapest<br />
Miskolc<br />
Romania<br />
Cluj<br />
Slovenia<br />
Ptuj<br />
Velenje<br />
Slovakia<br />
Bratislava<br />
Yugoslavia<br />
Belgrade<br />
Indjija<br />
Novi Sad<br />
Leskovac<br />
This chart is comparing the affordable tariff increase on the left side, see Chart 10, with the<br />
additional unit costs from planned, future investment on the right side. The unit costs are taken<br />
from Chart 17, but no longer separate between water and wastewater.<br />
In principle, this chart should show in which countries or cities the investment budgets are<br />
affordable or not. In other words, this should be the essence of the tariff study. However, in<br />
the light of the above described concerns regarding current level of unit costs and the<br />
methodology of calculating future unit costs, this chart should be treated with great care. It is more<br />
an exemplary, arithmetic exercise than the result of a solid and reliable analysis.<br />
What we see is that the published investment budgets would be affordable in all countries of the<br />
study area, except Bosnia-Herzegovina. But this by no means is a valid statement for individual<br />
water or wastewater projects at municipality level:<br />
• Economic reform and commercial development typically starts in the capital cities, with<br />
secondary cities following. Consequently, income levels in these cities will be above<br />
national average, with higher ability and willingness to pay for infrastructure and<br />
environmental improvements. But on the other hand, the income levels of the urban poor<br />
may remain stagnant which then would require tariff systems with a social bias or direct<br />
government support to the poor.<br />
• Increasing prices will usually result in a drop of demand (price elasticity of demand). Thus<br />
increasing the price of water by e.g. 100% (double) may result in a drop of demand by<br />
e.g. 10%. The resulting, overall increase of revenue therefore would not amount to 100%<br />
(double), but only 90%. The actual customer reaction to price increases may vary from<br />
city to city.<br />
• Besides industrial pollution, water and sanitation related health hazards or nuisances first<br />
occur in high density, urban areas.<br />
• The specific investment costs for network development, water and even more sewerage,<br />
depend on population density or, better, connections per length of network.<br />
• The specific investment costs for wastewater treatment depend on the capacity of the<br />
treatment facility.
• Current levels of expenditure on preventative maintenance or reinvestment might be<br />
insuffiicent.<br />
Therefore, the question to ask is not whether piped water supply, pipeborne sewerage systems<br />
and wastewater treatment plants are necessary and affordable to the target population of a<br />
particular country of the study area. The question is which cities should have and could afford<br />
piped water supply, pipeborne sewerage systems and wastewater treatment plants. In a more<br />
simple way, the question should be which size of city requires and could afford piped water<br />
supply, pipeborne sewerage systems and wastewater treatment plants. When looking at network<br />
development at municipality level, the question is for which city districts piped water supply and/or<br />
pipeborne sewerage systems could be justified.<br />
2.6 Alternative Approach towards Future Unit Costs<br />
Since the planned investment in water supply are most likely in the fields of water loss reduction,<br />
increase or rural service levels, network and process optimisation rather than large scale green<br />
field projects, a simplified approach with experienced based unit prices or specific investment<br />
costs is not possible.<br />
On the other hand, the larger portion of published, national investment budgets in the study area<br />
is in increasing connection rates to pipeborne sewerage systems, the rehabilitation, upgrade and<br />
construction of wastewater treatment plants.<br />
2.7 Outlook on Future Activities<br />
The presented tariff study describes the tariff structure in the countries in the Danube catchment<br />
area and in several water supply and wastewater disposal companies. Due to the high diversity of<br />
the presented data, a detailed comparison and a strict evaluation of the economic and technical<br />
performance capacity is very difficult. Moreover, the specific economic and social situation in<br />
distinct regions cannot be sufficiently included in the comparison. Still, such regional comparisons<br />
are<br />
extremely important for investment decisions. It is therefore recommended to conclude a<br />
separate, regionally balanced tariff study based on the presented results. In this regional study,<br />
about 50 regional water supply companies should take part in order to be able to consider the<br />
specific regional problems. The preparation of such a regional study on the basis of the existing<br />
findings will take at least 3 years.<br />
Max Hammerer<br />
Project Manager August 2002<br />
3. Adresses<br />
IAWD<br />
International Association of Water Supply Companies in the Danube Catchment Area<br />
c/o Vienna Waterworks<br />
Grabnergasse 6<br />
A-1060 Vienna<br />
Dipl.Ing. Hans Sailer, President<br />
Dipl.Ing. Walter Kling, Secretary General<br />
Tel. +43 1 59959-31006<br />
Fax +43 1 59959-7231<br />
E-mail: office@iawd.at<br />
Internet: www.iawd.at<br />
Project Manager<br />
Max Hammerer, Consultant<br />
Golgathaweg 1<br />
A-9020 Klagenfurt<br />
Tel. +43 463 502906
Fax +43 463 502906-4<br />
E-mail: mhammerer@compuserve.com<br />
<strong>Tariff</strong> <strong>Study</strong> Cooperation Partners in the Countries<br />
Slovenia<br />
Gospodarska Zbornica Slovenije<br />
Chamber of Commerce and Industry of Slovenia<br />
Mr. Dusan Butina<br />
Dusan.Butina@gzs.si<br />
Dimiceva 13 Tel. +386 1 5898-238<br />
SL-1504 Ljubljana Fax +386 1 5898-100 (200)<br />
Croatia<br />
Casopis Hrvatske Grupacije Vodovoda i Kanalizacije (Vodoopskrba i Odvodnja d.o.o.)<br />
Croatian Water and Wastewater Association (Wasser und Kanal Zagreb)<br />
Mrs. Branka Beovic, Mr. Srecko Milic<br />
branka.beovic@vio.hr<br />
Folnegoviceva 1 (Dir.: Patacickina 1b) Tel. +385 1 6187-111<br />
HR-10000 Zagreb Fax +385 1 6187-153<br />
Bosnia-Herzegovina<br />
Institut za Hidrotehniku Gradevinskog Fakulteta u Sarajevo<br />
Hydro Engineering Institute Sarajevo<br />
Mr. Branko Vucijak<br />
bvucijak@utic.net.ba<br />
Stjepana Tomica 1 Tel. +387 33 212466<br />
BH-71000 Sarajevo Fax +387 33 207949<br />
Yugoslavia<br />
Belgrade Waterworks and Sewerage<br />
Gen.Dir. Vladimir Tausanovic<br />
gendir@bvk.co.yu<br />
Kneza Milosa 27 Tel. +381 11 3612790<br />
YU-11000 Belgrade Fax +381 11 3612123<br />
Bulgaria<br />
Bulgarian Water Supply and Sewerage Association (BAWK)<br />
Prof.Dr. Teniu Peitchev<br />
bawk@mail.prosoft.bg<br />
17-19, Kiril y Metodii Str. Tel.+Fax +359 2 9875079<br />
BG-1202 Sofia Tel.+Fax +359 2 582983<br />
Romania<br />
Asociatia Romana Apei<br />
Romanian Water Association<br />
Mr. Vasile Ciomos<br />
vciomos@yahoo.com<br />
Splaiul Independentei, nr. 202A, et. 9 Tel. +40 1 410-3872<br />
R-78123 Bucharesti Fax +40 1 410-3872<br />
Hungary<br />
Viz-, Csatornamüvek Orszagos Szakmai Szövetsege<br />
Hungarian Professional Association of Water and Sewerage Companies<br />
Mr. Csaba Varszegi<br />
vcsoszsz@kern.hu<br />
Sas. Ul. 25 Tel. +36 1 3027600<br />
H-1051 Budapest Fax +36 1 3123066
Slovakia<br />
Vyskumny Ustav Vodneho Hospodarstva<br />
Water Research Institute<br />
Mrs. Bozena Borgulova<br />
sciesecr@vuvh.sk<br />
Nabr. Arm. Gen. L. Svobodu 5 Tel. +421 2 5934-3345<br />
SK-81249 Bratislava Fax +421 2 5441-5743<br />
Czech Republic<br />
Vodarenska Akciova Spolecnost a.s.<br />
Water Treatment and Distribution Company, plc<br />
RNDr. Miroslav Vykydal<br />
vykydal@vodarenska.cz<br />
Sobesicka 156 Tel. +420 5 4553-2322<br />
CZ-63801 Brno Fax +420 5 4522-2820<br />
Austria<br />
Vienna Waterworks<br />
Managing Director Hans Sailer<br />
sai@m31.magwien.gv.at<br />
Grabnergasse 6 Tel. +43 1 59959-31001<br />
A-1060 Vienna Fax: +43 1 59959-7231<br />
UNOPS<br />
International Commission for the Protection of the Danube River (<strong>ICPDR</strong>)<br />
Mrs. Michaela Popovici<br />
Vienna International Centre, room D 0416<br />
michaela.popovici@unvienna.org<br />
Wagramer Strasse 5 Tel. +43 1 26060-4502<br />
A-1220 Vienna Fax: +43 1 26060-5895<br />
International Association of Waterworks in the Danube Catchment Area (IAWD)<br />
Mr. Walter Kling, Mrs. Katherine Wagner<br />
wak@m31.magwien.gv.at<br />
Grabnergasse 6 Tel. +43 1 59959-31306<br />
A-1060 Vienna Fax: +43 1 59959-7231<br />
Koordination<br />
hammerer-system-messtechnik<br />
Max Hammerer<br />
Mhammerer@compuserve.com<br />
Golgathaweg 1 Tel. +43 463 502906<br />
A-9020 Klagenfurt Fax: +43 463 502906-4<br />
Notes: