A semi-automatic approach for workflow staff assignment - Faculty of ...
A semi-automatic approach for workflow staff assignment - Faculty of ...
A semi-automatic approach for workflow staff assignment - Faculty of ...

You also want an ePaper? Increase the reach of your titles
YUMPU automatically turns print PDFs into web optimized ePapers that Google loves.
Y. Liu et al. / Computers in Industry 59 (2008) 463–476 471<br />
represents the activity number, which is defined in decreasing<br />
order <strong>of</strong> their training set sizes.<br />
In Fig. 7, the first row <strong>of</strong> subfigures (subfigure a–c) illustrates<br />
each activity’s training set size. The vertical axis represents the<br />
number <strong>of</strong> training samples <strong>for</strong> each activity. In the real<br />
situation, it reveals the number <strong>of</strong> times that the target activity<br />
has been executed. The second row <strong>of</strong> subfigures illustrates the<br />
number <strong>of</strong> classes <strong>for</strong> each training set. The vertical axis<br />
represents the class number. In our <strong>approach</strong>, the class is<br />
represented by actor’s identity. There<strong>for</strong>e, this number<br />
demonstrates how many different actors have executed the<br />
target activity. The last row <strong>of</strong> subfigures depicts the number <strong>of</strong><br />
features <strong>for</strong> each training set. The vertical axis is the feature<br />
number. Because we use previous activities <strong>of</strong> the target activity<br />
as features, this number demonstrates how many activities in a<br />
<strong>workflow</strong> model have the precedence relationship with the<br />
target activity.<br />
For example, in enterprise A (the first column <strong>of</strong> subfigures<br />
in Fig. 7), the property <strong>of</strong> the first activity corresponds to the left<br />
most pixel <strong>of</strong> each subfigure. This activity is a review activity <strong>of</strong><br />
a CAD drawing design process, which is the second activity <strong>of</strong><br />
the <strong>workflow</strong> model. 58 different actors executed it <strong>for</strong> 316<br />
times in the past. There<strong>for</strong>e, the training set <strong>of</strong> this activity<br />
contains 316 training samples, 58 classes and 2 features (one<br />
feature <strong>for</strong> the actor <strong>of</strong> the first activity and the other <strong>for</strong> the<br />
initiator <strong>of</strong> the <strong>workflow</strong> instance). It is important to mention<br />
that, in Definition 3, the start node is also included in the<br />
precedence activity sequences to represent the instantiation<br />
event <strong>of</strong> <strong>workflow</strong>, so there is always one more feature than the<br />
number <strong>of</strong> activities.<br />
According to Fig. 7, we may find that the size <strong>of</strong> the<br />
training set is not the same <strong>for</strong> each activity, which implies a<br />
different execution frequency. However, this unbalanced<br />
execution frequency does not have much impact on the<br />
number <strong>of</strong> past actors (i.e., the second row <strong>of</strong> subfigures),<br />
which means the activities are designed to be undertaken by<br />
many actors. Moreover, judging from the number <strong>of</strong> features,<br />
we can see that the activities that need run-time <strong>staff</strong><br />
<strong>assignment</strong> are located in different places <strong>of</strong> the <strong>workflow</strong><br />
model.<br />
4.2. Prediction accuracy <strong>of</strong> classifiers<br />
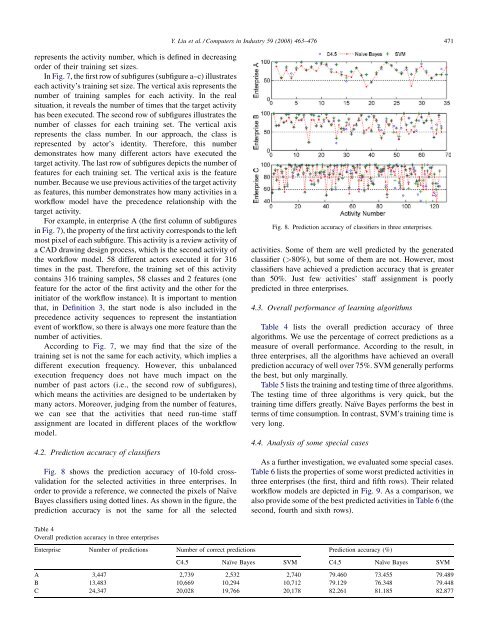
Fig. 8 shows the prediction accuracy <strong>of</strong> 10-fold crossvalidation<br />
<strong>for</strong> the selected activities in three enterprises. In<br />
order to provide a reference, we connected the pixels <strong>of</strong> Naïve<br />
Bayes classifiers using dotted lines. As shown in the figure, the<br />
prediction accuracy is not the same <strong>for</strong> all the selected<br />
Fig. 8. Prediction accuracy <strong>of</strong> classifiers in three enterprises.<br />
activities. Some <strong>of</strong> them are well predicted by the generated<br />
classifier (>80%), but some <strong>of</strong> them are not. However, most<br />
classifiers have achieved a prediction accuracy that is greater<br />
than 50%. Just few activities’ <strong>staff</strong> <strong>assignment</strong> is poorly<br />
predicted in three enterprises.<br />
4.3. Overall per<strong>for</strong>mance <strong>of</strong> learning algorithms<br />
Table 4 lists the overall prediction accuracy <strong>of</strong> three<br />
algorithms. We use the percentage <strong>of</strong> correct predictions as a<br />
measure <strong>of</strong> overall per<strong>for</strong>mance. According to the result, in<br />
three enterprises, all the algorithms have achieved an overall<br />
prediction accuracy <strong>of</strong> well over 75%. SVM generally per<strong>for</strong>ms<br />
the best, but only marginally.<br />
Table 5 lists the training and testing time <strong>of</strong> three algorithms.<br />
The testing time <strong>of</strong> three algorithms is very quick, but the<br />
training time differs greatly. Naïve Bayes per<strong>for</strong>ms the best in<br />
terms <strong>of</strong> time consumption. In contrast, SVM’s training time is<br />
very long.<br />
4.4. Analysis <strong>of</strong> some special cases<br />
As a further investigation, we evaluated some special cases.<br />
Table 6 lists the properties <strong>of</strong> some worst predicted activities in<br />
three enterprises (the first, third and fifth rows). Their related<br />
<strong>workflow</strong> models are depicted in Fig. 9. As a comparison, we<br />
also provide some <strong>of</strong> the best predicted activities in Table 6 (the<br />
second, fourth and sixth rows).<br />
Table 4<br />
Overall prediction accuracy in three enterprises<br />
Enterprise Number <strong>of</strong> predictions Number <strong>of</strong> correct predictions Prediction accuracy (%)<br />
C4.5 Naïve Bayes SVM C4.5 Naïve Bayes SVM<br />
A 3,447 2,739 2,532 2,740 79.460 73.455 79.489<br />
B 13,483 10,669 10,294 10,712 79.129 76.348 79.448<br />
C 24,347 20,028 19,766 20,178 82.261 81.185 82.877