CONSOLIDATED FINANCIAL STATEMENTS - Boston Scientific
CONSOLIDATED FINANCIAL STATEMENTS - Boston Scientific
CONSOLIDATED FINANCIAL STATEMENTS - Boston Scientific

Create successful ePaper yourself
Turn your PDF publications into a flip-book with our unique Google optimized e-Paper software.
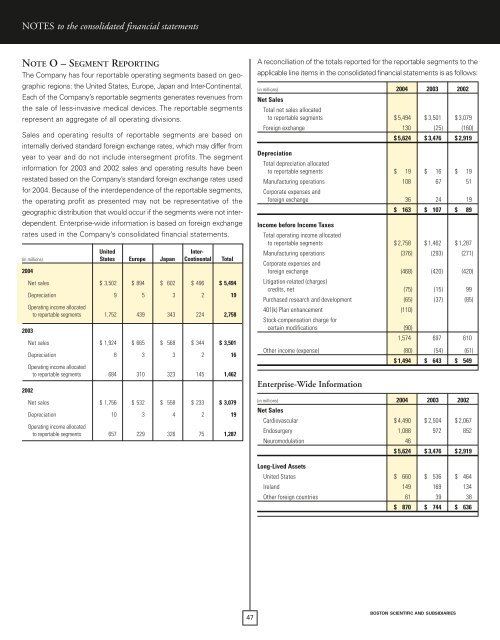
NOTES to the consolidated financial statements<br />
NOTE O – SEGMENT REPORTING<br />
The Company has four reportable operating segments based on geographic<br />
regions: the United States, Europe, Japan and Inter-Continental.<br />
Each of the Company’s reportable segments generates revenues from<br />
the sale of less-invasive medical devices. The reportable segments<br />
represent an aggregate of all operating divisions.<br />
Sales and operating results of reportable segments are based on<br />
internally derived standard foreign exchange rates, which may differ from<br />
year to year and do not include intersegment profits. The segment<br />
information for 2003 and 2002 sales and operating results have been<br />
restated based on the Company’s standard foreign exchange rates used<br />
for 2004. Because of the interdependence of the reportable segments,<br />
the operating profit as presented may not be representative of the<br />
geographic distribution that would occur if the segments were not interdependent.<br />
Enterprise-wide information is based on foreign exchange<br />
rates used in the Company’s consolidated financial statements.<br />
United Inter-<br />
(in millions)<br />
2004<br />
States Europe Japan Continental Total<br />
Net sales $ 3,502 $ 894 $ 602 $ 496 $ 5,494<br />
Depreciation<br />
Operating income allocated<br />
9 5 3 2 19<br />
to reportable segments 1,752 439 343 224 2,758<br />
2003<br />
Net sales $ 1,924 $ 665 $ 568 $ 344 $ 3,501<br />
Depreciation<br />
Operating income allocated<br />
8 3 3 2 16<br />
to reportable segments 684 310 323 145 1,462<br />
2002<br />
Net sales $ 1,756 $ 532 $ 558 $ 233 $ 3,079<br />
Depreciation<br />
Operating income allocated<br />
10 3 4 2 19<br />
to reportable segments 657 229 326 75 1,287<br />
47<br />
A reconciliation of the totals reported for the reportable segments to the<br />
applicable line items in the consolidated financial statements is as follows:<br />
(in millions)<br />
Net Sales<br />
Total net sales allocated<br />
2004 2003 2002<br />
to reportable segments $ 5,494 $ 3,501 $ 3,079<br />
Foreign exchange 130 (25) (160)<br />
$ 5,624 $ 3,476 $ 2,919<br />
Depreciation<br />
Total depreciation allocated<br />
to reportable segments $ 19 $ 16 $ 19<br />
Manufacturing operations<br />
Corporate expenses and<br />
108 67 51<br />
foreign exchange 36 24 19<br />
$ 163 $ 107 $ 89<br />
Income before Income Taxes<br />
Total operating income allocated<br />
to reportable segments $ 2,758 $ 1,462 $ 1,287<br />
Manufacturing operations<br />
Corporate expenses and<br />
(376) (293) (271)<br />
foreign exchange<br />
Litigation-related (charges)<br />
(468) (420) (420)<br />
credits, net (75) (15) 99<br />
Purchased research and development (65) (37) (85)<br />
401(k) Plan enhancement<br />
Stock-compensation charge for<br />
(110)<br />
certain modifications (90)<br />
1,574 697 610<br />
Other income (expense) (80) (54) (61)<br />
$ 1,494 $ 643 $ 549<br />
Enterprise-Wide Information<br />
(in millions)<br />
Net Sales<br />
2004 2003 2002<br />
Cardiovascular $ 4,490 $ 2,504 $ 2,067<br />
Endosurgery 1,088 972 852<br />
Neuromodulation 46<br />
$ 5,624 $ 3,476 $ 2,919<br />
Long-Lived Assets<br />
United States $ 660 $ 536 $ 464<br />
Ireland 149 169 134<br />
Other foreign countries 61 39 38<br />
$ 870 $ 744 $ 636<br />
BOSTON SCIENTIFIC AND SUBSIDIARIES