CONSOLIDATED FINANCIAL STATEMENTS - Boston Scientific
CONSOLIDATED FINANCIAL STATEMENTS - Boston Scientific
CONSOLIDATED FINANCIAL STATEMENTS - Boston Scientific

Create successful ePaper yourself
Turn your PDF publications into a flip-book with our unique Google optimized e-Paper software.
MANAGEMENT’S DISCUSSION AND ANALYSIS of financial condition and results of operations<br />
Further, the trend in countries around the world, including Japan,<br />
toward more stringent regulatory requirements for product clearance,<br />
changing reimbursement models and more vigorous enforcement<br />
activities has generally caused or may cause medical device manufacturers<br />
like us to experience more uncertainty, delay, greater risk<br />
and higher expenses. In addition, we are required to renew regulatory<br />
approvals in certain international jurisdictions, which may<br />
require additional testing and documentation. A decision not to<br />
dedicate sufficient resources, or the failure to timely renew these<br />
approvals, may limit our ability to market our full line of existing<br />
products within these jurisdictions.<br />
These factors may impact the rate at which we can grow. However,<br />
management believes that we are poised to take advantage of<br />
opportunities that exist in the markets we serve.<br />
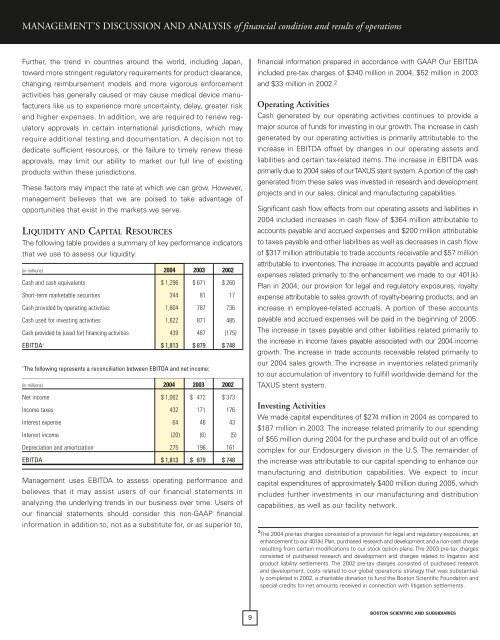
LIQUIDITY AND CAPITAL RESOURCES<br />
The following table provides a summary of key performance indicators<br />
that we use to assess our liquidity:<br />
(in millions) 2004 2003 2002<br />
Cash and cash equivalents $ 1,296 $ 671 $ 260<br />
Short-term marketable securities 344 81 17<br />
Cash provided by operating activities 1,804 787 736<br />
Cash used for investing activities 1,622 871 485<br />
Cash provided by (used for) financing activities 439 487 (175)<br />
EBITDA * $ 1,813 $ 879 $ 748<br />
* The following represents a reconciliation between EBITDA and net income:<br />
(in millions) 2004 2003 2002<br />
Net income $ 1,062 $ 472 $ 373<br />
Income taxes 432 171 176<br />
Interest expense 64 46 43<br />
Interest income (20) (6) (5)<br />
Depreciation and amortization 275 196 161<br />
EBITDA $ 1,813 $ 879 $ 748<br />
Management uses EBITDA to assess operating performance and<br />
believes that it may assist users of our financial statements in<br />
analyzing the underlying trends in our business over time. Users of<br />
our financial statements should consider this non-GAAP financial<br />
information in addition to, not as a substitute for, or as superior to,<br />
9<br />
financial information prepared in accordance with GAAP. Our EBITDA<br />
included pre-tax charges of $340 million in 2004, $52 million in 2003<br />
and $33 million in 2002. 2<br />
Operating Activities<br />
Cash generated by our operating activities continues to provide a<br />
major source of funds for investing in our growth. The increase in cash<br />
generated by our operating activities is primarily attributable to the<br />
increase in EBITDA offset by changes in our operating assets and<br />
liabilities and certain tax-related items. The increase in EBITDA was<br />
primarily due to 2004 sales of our TAXUS stent system. A portion of the cash<br />
generated from these sales was invested in research and development<br />
projects and in our sales, clinical and manufacturing capabilities.<br />
Significant cash flow effects from our operating assets and liabilities in<br />
2004 included increases in cash flow of $364 million attributable to<br />
accounts payable and accrued expenses and $200 million attributable<br />
to taxes payable and other liabilities as well as decreases in cash flow<br />
of $317 million attributable to trade accounts receivable and $57 million<br />
attributable to inventories. The increase in accounts payable and accrued<br />
expenses related primarily to the enhancement we made to our 401(k)<br />
Plan in 2004; our provision for legal and regulatory exposures; royalty<br />
expense attributable to sales growth of royalty-bearing products; and an<br />
increase in employee-related accruals. A portion of these accounts<br />
payable and accrued expenses will be paid in the beginning of 2005.<br />
The increase in taxes payable and other liabilities related primarily to<br />
the increase in income taxes payable associated with our 2004 income<br />
growth. The increase in trade accounts receivable related primarily to<br />
our 2004 sales growth. The increase in inventories related primarily<br />
to our accumulation of inventory to fulfill worldwide demand for the<br />
TAXUS stent system.<br />
Investing Activities<br />
We made capital expenditures of $274 million in 2004 as compared to<br />
$187 million in 2003. The increase related primarily to our spending<br />
of $55 million during 2004 for the purchase and build out of an office<br />
complex for our Endosurgery division in the U.S. The remainder of<br />
the increase was attributable to our capital spending to enhance our<br />
manufacturing and distribution capabilities. We expect to incur<br />
capital expenditures of approximately $400 million during 2005, which<br />
includes further investments in our manufacturing and distribution<br />
capabilities, as well as our facility network.<br />
2 The 2004 pre-tax charges consisted of a provision for legal and regulatory exposures, an<br />
enhancement to our 401(k) Plan, purchased research and development and a non-cash charge<br />
resulting from certain modifications to our stock option plans. The 2003 pre-tax charges<br />
consisted of purchased research and development and charges related to litigation and<br />
product liability settlements. The 2002 pre-tax charges consisted of purchased research<br />
and development, costs related to our global operations strategy that was substantially<br />
completed in 2002, a charitable donation to fund the <strong>Boston</strong> <strong>Scientific</strong> Foundation and<br />
special credits for net amounts received in connection with litigation settlements.<br />
BOSTON SCIENTIFIC AND SUBSIDIARIES