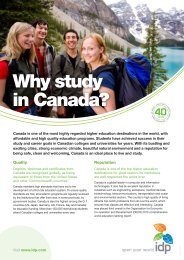
Australian Student Visa Statistics – An Analysis - IDP Education
Australian Student Visa Statistics – An Analysis - IDP Education
Australian Student Visa Statistics – An Analysis - IDP Education

You also want an ePaper? Increase the reach of your titles
YUMPU automatically turns print PDFs into web optimized ePapers that Google loves.
<strong>Australian</strong> <strong>Student</strong> <strong>Visa</strong> <strong>Statistics</strong> <strong>–</strong><br />
<strong>An</strong> <strong>An</strong>alysis<br />
January to December, 2003<br />
Presented by:<br />
<strong>IDP</strong> <strong>Education</strong> Australia
TABLE OF CONTENTS<br />
STUDENT VISA STATISTICS: JANUARY TO DECEMBER, 2003 4<br />
THREE IMPORTANT EXPLANATORY NOTES: 4<br />
DIMIA e-visas 4<br />
Reporting by Citizenship 4<br />
July 2001 <strong>Visa</strong> Changes <strong>–</strong> Impact on Reported <strong>Visa</strong> Numbers 5<br />
1.0 All Offshore <strong>Student</strong> <strong>Visa</strong>s 6<br />
1.1 Total Offshore <strong>Visa</strong>s 6<br />
1.2 All Off-shore <strong>Visa</strong>s by Citizenship 7<br />
2.0 Offshore Higher <strong>Education</strong> <strong>Visa</strong>s 10<br />
2.1 Total Number of Offshore Higher <strong>Education</strong> <strong>Visa</strong>s 10<br />
2.2 Offshore Higher <strong>Education</strong> <strong>Visa</strong>s by Citizenship 11<br />
3.0 Offshore Schools <strong>Visa</strong>s 14<br />
3.1 Total Number of Offshore School <strong>Visa</strong>s 14<br />
3.2 Offshore School Sector <strong>Visa</strong>s by Citizenship 14<br />
4.0 Offshore Independent ELICOS 16<br />
4.1 Total Number of Offshore Independent ELICOS <strong>Visa</strong>s 16<br />
4.2 Offshore Independent ELICOS <strong>Visa</strong>s by Citizenship 16<br />
5.0 Offshore Vocational <strong>Education</strong> and Training (VET) 19<br />
5.1 Total Number of Offshore VET <strong>Visa</strong>s 19<br />
5.2 Offshore VET Sector <strong>Visa</strong>s Issued by Citizenship 19<br />
6.0 Offshore E-visas 21<br />
6.1 Total Number of Offshore E-<strong>Visa</strong>s 21<br />
6.2 E-visa Issued by Citizenship 21<br />
7.0 Onshore <strong>Visa</strong>s 22<br />
7.1 Total Number of Onshore <strong>Visa</strong>s 22<br />
7.2 Onshore <strong>Visa</strong>s Issued by Citizenship 22
STUDENT VISA STATISTICS: January to December 2003<br />
The allocation of visas for study in Australia provides a crude indicator of trends in<br />
international student enrolments. <strong>IDP</strong> <strong>Education</strong> Australia analyses these trends based on<br />
visa figures supplied by Australia’s Department of Immigration and Multicultural and<br />
Indigenous Affairs (DIMIA).<br />
DIMIA has supplied figures to the end of December 2003, enabling comparisons with<br />
previous years. These comparisons are presented in the following analysis.<br />
THREE IMPORTANT EXPLANATORY NOTES:<br />
DIMIA e-visas<br />
DIMIA has implemented a new form of service delivery available to clients who are seeking<br />
new or replacement visas. This service is called e-visas. This service does not replace the<br />
current existing ways of visa applications through <strong>Australian</strong> DIMIA offices (onshore) or<br />
<strong>Australian</strong> Government offices overseas.<br />
According to DIMIA, the ability to lodge visa applications on the Internet is currently limited<br />
to a small number of temporary entry and permanent entry types. In some countries it<br />
includes student visa applications for specific visa classes.<br />
This report includes an analysis of student e-visas issued to prospective students offshore<br />
(i.e. outside of Australia).<br />
Information about e-visas can be found at: http://www.dimia.gov.au/e_visa/index.htm<br />
Reporting by Citizenship<br />
Previously <strong>IDP</strong> has reported visa statistics by the country in which the visa was issued (the<br />
“visa issuing post”). After careful consideration <strong>IDP</strong> has decided to report the statistics by<br />
the country of citizenship of the person to whom the visa was issued, which <strong>IDP</strong> believes<br />
provides greater depth of information across a greater range of countries, and also allows<br />
the accurate reporting of e-visas.<br />
This will result in some changes in the results, compared to previous reports that <strong>IDP</strong> has<br />
posted on www.idp.com. In particular, previously where a country did not have a visa issuing<br />
post, the visas issued to the citizens of that country were reported under the issuing country.<br />
For example: for the period July <strong>–</strong> September 2002, 411 student visas were issued to Czech<br />
Republic citizens, of which the Austrian issuing post issued 410. Previously those visas were<br />
included in the reporting for Austria. However, now that <strong>IDP</strong> is analysing by citizenship, they<br />
will be included in the reporting for Czech Republic. There are several other similar cases<br />
worldwide.<br />
Consequently, within this report, where the word “country” is used, it refers to the citizens of<br />
that country, unless otherwise specified.<br />
For the period January-December 2003, DIMIA reported visa statistics for 81 visa issuing<br />
posts and 187 citizenships.<br />
<strong>IDP</strong> <strong>Education</strong> Australia <strong>Visa</strong> Report <strong>–</strong> <strong>An</strong>nual 2003 4
July 2001 <strong>Visa</strong> Changes <strong>–</strong> Impact on Reported <strong>Visa</strong> Numbers<br />
From July 2001, prospective students applying for visas under the regulations for<br />
Assessment Levels 3 and 4 (see http://www.dimia.gov.au/students/assessment.htm) have<br />
needed to package their courses together if they wished to study more than one course in<br />
Australia. For such students, the visa is issued for the principal course which they will be<br />
studying. <strong>An</strong> example would be a student from China wanting to come to Australia to study<br />
an ELICOS course, followed by a vocational education course (such as a diploma), to enable<br />
entry into a higher education course in Australia. The visa for this student would be included<br />
under the category ‘Higher <strong>Education</strong>’, even though they are commencing their study in<br />
other sectors. This leads to an under-reporting of the number of students going into ELICOS,<br />
foundation and vocational education programs from these countries, from July 2001<br />
onwards. Hence the annual change between 2001 (whole year) and 2002 (whole year) may<br />
appear more negative than it actually is for these visa classes, and more positive than it<br />
actually is for higher education.<br />
<strong>IDP</strong> <strong>Education</strong> Australia <strong>Visa</strong> Report <strong>–</strong> <strong>An</strong>nual 2003 5
1.0 All Offshore <strong>Student</strong> <strong>Visa</strong>s<br />
1.1 Total Offshore <strong>Visa</strong>s<br />
• The total number of visas issued offshore for all visa classes for the 2003 calendar<br />
year was 110,504. This represents an increase of 14% over the same period in 2002.<br />
Figure 1<br />
Total <strong>Visa</strong>s Issued Offshore<br />
115000<br />
110000<br />
110,504<br />
105000<br />
100000<br />
97,267<br />
95000<br />
90000<br />
2002 2003<br />
Figure 2<br />
<strong>Visa</strong>s Issued offshore by class<br />
60000<br />
50000<br />
2002 2003<br />
40000<br />
30000<br />
20000<br />
10000<br />
0<br />
Higher<br />
<strong>Education</strong><br />
Independent<br />
ELICOS<br />
Vocational<br />
<strong>Education</strong><br />
Non-award/<br />
Foundation<br />
School<br />
Secondary<br />
Exchange<br />
AusAID<br />
Defence<br />
• The number of visas issued increased for all visa classes excluding Vocational<br />
<strong>Education</strong>, AusAID and Defence.<br />
• The dramatic increase in the Non-award/Foundation studies sector can be attributed<br />
to a change in the classification scheme utilized by DIMIA. While in the past,<br />
students participating in Study Abroad and Higher <strong>Education</strong> Exchange programs<br />
may have been classed as Higher <strong>Education</strong> students, they are now placed in the<br />
<strong>IDP</strong> <strong>Education</strong> Australia <strong>Visa</strong> Report <strong>–</strong> <strong>An</strong>nual 2003 6
Non-award/ Foundation Studies category. The implication of this amendment is to<br />
elevate the number of Non-award visas in 2003, while simultaneously diminishing<br />
growth in Higher <strong>Education</strong> visas.<br />
Table 1<br />
<strong>Visa</strong>s issued offshore by class<br />
<strong>Visa</strong> Class 2002<br />
% of all<br />
visas 2003<br />
% of all<br />
visas<br />
%<br />
Growth<br />
Higher <strong>Education</strong> 50,290 52% 56,726 51% 13%<br />
Independent ELICOS 16,277 17% 17,432 16% 7%<br />
Vocational <strong>Education</strong> 11,615 12% 11,169 10% -4%<br />
Non-award/foundation studies/ other 4,614 5% 10,245 9% 122%<br />
School 9,619 10% 10,550 10% 10%<br />
Secondary Exchange 2,256 2% 2,264 2% 0%<br />
AusAID 2,219 2% 1,781 2% -20%<br />
Defence 377 0% 337 0% -11%<br />
Total All <strong>Visa</strong> Classes 97,267 100% 110,504 100% 14%<br />
1.2 All Off-shore <strong>Visa</strong>s by Citizenship<br />
• Table 2 indicates the number (and growth) of visas issued to citizens of the top 20<br />
countries for the period January-December 2003.<br />
• The greatest numbers of student visas were granted to Chinese citizens, followed by<br />
USA, South Korea, India and Malaysia.<br />
• Of the top 20 countries, India (121%), Bangladesh (67%) and South Korea (54%)<br />
experienced the highest growth.<br />
• The countries with the largest increase in the actual number of visas issued were:<br />
China (4634), India (4164), South Korea (2707), the United States (1055) and<br />
Bangladesh (770).<br />
• Although several countries in the top 20 experienced a decline, the largest occurred<br />
in Hong Kong (976 or 14%), Taiwan (580 or 20%) and Singapore (445 or 10%).<br />
<strong>IDP</strong> <strong>Education</strong> Australia <strong>Visa</strong> Report <strong>–</strong> <strong>An</strong>nual 2003 7
Table 2<br />
<strong>Visa</strong>s issued by category<br />
Offshore by citizenship<br />
Top 20 Source Countries<br />
Country 2002 2003 % Growth<br />
China 12,519 17,153 37%<br />
USA 9,435 10,490 11%<br />
South Korea 4,993 7,700 54%<br />
India 3,442 7,606 121%<br />
Malaysia 7,385 7,530 2%<br />
Japan 6,176 6,357 3%<br />
Hong Kong 6,765 5,789 -14%<br />
Thailand 5,296 5,385 2%<br />
Indonesia 5,764 5,331 -8%<br />
Singapore 4,317 3,872 -10%<br />
Germany 2,123 2,868 35%<br />
Taiwan 2,963 2,383 -20%<br />
Bangladesh 1,157 1,927 67%<br />
Canada 1,718 1,846 7%<br />
Brazil 2,014 1,829 -9%<br />
United Kingdom 1,101 1,680 53%<br />
Norway 1,669 1,656 -1%<br />
Sweden 1,526 1,418 -7%<br />
France 1,261 1,262 0%<br />
Viet Nam 902 1,094 21%<br />
Total 97,267 110,504 14%<br />
Figure 3 (below) illustrates trends in the top 15 source countries.<br />
Figure 3<br />
Offshore <strong>Visa</strong>s by Citizenship<br />
20000<br />
18000<br />
16000<br />
14000<br />
12000<br />
10000<br />
8000<br />
6000<br />
4000<br />
2000<br />
0<br />
Jan - Dec 2002<br />
Jan - Dec 2003<br />
China<br />
USA<br />
South Korea<br />
India<br />
Malaysia<br />
Japan<br />
Hong Kong<br />
Thailand<br />
Indonesia<br />
Singapore<br />
Germany<br />
Taiwan<br />
Bangladesh<br />
Canada<br />
Brazil<br />
<strong>IDP</strong> <strong>Education</strong> Australia <strong>Visa</strong> Report <strong>–</strong> <strong>An</strong>nual 2003 8
• Figures 4A and 4B illustrate the countries with the greatest growth or decline<br />
amongst the top 30 source countries.<br />
140%<br />
Figure 4a<br />
Growth in Offshore <strong>Visa</strong>s<br />
Selected Countries by Citizenship<br />
120%<br />
100%<br />
80%<br />
60%<br />
40%<br />
20%<br />
0%<br />
India<br />
Bangladesh<br />
0%<br />
Sri Lanka<br />
South Korea<br />
United Kingdom<br />
Pakistan<br />
China<br />
Germany<br />
Mexico<br />
Figure 4b<br />
Decline in Offshore <strong>Visa</strong>s<br />
Selected Countries by Citizenship<br />
Philippines<br />
Viet Nam<br />
Total<br />
USA<br />
Italy<br />
Canada<br />
Poland<br />
Switzerland<br />
Japan<br />
-5%<br />
Brazil<br />
Taiwan<br />
Sweden<br />
Indonesia<br />
Slovakia<br />
Singapore<br />
Hong Kong<br />
Czech Republic<br />
Colombia<br />
-10%<br />
-15%<br />
-20%<br />
-25%<br />
-30%<br />
-35%<br />
<strong>IDP</strong> <strong>Education</strong> Australia <strong>Visa</strong> Report <strong>–</strong> <strong>An</strong>nual 2003 9
2.0 Offshore Higher <strong>Education</strong> <strong>Visa</strong>s<br />
2.1 Total Number of Offshore Higher <strong>Education</strong> <strong>Visa</strong>s<br />
• The number of Higher <strong>Education</strong> visas issued over the period January to December<br />
2003, increased by 13% relative to the same period in the previous year. However,<br />
since many Study Abroad and Higher <strong>Education</strong> Exchange students now receive<br />
‘Non-award/Foundation Studies’ visas instead of Higher <strong>Education</strong> visas, the growth<br />
in the number of students receiving a visa for higher education award courses is<br />
likely to be underestimated.<br />
Figure 5<br />
Total and Higher <strong>Education</strong><br />
<strong>Visa</strong>s issued Offshore<br />
120000<br />
100000<br />
80000<br />
60000<br />
All other sectors<br />
Higher <strong>Education</strong><br />
46,977<br />
53,778<br />
40000<br />
20000<br />
50,290<br />
56,726<br />
0<br />
2002 2003<br />
• Despite a growth rate of 13%, the number of Higher <strong>Education</strong> visas as a proportion<br />
of the total number of student visas issued was 1 percentage points lower in the<br />
period January to December 2003, compared with the same period in 2002. This can<br />
be largely attributed to the changes to DIMIA’s classification system detailed above.<br />
Table 3<br />
<strong>Visa</strong>s Issued Offshore<br />
Total and Higher <strong>Education</strong><br />
2002 2003<br />
Higher <strong>Education</strong> 50,290 56,726<br />
Total 97,267 110,504<br />
% Higher <strong>Education</strong> 52% 51%<br />
<strong>IDP</strong> <strong>Education</strong> Australia <strong>Visa</strong> Report <strong>–</strong> <strong>An</strong>nual 2003 10
2.2 Offshore Higher <strong>Education</strong> <strong>Visa</strong>s by Citizenship<br />
• The largest source countries were China, India, Malaysia and USA.<br />
• Since 2002, significant increases have occurred in India (132%), South Korea<br />
(106%), Sri Lanka (70%) and China (67%).<br />
• In 2003, the number of Higher <strong>Education</strong> visas issued to citizens of the United<br />
States, Germany, the United Kingdom, Sweden, Canada and Norway has been<br />
influenced by changes to DIMIA’s classification of Study Abroad and Higher<br />
<strong>Education</strong> Exchange students. While in the past such students were counted as<br />
‘Higher <strong>Education</strong>’ students, they are now in the ‘Non-award/Foundation Studies’<br />
category. The effect of these changes will be to artificially decrease the number of<br />
Higher <strong>Education</strong> visas awarded in the source countries listed above. Therefore, a<br />
more accurate portrayal of growth rates by citizenship may be obtained by including<br />
the number of Non-Award/Foundation Studies visas (See Table 5).<br />
• Nevertheless, declines in Higher <strong>Education</strong> visas were observed for citizens of Kenya<br />
(-28%) and Zimbabwe (-22%) as well as Taiwan (-17%) and Singapore (-10%).<br />
Figure 6<br />
Higher <strong>Education</strong> <strong>Visa</strong>s Issued<br />
Offshore By Citizenship<br />
12000<br />
10000<br />
8000<br />
6000<br />
4000<br />
2000<br />
0<br />
China<br />
India<br />
2002 2003<br />
Malaysia<br />
USA<br />
Indonesia<br />
Singapore<br />
Hong Kong<br />
Thailand<br />
Norway<br />
Canada<br />
Bangladesh<br />
South Korea<br />
Sweden<br />
United Kingdom<br />
The apparent decline in students from<br />
the US, Norway, Sweden and Germany<br />
may be attributed to changes in the way<br />
DIMIA classifies Study Abroad/ HE<br />
Exchange students.<br />
Germany<br />
Sri Lanka<br />
Taiwan<br />
Japan<br />
Viet Nam<br />
Pakistan<br />
<strong>IDP</strong> <strong>Education</strong> Australia <strong>Visa</strong> Report <strong>–</strong> <strong>An</strong>nual 2003 11
Table 4<br />
Higher <strong>Education</strong> <strong>Visa</strong>s Issued<br />
Offshore by Citizenship<br />
Top 30 Countries<br />
Country Name 2002 2003 % Change<br />
China 6,591 11,018 67%<br />
India 3,198 7,406 132%<br />
Malaysia 5,676 6,048 7%<br />
USA 8,114 4,791 -41%<br />
Indonesia 4,199 4,030 -4%<br />
Singapore 3,696 3,335 -10%<br />
Hong Kong 2,467 2,333 -5%<br />
Thailand 1,408 1,598 13%<br />
Norway 1,494 1,422 -5%<br />
Canada 1,249 1,291 3%<br />
Bangladesh 805 1,276 59%<br />
South Korea 509 1,051 106%<br />
Sweden 1,143 827 -28%<br />
United Kingdom 683 793 16%<br />
Germany 1,041 769 -26%<br />
Sri Lanka 444 757 70%<br />
Taiwan 853 712 -17%<br />
Japan 489 613 25%<br />
Viet Nam 394 552 40%<br />
Pakistan 328 499 52%<br />
Zimbabwe 375 296 -21%<br />
Colombia 306 280 -8%<br />
Kenya 383 274 -28%<br />
France 200 271 36%<br />
Mauritius 275 232 -16%<br />
Botswana 201 206 2%<br />
Oman 162 206 27%<br />
Zambia 141 201 43%<br />
Netherlands 193 189 -2%<br />
Iran, Islamic Republic of 96 178 85%<br />
Total 50,290 56,726 13%<br />
<strong>IDP</strong> <strong>Education</strong> Australia <strong>Visa</strong> Report <strong>–</strong> <strong>An</strong>nual 2003 12
Table 5<br />
Higher <strong>Education</strong> and Non-award/Foundation Studies <strong>Visa</strong>s Issued<br />
Offshore by Citizenship<br />
Top 30 Countries<br />
Country Name 2002 2003 % Change<br />
China 6,660 11,071 66%<br />
USA 8,703 9,540 10%<br />
India 3,208 7,418 131%<br />
Malaysia 6,291 6,565 4%<br />
Indonesia 4,231 4,043 -4%<br />
Singapore 3,972 3,606 -9%<br />
Hong Kong 3,104 2,863 -8%<br />
Germany 1,274 1,864 46%<br />
Thailand 1,455 1,705 17%<br />
Norway 1,577 1,569 -1%<br />
Canada 1,399 1,532 10%<br />
Bangladesh 809 1,277 58%<br />
South Korea 641 1,214 89%<br />
Sweden 1,285 1,167 -9%<br />
United Kingdom 791 1,127 42%<br />
Japan 886 954 8%<br />
Taiwan 904 771 -15%<br />
Sri Lanka 448 764 71%<br />
France 547 562 3%<br />
Viet Nam 396 555 40%<br />
Pakistan 331 504 52%<br />
Mexico 295 382 29%<br />
Zimbabwe 379 299 -21%<br />
Colombia 327 289 -12%<br />
Kenya 389 284 -27%<br />
Netherlands 207 247 19%<br />
Mauritius 280 232 -17%<br />
Denmark 271 227 -16%<br />
Oman 173 212 23%<br />
Botswana 205 206 0%<br />
Total 54,904 66,971 22%<br />
<strong>IDP</strong> <strong>Education</strong> Australia <strong>Visa</strong> Report <strong>–</strong> <strong>An</strong>nual 2003 13
3.0 Offshore Schools <strong>Visa</strong>s<br />
3.1 Total Number of Offshore School <strong>Visa</strong>s<br />
• The number of school visas issued in January-December 2003 increased by 10% in<br />
compared with the same period in the previous year. This is less than the total<br />
growth in student visas, which was 14%.<br />
Figure 7<br />
Total and Schools<br />
<strong>Visa</strong>s issued offshore<br />
120000<br />
100000<br />
All other sectors<br />
School<br />
80000<br />
60000<br />
40000<br />
87,648<br />
99,954<br />
20000<br />
0<br />
9,619 10,550<br />
2002 2003<br />
• The number of student visas issued for the school sector as a percentage of the total<br />
remained constant during Jan-Dec 2003, compared to the same period in 2002.<br />
Table 6<br />
<strong>Visa</strong>s Issued Offshore<br />
Total and School Sector<br />
2002 2003<br />
Schools 9,619 10,550<br />
Total 97,267 110,504<br />
% Schools 10% 10%<br />
3.2 Offshore School Sector <strong>Visa</strong>s by Citizenship<br />
• In 2003 (Jan-Dec), Chinese students accounted for 53% of all school visas.<br />
• The largest increases in visas issued amongst the top 20 countries occurred in<br />
South Korea (601 or 132%), China (207 or 4%) and USA (184 or 151%).<br />
• Significant declines occurred for Hong Kong (111 or 13%), Malaysia (69 or 17%),<br />
Indonesia (56 or 15%) and Singapore (39 or 22%).<br />
<strong>IDP</strong> <strong>Education</strong> Australia <strong>Visa</strong> Report <strong>–</strong> <strong>An</strong>nual 2003 14
Figure 8<br />
School <strong>Visa</strong>s Issued<br />
Offshore by Citizenship<br />
6000<br />
5000<br />
4000<br />
2002 2003<br />
3000<br />
2000<br />
1000<br />
0<br />
China<br />
South Korea<br />
Hong Kong<br />
Japan<br />
Malaysia<br />
Germany<br />
Indonesia<br />
USA<br />
Thailand<br />
Viet Nam<br />
Taiwan<br />
Singapore<br />
United Kingdom<br />
Papua New Guinea<br />
Canada<br />
Table 7<br />
School Sector <strong>Visa</strong>s Issued<br />
Offshore by Citizenship<br />
Top 20 Countries<br />
2002 2003 % Growth<br />
China 5,425 5,632 4%<br />
South Korea 457 1,058 132%<br />
Hong Kong 867 756 -13%<br />
Japan 502 587 17%<br />
Malaysia 401 332 -17%<br />
Germany 268 311 16%<br />
Indonesia 364 308 -15%<br />
USA 122 306 151%<br />
Thailand 250 283 13%<br />
Viet Nam 159 193 21%<br />
Taiwan 146 149 2%<br />
Singapore 174 135 -22%<br />
United Kingdom 58 63 9%<br />
Papua New Guinea 53 46 -13%<br />
Canada 26 30 15%<br />
Switzerland 5 25 400%<br />
Sweden 15 21 40%<br />
France 17 19 12%<br />
Portugal 25 16 -36%<br />
Macau 24 15 -38%<br />
Total 9,619 10,550 10%<br />
<strong>IDP</strong> <strong>Education</strong> Australia <strong>Visa</strong> Report <strong>–</strong> <strong>An</strong>nual 2003 15
4.0 Offshore Independent ELICOS<br />
4.1 Total Number of Offshore Independent ELICOS <strong>Visa</strong>s<br />
• While the total number of student visas issued increased 14% from Jan-Dec 2002 to<br />
Jan-Dec 2003, the ELICOS sector experienced an increase of 7%.<br />
Figure 9<br />
Total and ELICOS Sector<br />
<strong>Visa</strong>s issued offshore<br />
120000<br />
100000<br />
All other sectors<br />
Independent ELICOS<br />
80000<br />
60000<br />
40000<br />
80,990<br />
93,072<br />
20000<br />
0<br />
16,277 17,432<br />
2002 2003<br />
• The number of ELICOS visas issued as a proportion of the total for the 2003 (Jan-<br />
Dec) decreased by 1 percentage points from 2002.<br />
Table 8<br />
Total and ELICOS Sector<br />
<strong>Visa</strong>s Issued Offshore<br />
2002 2003<br />
ELICOS 16,277 17,432<br />
Total 97,267 110,504<br />
% ELICOS 17% 16%<br />
4.2 Offshore Independent ELICOS <strong>Visa</strong>s by Citizenship<br />
• Most visas for Independent ELICOS sector were issued to citizens of South Korea,<br />
Japan, Thailand, Taiwan and Brazil.<br />
• The largest increases in visas issued occurred for citizens of South Korea (1666 or<br />
47%), Japan (228 or 6%) and Indonesia (91 or 222%).<br />
• The largest declines in visas issued occurred with citizens of Brazil (331 or 23%),<br />
Thailand (225 or 9%), Colombia (160 or 57%) and Taiwan (141 or 10%).<br />
• The top two source countries - South Korea and Japan - accounted for 53% of all<br />
student visas issued in the ELICOS sector.<br />
<strong>IDP</strong> <strong>Education</strong> Australia <strong>Visa</strong> Report <strong>–</strong> <strong>An</strong>nual 2003 16
• It should also be noted that the majority of English language students are issued with<br />
tourist visas and are therefore not captured in these statistics.<br />
6000<br />
Figure 10<br />
ELICOS <strong>Visa</strong>s Issued<br />
By Citizenship<br />
Top 20 Countries<br />
5000<br />
4000<br />
2002 2003<br />
3000<br />
2000<br />
1000<br />
0<br />
South Korea<br />
Japan<br />
Thailand<br />
Taiwan<br />
Brazil<br />
Switzerland<br />
France<br />
Hong Kong<br />
Poland<br />
Spain<br />
Italy<br />
Germany<br />
Indonesia<br />
Hungary<br />
Turkey<br />
Colombia<br />
Czech Republic<br />
Mexico<br />
Belgium<br />
Saudi Arabia<br />
<strong>IDP</strong> <strong>Education</strong> Australia <strong>Visa</strong> Report <strong>–</strong> <strong>An</strong>nual 2003 17
Table 9<br />
ELICOS <strong>Visa</strong>s Issued<br />
Offshore By Citizenship<br />
2002 2003 % Growth<br />
South Korea 3,580 5,246 47%<br />
Japan 3,713 3,941 6%<br />
Thailand 2,546 2,321 -9%<br />
Taiwan 1,361 1,220 -10%<br />
Brazil 1,432 1,101 -23%<br />
Switzerland 568 610 7%<br />
France 451 439 -3%<br />
Hong Kong 399 355 -11%<br />
Poland 310 292 -6%<br />
Spain 154 204 32%<br />
Italy 119 141 18%<br />
Germany 122 133 9%<br />
Indonesia 41 132 222%<br />
Hungary 164 131 -20%<br />
Turkey 133 125 -6%<br />
Colombia 281 121 -57%<br />
Czech Republic 131 95 -27%<br />
Mexico 88 94 7%<br />
Belgium 58 62 7%<br />
Saudi Arabia 26 61 135%<br />
USA 18 55 206%<br />
Malaysia 31 43 39%<br />
Slovakia 60 40 -33%<br />
Chile 22 37 68%<br />
Oman 7 36 414%<br />
Russian Federation 45 35 -22%<br />
China 48 34 -29%<br />
Sweden 21 31 48%<br />
Viet Nam 32 21 -34%<br />
Austria 26 18 -31%<br />
Total 16,277 17,432 7%<br />
<strong>IDP</strong> <strong>Education</strong> Australia <strong>Visa</strong> Report <strong>–</strong> <strong>An</strong>nual 2003 18
5.0 Offshore Vocational <strong>Education</strong> and Training (VET)<br />
5.1 Total Number of Offshore VET <strong>Visa</strong>s<br />
• Although the total number of student visas issued increased 14% in the January to<br />
December period compared with the previous year, the number of student visas<br />
issued in the VET sector decreased by 4%.<br />
Figure 11<br />
Total and VET sector<br />
<strong>Visa</strong>s issued offshore<br />
120000<br />
100000<br />
All other sectors<br />
Vocational <strong>Education</strong><br />
80000<br />
60000<br />
40000<br />
85,652<br />
99,335<br />
20000<br />
0<br />
11,615 11,169<br />
2002 2003<br />
• The proportion of all offshore student visas issued to the VET sector for the period<br />
January to December, 2003 decreased by 2 percentage point from the previous<br />
year.<br />
Table 10<br />
Total and VET Sector<br />
<strong>Visa</strong>s Issued Offshore<br />
2002 2003<br />
VET 11,615 11,169<br />
Total 97,267 110,504<br />
% VET 12% 10%<br />
5.2 Offshore VET Sector <strong>Visa</strong>s Issued by Citizenship<br />
• The largest increases in VET sector visas occurred in the Bangladesh (360 or 145%),<br />
the United Kingdom (222 or 91%), Brazil (86 or 66%), and Thailand (75 or 8%).<br />
• The top five countries accounted for 43% of all VET sector visas issued.<br />
• Of the top 20 countries, declines in student visas issued occurred to citizens of Hong<br />
Kong (580 or 24%), Taiwan (290 or 55%), Czech Republic (203 or 22%), South<br />
Korea (132 or 42%) and Japan (117 or 16%).<br />
<strong>IDP</strong> <strong>Education</strong> Australia <strong>Visa</strong> Report <strong>–</strong> <strong>An</strong>nual 2003 19
Figure 12<br />
VET <strong>Visa</strong>s Issued<br />
Offshore By Citizenship<br />
3,000<br />
2,500<br />
2,000<br />
1,500<br />
1,000<br />
500<br />
0<br />
Hong Kong<br />
Thailand<br />
Czech Republic<br />
2002 2003<br />
Japan<br />
Bangladesh<br />
Slovakia<br />
Malaysia<br />
United Kingdom<br />
USA<br />
China<br />
Table 11<br />
VET Sector <strong>Visa</strong>s Issued<br />
Offshore by Citizenship<br />
Top 20 Countries<br />
Poland<br />
Taiwan<br />
Brazil<br />
Canada<br />
South Korea<br />
Mauritius<br />
India<br />
Sweden<br />
Indonesia<br />
Sri Lanka<br />
2002 2003 % Growth<br />
Hong Kong 2,384 1,804 -24%<br />
Thailand 911 986 8%<br />
Czech Republic 941 738 -22%<br />
Japan 749 632 -16%<br />
Bangladesh 248 608 145%<br />
Slovakia 658 585 -11%<br />
Malaysia 639 560 -12%<br />
United Kingdom 243 465 91%<br />
USA 443 453 2%<br />
China 337 368 9%<br />
Poland 323 359 11%<br />
Taiwan 529 239 -55%<br />
Brazil 131 217 66%<br />
Canada 209 215 3%<br />
South Korea 312 180 -42%<br />
Mauritius 158 172 9%<br />
India 182 159 -13%<br />
Sweden 136 149 10%<br />
Indonesia 174 148 -15%<br />
Sri Lanka 128 145 13%<br />
Total 11,615 11,169 -4%<br />
<strong>IDP</strong> <strong>Education</strong> Australia <strong>Visa</strong> Report <strong>–</strong> <strong>An</strong>nual 2003 20
6.0 Offshore E-visas<br />
• The offshore e-visa statistics below are included in the preceding analysis of visa<br />
numbers. The following analysis is designed to provide an insight into the use of this<br />
new visa-issuing method by students that are offshore.<br />
• From July 2002, the number of countries and visa classes, that e-visas could be<br />
issued for, was expanded. Previously to this time, e-visas had only been issued for<br />
higher education, to citizens of the USA, Sweden and Norway.<br />
6.1 Total Number of Offshore E-<strong>Visa</strong>s<br />
• The total number of offshore e-<strong>Visa</strong>s issued for all classes in 2003 was 32,921.<br />
• 48% of all offshore e-visas were issued in the Higher <strong>Education</strong> class.<br />
Table 12<br />
All Offshore E-visas issued<br />
By Class<br />
<strong>Visa</strong> Category 2002 2003<br />
Higher <strong>Education</strong> 10,040 18,081<br />
Independent ELICOS 245 4,733<br />
Non_award foundation studies/other 942 6,862<br />
School 108 470<br />
Secondary Exchange 8 25<br />
Vocational <strong>Education</strong> 1,217 2,752<br />
Total 12,560 32,923<br />
6.2 E-visa Issued by Citizenship<br />
• In 2003, 58% of all offshore e-visas were issued to citizens of the USA, Malaysia and<br />
Japan.<br />
Table 13<br />
All Offshore E-<strong>Visa</strong>s Issued by Citizenship<br />
Top 12 Countries for E-visas<br />
Country 2002 2003<br />
USA 7,396 9,024<br />
Malaysia 385 5,259<br />
Japan 244 4,766<br />
Hong Kong 1,560 3,494<br />
Singapore 399 2,723<br />
Norway 1,115 1,524<br />
Sweden 923 1,306<br />
Canada 243 1,105<br />
Germany 40 1,097<br />
Switzerland 103 651<br />
Total 12,560 32,923<br />
<strong>IDP</strong> <strong>Education</strong> Australia <strong>Visa</strong> Report <strong>–</strong> <strong>An</strong>nual 2003 21
7.0 Onshore <strong>Visa</strong>s<br />
• The following analysis of onshore visas issued includes visas that were issued to a<br />
recipient who was resident in Australia at the time of application.<br />
• The analysis includes e-visas to students issued onshore in Australia.<br />
• The onshore visa numbers do not include Permission to Work or Change of Provider<br />
visas.<br />
7.1 Total Number of Onshore <strong>Visa</strong>s<br />
• The total number of onshore student visas issued between January and December<br />
2003 was 51,387. This represents an increase of 5%<br />
• Higher education accounted for 59% of all onshore student visas<br />
Table 14<br />
All Onshore visas issued by <strong>Visa</strong> Class<br />
<strong>Visa</strong> Category 2002 2003<br />
%<br />
Growth<br />
Higher <strong>Education</strong> 27,930 30,397 9%<br />
Vocational <strong>Education</strong> 12,849 12,482 -3%<br />
Independent ELICOS 4,266 4,792 12%<br />
School 2,375 2,442 3%<br />
Non_award foundation studies/other 868 872 0%<br />
AusAID 357 337 -6%<br />
Secondary Exchange 31 54 74%<br />
Defence 38 11 -71%<br />
Total 48,711 51,387 5%<br />
7.2 Onshore <strong>Visa</strong>s Issued by Citizenship<br />
• The top five citizenships for onshore visas were China, Japan, South Korea, Hong<br />
Kong and Thailand. These citizenships accounted for 54% of all onshore visas.<br />
• Large increases in onshore visas issued occurred in China (1,213 or 16%), South<br />
Korea (962 or 26%), Hong Kong (916 or 25%), Japan (744 or 15%) and Taiwan (352<br />
or 14%).<br />
• Among the top 30 countries significant decreases occurred in Indonesia (798 or<br />
19%), India (565 or 28%), United Kingdom (352 or 40%), Brazil (262 or 22%) and<br />
Pakistan (128 or 33%).<br />
<strong>IDP</strong> <strong>Education</strong> Australia <strong>Visa</strong> Report <strong>–</strong> <strong>An</strong>nual 2003 22
Table 15<br />
All Onshore visas issued by Citizenship<br />
Top 30 Countries<br />
Citizenship 2002 2003 % Growth<br />
China 7,619 8,832 16%<br />
Japan 5,124 5,868 15%<br />
South Korea 3,648 4,610 26%<br />
Hong Kong 3,643 4,559 25%<br />
Thailand 3,699 3,701 0%<br />
Indonesia 4,228 3,430 -19%<br />
Taiwan 2,449 2,801 14%<br />
Malaysia 1,841 2,135 16%<br />
India 2,036 1,471 -28%<br />
Singapore 1,111 1,072 -4%<br />
Brazil 1,186 924 -22%<br />
Viet Nam 828 751 -9%<br />
Bangladesh 737 736 0%<br />
USA 746 705 -5%<br />
Sri Lanka 748 644 -14%<br />
Norway 535 608 14%<br />
United Kingdom 886 534 -40%<br />
Germany 371 466 26%<br />
Colombia 526 450 -14%<br />
Sweden 315 447 42%<br />
Poland 304 424 39%<br />
Czech Republic 385 411 7%<br />
France 315 396 26%<br />
Slovakia 358 377 5%<br />
Canada 239 324 36%<br />
Nepal 381 288 -24%<br />
Kenya 274 258 -6%<br />
Pakistan 385 257 -33%<br />
Italy 205 214 4%<br />
Mauritius 164 208 27%<br />
Total 48,711 51,387 5%<br />
<strong>IDP</strong> <strong>Education</strong> Australia <strong>Visa</strong> Report <strong>–</strong> <strong>An</strong>nual 2003 23