Download as a PDF - CiteSeerX
Download as a PDF - CiteSeerX
Download as a PDF - CiteSeerX

You also want an ePaper? Increase the reach of your titles
YUMPU automatically turns print PDFs into web optimized ePapers that Google loves.
International<br />
Water Association<br />
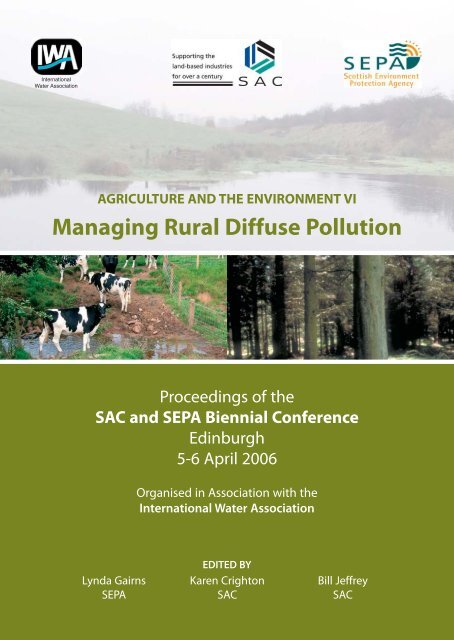
AGRICULTURE AND THE ENVIRONMENT VI<br />
Managing Rural Diffuse Pollution<br />
Proceedings of the<br />
SAC and SEPA Biennial Conference<br />
Edinburgh<br />
5-6 April 2006<br />
Organised in Association with the<br />
International Water Association<br />
EDITED BY<br />
Lynda Gairns Karen Crighton Bill Jeffrey<br />
SEPA SAC SAC
Agriculture and the Environment VI<br />
Managing Rural Diffuse Pollution<br />
Proceedings of the SAC and SEPA<br />
Biennial Conference<br />
Organised in Association with the<br />
International Water Association<br />
held in<br />
William Robertson Building<br />
George Square<br />
Edinburgh University<br />
Edinburgh<br />
5-6 April 2006<br />
Edited by<br />
Lynda Gairns<br />
SEPA, Heriot Watt Research Park, Edinburgh, EH14 4AP, UK<br />
Karen Crighton<br />
SAC, Auchincruive, Ayr KA6 5HW, UK<br />
Bill Jeffrey<br />
SAC, Bush Estate, Penicuik, Midlothian EH26 0PH, UK<br />
i
2006 Conference Organising Committee:<br />
Mark Aitken, SEPA Stirling<br />
Jean Atkinson, SEPA Stirling<br />
Louise Bailey, SEPA Stirling<br />
Karen Crighton, SAC Ayr<br />
Brian D’Arcy, SEPA Perth<br />
Janette Elder, SAC Edinburgh<br />
Lynda Gairns, SEPA Edinburgh<br />
Bill Jeffrey, SAC Edinburgh<br />
Allan McBride, SAC Edinburgh<br />
Jannette Macdonald, SEPA Stirling<br />
Davy McCracken, SAC Ayr<br />
Anne McCrae, Edinburgh First<br />
Dave Merrilees, SAC Ayr<br />
Rob Morris, SEPA Stirling<br />
Kate Newall Hogarth, SEPA Stirling<br />
Alex Sinclair, SAC Aberdeen<br />
Allan Virtue, SEPA Gal<strong>as</strong>hiels<br />
International Advisory Group:<br />
Paul Reiter, UK, Executive Director, IWA<br />
Ralph Heath, South Africa, Chairman, IWA Diffuse Pollution Specialist Group<br />
Vladimir Novotny, USA, Founder Chair, IWA Diffuse Pollution Specialist Group<br />
Dov Weitman, USA, Chief, NPS Branch, Office of Water, US EPA<br />
Barry Evans, USA, IWA Diffuse Pollution Group<br />
Chengqing Yin, China, IWA Diffuse Pollution Group<br />
ii
Contents<br />
Foreward<br />
JC Gemmell, SEPA<br />
Theme 1: Total Maximum Daily Loads (TMDLs):<br />
A Means of Managing Diffuse Pollution?<br />
Chaired by C Spray, SEPA<br />
Agricultural Diffuse Pollution: Are we on the<br />
Right Track to Successful Abatement? 3<br />
V Novotny<br />
Matching Water Framework Directive Controls<br />
with Diffuse Pollution Challenges in Scotland 13<br />
RC Morris, J MacDonald, SM Greig and C Preston<br />
Total Maximum Daily Loads: the USEPA Approach to<br />
Managing Faecal Indicator Fluxes to Receiving Waters:<br />
Lessons for UK Environmental Regulation? 23<br />
D Kay, C Stapleton, M Wyer, A McDonald and J Crowther<br />
Decre<strong>as</strong>ing the Nitrogen Soil Surface Surplus in the<br />
Danube River B<strong>as</strong>in by Applying Agricultural Me<strong>as</strong>ures:<br />
A Comparison of Cost Effectiveness Ratios 34<br />
L Fröschl, R Pierrard and W Schönbäck<br />
High Resolution Phosphorus Transfers in Rural Catchments:<br />
The Hidden Importance of Rural Point Sources 41<br />
P Jordan, J Arnscheidt, S McCormick and C Ward<br />
An Initial Assessment of the Suitability of Total Maximum<br />
Daily Loads (TMDLs) <strong>as</strong> a Means of Managing Diffuse<br />
Pollution Under the Water Framework Directive 45<br />
RJ Cooper, RC Ferrier, RD Harmel, SJ Langan, AJA Vinten and MI Stutter<br />
iii
Theme 2: Cost-effectiveness of Best Management<br />
Practices (BMPs)?<br />
Chaired R Heath, Pulles Howard & de Lange (Inc), South Africa<br />
A Statewide Approach to Identifying,<br />
Quantifying and Mitigating Diffuse<br />
Pollution-Related Problems 53<br />
BM Evans<br />
The Use of Ponds to Reduce Pollution from<br />
Potentially Contaminated Steading Run-off 62<br />
KV Heal, AJA Vinten, F Gouriveau, J Zhang, M Windsor, B D’Arcy, A Frost,<br />
L Gairns and SJ Langan<br />
Cost-effective Programmes of Me<strong>as</strong>ures: Theory Versus Reality 71<br />
S Blacklocke, A Hooper, M Rosenberg and R Earle<br />
Assessing the Cost-effectiveness of Integrated<br />
Me<strong>as</strong>ures to Decre<strong>as</strong>e Loss of Nitrate, Phosphorus<br />
and Faecal Indicator Organisms 77<br />
M Shepherd, S Anthony, P Haygarth, D Harris, P Newell-Price, S Cuttle,<br />
B Chambers and D Chadwick<br />
Economic Implications of Minimising Diffuse Nitrogen<br />
Pollution from Livestock Manures 84<br />
BJ Chambers, JR Williams, E Sagoo, KA Smith and DR Chadwick<br />
A Me<strong>as</strong>ure-centric Approach to Diffuse Pollution<br />
Modelling and Cost-curve Analysis of Mitigation Me<strong>as</strong>ures 93<br />
DR Chadwick, BJ Chambers, S Anthony, S Grainger, P Haygarth,<br />
D Harris and K Smith<br />
Theme 3: How Should BMPs be Targeted and Prioritised Within<br />
a Catchment?<br />
Chaired by G Lawrie, NFUS<br />
Assessing the Significance of Diffuse Pollution<br />
Risks in Order to Target and Prioritise Best Management Practices 100<br />
AH Sinclair, A Frost, A Vinten, P Chapman and J MacDonald<br />
Retention of Pollutants by the Sink Structures in Catchments -<br />
Studies to Reduce Diffuse Pollution in China’s Rural Are<strong>as</strong> 111<br />
C Yin, X Wang and B Shan<br />
iv
Catchment Characterisation and Targeting of<br />
Best Management Practices using PSYCHIC 121<br />
PJA Withers, EI Lord, J Strömqvist and PS Davison<br />
A Risk Assessment and Mitigation Strategy to<br />
Minimise Livestock Pollution to Surface Waters 128<br />
DW Merrilees, JW Dickson, WA Jeffrey and D Kay<br />
Environment Sensitive Farming -<br />
Practical Advice for Land Managers 137<br />
AD Carter, S Groves, R Bailey and J MacLeod<br />
Managing Diffuse Pollution from a Forestry Perspective 144<br />
HM McKay and TR Nisbet<br />
The Use of Fish to Determine Impacts of<br />
Diffuse Pollution on Rivers and Human Health 153<br />
RGM Heath, HH du Preez and B Genthe<br />
Theme 4: How Can Land Users be Persuaded to Adopt BMPs?<br />
Chaired by Prof WAC McKelvey, SAC<br />
Delivering Environmental Benefits Through<br />
Land Management Contracts 163<br />
I Clayden<br />
Carrots, Sticks, Sermons or Hugs?<br />
Designing Co-ordinated Policy Me<strong>as</strong>ures for the<br />
Uptake of Environmental Management Options 165<br />
B Davies<br />
Agriculture Policy Reform:<br />
Opportunities to Reduce Diffuse Pollution 173<br />
C Davies, M Gloyer and A Johnstonova<br />
Farmer Uptake of Nutrient Management Best Practice 179<br />
G Goodl<strong>as</strong>s<br />
A C<strong>as</strong>e Study: Adoption of Best Management Practice in Brittany (France)<br />
Using Economic Instruments and Regulation 186<br />
P Newell Price and M-L Daumer<br />
Regulatory Options for the Management of Rural Diffuse Pollution 192<br />
BJ D’Arcy, K Schmulian and R Wade<br />
v
Poster Presentations<br />
The Farm Soils Plan 201<br />
R Audsley<br />
Phosphorus Storage in Fine Channel Bed Sediments 202<br />
DJ Ballantine, DE Walling, AL Collins and GJL Leeks<br />
Red, Amber and Green for the PEPFAA Code 203<br />
C Christian, R Audsley and AH Sinclair<br />
Estimating Diffuse Phosphorus Loads to Lakes:<br />
Implications for the Calculation of Total Maximum Daily Loads 205<br />
LH Defew<br />
Sediment Loads and Sources in the Bush Catchment:<br />
A Move Towards Informed Management Strategies 207<br />
D Evans and C Gibson<br />
Lound Catchment Project: Working with Stakeholders<br />
to Deliver Benefits for Water and Wildlife 208<br />
HG Gray and C Lorenc<br />
Minimising the Pressures and Impacts on Freshwater<br />
from Agriculture in the Upper Ballinderry River SAC 210<br />
M Horton and A McGarel<br />
A Framework for Valuing the Health Benefits of<br />
Improved Bathing Water Quality in the River Irvine Catchment 211<br />
EK Johnson, D Moran and AJA Vinten<br />
Determination of the Veterinary Antibiotics Pollution<br />
in Soil from Agricultural Sources 218<br />
M Kaštelan-Macan, S Babic, D Ašperger, D Mutavdžic and AJM Horvat<br />
Opportunities and Constraints for Using Best Management Practices:<br />
Some Lessons from the Tarland Catchment Initiative 224<br />
S Langan<br />
Can We Improve Prediction of P Concentration in<br />
Lunan Lochs by Changing the Plus Model? 231<br />
I Papadopoulou, A Vinten and J DeGroote<br />
Tackling Diffuse Nitrate Pollution:<br />
Swapping Eutrophication for Climate Change? 238<br />
D Reay<br />
Catchment Sensitive Farming on the Hampshire Avon 239<br />
MC Robson, R Curtis, J Swain and C Routh<br />
vi
Ammonia Volatilisation from Cattle Slurry Applied<br />
to Gr<strong>as</strong>sland: Effects of Application Technique and Rate 240<br />
E Sagoo, JR Williams, BJ Chambers, J Lapworth and TH Misselbrook<br />
Field Testing of Mitigation Options for<br />
Phosphorus and Sediment (MOPS) 244<br />
CJ Stevens and JN Quinton<br />
Nitrate Contamination of Groundwater from Agriculture<br />
in Canterbury, New Zealand: Me<strong>as</strong>urement and Management<br />
of a Hidden Problem 248<br />
KJW Taylor<br />
Rapid Incorporation of Solid Manure <strong>as</strong> a Best Management Practice? 249<br />
RE Thorman, J Webb and S Yamulki<br />
Methods to Improve Pollution Control Potential of Woodchip Corrals 253<br />
AJA Vinten, D Merrilees, G Sym, J Parker and C Crawford<br />
Farmers’ Responses to Water Quality Problems in the Leet Catchment 259<br />
PE Widdison, TP Burt, DNM Donoghue and R Hudson<br />
Nitrogen Losses After Cattle Slurry Applications to a Drained Clay Soil 267<br />
JR Williams, E Sagoo, BJ Chambers, RB Cross, J Short and RA Hodgkinson<br />
Soil and Crop Management Effects on Sediment and Phosphorus<br />
Concentrations in Run-off from Agricultural Land 272<br />
PJA Withers, RA Hodgkinson and A Bates<br />
vii
viii
Foreword<br />
It is my ple<strong>as</strong>ure <strong>as</strong> Chief Executive of the Scottish Environment Protection Agency<br />
(SEPA) to extend a warm welcome to this conference on behalf of the Scottish<br />
Agricultural College (SAC) and SEPA.<br />
As I am sure you are aware, this conference h<strong>as</strong> been actively promoted by the<br />
International Water Association (IWA). We are very grateful to the IWA for this<br />
support and recognition, <strong>as</strong> we continue in our search for answers to the many<br />
and varied questions about the pressures on the water environment nationally and<br />
internationally, now and in the future.<br />
This is the 6th SAC-SEPA conference in Edinburgh and comes when SEPA itself<br />
is celebrating its 10th year of operation. The previous conference w<strong>as</strong> in SAC’s<br />
Centenary Celebration Year in 2004. SEPA is a considerably younger organisation, so<br />
2006 is a significant milestone in our history. It is a year in which we will be publishing<br />
a major State of Scotland’s Environment report and engaging with people in all walks<br />
of life to address the single biggest environmental threat - climate change. This<br />
conference brings together a very important audience for this message, one which<br />
can use its knowledge and influence to lead positive action. Climate change will<br />
incre<strong>as</strong>ingly govern the conditions under which land use is sustained and will have<br />
to be a major part of future thinking and future conferences. In Scotland, <strong>as</strong> in other<br />
parts of the UK, we talk a lot about the weather. This is perhaps no bad thing and<br />
will equip us well for the future challenges!<br />
It h<strong>as</strong> been eleven years since the first SAC-SEPA conference. The conference<br />
proceedings published to date have included over 220 papers from around 560<br />
authors. This enormous output h<strong>as</strong> come from the research community, consultants,<br />
regulators, industry representatives, non-governmental organisations, local authorities<br />
and government representatives from the UK and abroad. The shared knowledge<br />
and experience generated by all of these contributions h<strong>as</strong> helped us make huge<br />
strides forward in dealing with diffuse pollution. Understanding the issues <strong>as</strong> well <strong>as</strong><br />
the solutions is a pre-requisite for effective, well targeted management action.<br />
This conference looks at the management of rural sources of diffuse pollution. Here<br />
in Scotland there is already a great deal of work underway, principally under the<br />
banner of Water Framework Directive, and we will be hearing about some of these<br />
actions and initiatives.<br />
All of this is happening at a time when a number of other EU Directives are being<br />
implemented, on the control of agricultural w<strong>as</strong>te, the pollution of water by<br />
agricultural nitrates, bathing water quality, groundwater protection, sewage sludge<br />
use and the operation of large scale pig and poultry installations. On top of this,<br />
Common Agricultural Policy (CAP) reform is just over a year old, a revised EU Rural<br />
Development Regulation h<strong>as</strong> just been agreed and the key regulatory <strong>as</strong>pects of the<br />
Water Framework Directive are being implemented.<br />
The challenge – the imperative - for us all is to achieve social and economic progress<br />
and an excellent environment. The costs and benefits of protecting the environment<br />
– and the costs and implications of not doing so - need to be well understood. Land<br />
1
managers need support in understanding their part in tackling diffuse pollution, and<br />
the role of one-to-one advice is critical here.<br />
New regulation will be required for the control of diffuse pollution - of that there<br />
can be no doubt. The Water Framework Directive requires EU Member States to<br />
manage diffuse sources of pollution. What is clear, however, is that legislation alone<br />
will not bring about the necessary change in practices, especially for sectors that are<br />
responsible for managing so much of Scotland’s land area. Action will be required<br />
sooner by farmers in some are<strong>as</strong> and it will be important that the re<strong>as</strong>ons why are<br />
well communicated and understood. The River B<strong>as</strong>in Management Planning process<br />
will play a key part in this.<br />
In a post-CAP reform era, the incentive for farmers and growers to produce crops or<br />
livestock depends on the market place <strong>as</strong> opposed to the receipt of farm support.<br />
This is a crucial change and must now be accompanied by the re-direction of farm<br />
support payments to the protection and conservation of natural resources. In<br />
Scotland, we expect this to happen via Land Management Contracts. Delivering<br />
financial support to address the priority issues of diffuse pollution, biodiversity and<br />
landscape is paramount.<br />
There is no doubt that modern farming and forestry practices have a major impact on<br />
air, soil and water quality. We must balance the positive and negative <strong>as</strong>pects of food<br />
and timber production and seek to maximise the ‘win wins’. Consumer interest in<br />
how and where food is produced h<strong>as</strong> never been greater and significant opportunities<br />
exist for farmers who follow the principles of Integrated Farm Management. The<br />
same applies to organic farming where consumer demand is outstripping supply and<br />
where particular attention is given to soil use and management <strong>as</strong> well <strong>as</strong> chemical<br />
inputs. Farmers are becoming more aware of these challenges and many are already<br />
successfully integrating environmental issues into their day-to-day decision making.<br />
The energy and drive to sustain and develop a business for the future is critical.<br />
Adapting to new demands is essential for business survival.<br />
Clearly, if we want a better water environment, and we certainly do, we need to<br />
support land managers with their decisions. The evidence must be there to support<br />
action and we will need to demonstrate that the actions being taken are working.<br />
At this conference we will hear of first hand experience in using particular tools,<br />
techniques and me<strong>as</strong>ures that target and manage rural diffuse pollution effectively.<br />
Making conferences like this happen involves an enormous amount of work. I would<br />
therefore like to say a big thank you to all of the SAC and SEPA staff who played a<br />
part in organising this event. I would also like to thank all of the speakers and poster<br />
presenters. We are very ple<strong>as</strong>ed to have speakers from all around the UK and the<br />
world. This is both a very exciting prospect and a fant<strong>as</strong>tic achievement on behalf<br />
of all concerned.<br />
My expectations of this conference are high and the partnerships we will forge<br />
through working together will, I hope, make our environment even better tomorrow<br />
than it is today.<br />
Dr J Campbell Gemmell<br />
Chief Executive, Scottish Environment Protection Agency<br />
2
AGRICULTURAL DIFFUSE POLLUTION:<br />
ARE WE ON THE RIGHT TRACK TO SUCCESSFUL<br />
ABATEMENT?<br />
V Novotny<br />
Department of Civil and Environmental Engineering, Northe<strong>as</strong>tern University, Boston,<br />
MA 02115, USA, E-mail: novotny@coe.neu.edu<br />
SUMMARY<br />
In the US, the US Environmental Protection Agency and States are collaborating in<br />
a co-ordinated integrated effort to address agricultural point source (e.g. feedlots)<br />
and diffuse (crop production, p<strong>as</strong>ture) pollution through the use of Total Maximum<br />
Daily Load (TMDL) programmes. In European Union Member States similar efforts<br />
are spearheaded by the Water Framework Directive (WFD) and Nitrate Directive.<br />
The majority of diffuse pollution abatement activities in watersheds impacted by<br />
anthropogenic land use focus on a single stressor, often related to a distant endpoint.<br />
However, impairment of the integrity of receiving water bodies may also be a result of<br />
other anthropogenic impacts such <strong>as</strong> stream modification, poor or no riparian zones,<br />
and water withdrawals for irrigation. Focusing on single stressors and pollutant inputs<br />
may therefore not lead to a successful restoration of integrity (good ecological status)<br />
of agricultural streams. Multi-stress modelling, identification of integrity clusters and<br />
Cluster Dominating Parameters concepts may help to incre<strong>as</strong>e the effectiveness of<br />
abatement strategies.<br />
INTRODUCTION<br />
It is well documented fact that water quality in watersheds where all or a significant<br />
part of land is devoted to agriculture and silviculture h<strong>as</strong> deteriorated in the p<strong>as</strong>t<br />
50 years. However, the connection between agricultural practices and deterioration<br />
of once clean streams w<strong>as</strong> not made until the late 20th century. In the US in the<br />
late 1970s, farmers and agro-business resented any notion of connection between<br />
pollution and agriculture (Novotny and Chester, 1981) Farmers were considered<br />
stewards of the land and soil w<strong>as</strong> considered <strong>as</strong> having an infinite capacity to<br />
accept all fertilizers (manure, w<strong>as</strong>tewater applications and chemicals) and pesticides<br />
applied to it to grow crops or dispose pollutants (e.g. w<strong>as</strong>tewater sludge or septage).<br />
However, agriculture w<strong>as</strong> changing worldwide from small family farms to agricultural<br />
conglomerates. The change from family, mostly subsistence farming to agro-business<br />
also created a revolution in productivity.<br />
The Specialty Workshop of the International Water Association (IWA) (Bendoricchio,<br />
1999), conferences by SAC/SEPA in Scotland and many other meetings and scientific<br />
work, have established the link between agriculture and pollution of receiving water<br />
bodies. The problems were first noticed in lakes and this focused the scientific<br />
community towards studying and identifying the causes of eutrophication. However,<br />
later it w<strong>as</strong> found that the problems occurred at all geographical scales, from small<br />
streams and lakes, through medium-scale, to large-scale rivers <strong>as</strong>sociated with large<br />
water bodies such <strong>as</strong> the Gulf of Mexico in the US and Black, Baltic and North Se<strong>as</strong><br />
in Europe.<br />
3
During the p<strong>as</strong>t 20 years, it became clear that problems other than eutrophication<br />
were also important and that inland lakes were not the only water bodies affected. A<br />
National Science and Technology Council (2000) publication dealing with the effects<br />
of nutrients on co<strong>as</strong>tal waters noted that unusually high numbers of deaths of sea<br />
lions and manatees, unusual patterns of coral reef destruction, widespread fish<br />
kills, outbreaks of certain shellfish poisoning, disappearance of sea gr<strong>as</strong>ses, and<br />
occurrence of so called ‘dead zones’ could all be linked in one way or another to<br />
subtle changes in the absolute abundance of certain organisms near the very b<strong>as</strong>e<br />
of the food web. The abundance of these organisms is related, directly or indirectly,<br />
to nutrients flowing into the system from upstream watersheds. The water quality<br />
problems of these water bodies have one unifying cause: they have been linked, to<br />
some degree, to agricultural practices.<br />
In the US and elsewhere, nitrate levels in high river flows in spring, after the application<br />
of fertilizers, were closely correlated to the percent of the watershed under agriculture<br />
(Figure 1). Because the concentration scale is logarithmic, the chart indicates that<br />
nitrate concentrations begin to incre<strong>as</strong>e exponentially when the agricultural land use<br />
percentage exceeds 40% t.<br />
Figure 1: Nitrate concentration vs. % agricultural land use in the Willamette<br />
River B<strong>as</strong>in, Oregon (from US Geological Survey, 1999). Forest w<strong>as</strong><br />
the other major land use in this watershed<br />
Currently, the 1991 Nitrate Directive of the European Community requires all Member<br />
States too designate Nitrate Vulnerable Zones for protection of water resources<br />
from agricultural pollution. The methodology for vulnerability <strong>as</strong>sessment identifies<br />
surface waters that are excessively polluted or could become polluted by nitrates.<br />
The strategy is then a reduction of excessive current loads and prevention of future<br />
incre<strong>as</strong>es that could impair the water body. The Nitrate Directive applies mostly to<br />
agricultural point (animal husbandry) and non-point sources.<br />
In the US, the US Environmental Protection Agency (USEPA) uses nutrient criteria<br />
to <strong>as</strong>sess vulnerability and target action. The Total Maximum Daily Load (TMDL)<br />
4
programme, embedded in Section 303(d) of the US Clean Water Act, is the flagship<br />
programme in the US for implementing water quality standard in watersheds in<br />
which mandatory point source discharge controls are not sufficient to meet the water<br />
quality goals specified in the Act. However, because the programme controls mostly<br />
identifiable point source discharges only, implementing agricultural land-b<strong>as</strong>ed<br />
me<strong>as</strong>ures is very difficult. Consequently, there are only a few TMDL studies that<br />
have been successful for controlling agricultural pollution.<br />
ROOT CAUSES OF AGRICULTURAL POLLUTION AND WATER BODY<br />
DETERIORATION<br />
Green Revolution<br />
To feed the ever incre<strong>as</strong>ing human and livestock population, agricultural production<br />
and productivity h<strong>as</strong> had to incre<strong>as</strong>e. This h<strong>as</strong> been accomplished first by expanding<br />
the amount of cultivated land by converting pristine lands – prairies, forests, deserts<br />
and wetlands – to agricultural lands by deforestation, drainage, irrigation and<br />
cultivation of idle gr<strong>as</strong>slands. The land use conversion process itself creates pollution<br />
(Novotny, 2003). However, traditional farming w<strong>as</strong> incapable of satisfying the rapidly<br />
incre<strong>as</strong>ing need for food to feed rapidly growing urban and rural populations. Yet,<br />
today, there may be more food per capita than 50 years ago and some countries that<br />
were food deficient and had severe famines not long ago (e.g. China) have become<br />
food exporters. This dramatically incre<strong>as</strong>ed agricultural production and productivity<br />
h<strong>as</strong> been a result of intensification of agriculture by changing farming practices and<br />
by the introduction of agricultural chemicals – fertilizers, herbicides and insecticides.<br />
This w<strong>as</strong> the result from a planned international effort called the ‘Green Revolution’<br />
funded by the Rockefeller and Ford Foundations and governments of many developing<br />
and developed countries. The yields were dramatically incre<strong>as</strong>ed by: (a) new crop<br />
cultivation methods; (b) developing new cop varieties; (c) irrigation; (d) dramatically<br />
incre<strong>as</strong>ed chemical fertilizer and pesticide applications; and (e) mechanization.<br />
Although the invention of chemical fertilizers and man-made toxins (pesticides)<br />
capable of eradicating unwanted weeds and insects occurred more than 80 years ago,<br />
only after the 1950s did chemical industries switch to promoting and manufacturing<br />
these chemicals for the use in agriculture and growing suburban lawns (Ongley,<br />
1996; Novotny, 2003). In the p<strong>as</strong>t 40 years, the Green Revolution h<strong>as</strong> incre<strong>as</strong>ed food<br />
production per hectare by more than 1000%, famine h<strong>as</strong> decre<strong>as</strong>ed by 20% and<br />
caloric consumption per capita, in spite of the accelerated population growth, h<strong>as</strong><br />
incre<strong>as</strong>ed 25%. The ecological impact of the Green Revolution h<strong>as</strong> been a severe<br />
degradation of water quality and eutrophication (Rosset et al., 2000).<br />
Best Management Practices (BMPs) to the Rescue<br />
After the impact of agricultural pollution w<strong>as</strong> recognized and quantified between 1970<br />
and 1980, a plethora of structural and non-structural Best Management Practices<br />
(BMPs) have since been developed. These are described in numerous manuals<br />
and books. BMPs are generally cl<strong>as</strong>sified into four categories: (1) source controls<br />
(erosion control, soil conservation, targeted fertilizer applications); (2) hydrologic<br />
modifications of source area (less used in agriculture); (3) reduction of delivery of<br />
pollutants between the sources and receiving water body (e.g. riparian buffers,<br />
5
infiltration); and (4) capture, storage and treatment (e.g. ponds, wetlands).<br />
Traditionally, BMPs control the load of pollutants (sediment, nutrients, organic<br />
carbon) from the agricultural sources to the receiving water bodies. Consequently, the<br />
objective of many agricultural diffuse pollution abatement efforts is to minimize the<br />
loads of nitrogen and the endpoint is the reduction of nitrate concentration in the large<br />
receiving water bodies that have a continental economic and ecological significance<br />
(e.g. Baltic Sea, Gulf of Mexico, Chesapeake Bay). The focus of control (endpoint)<br />
in the watershed of the Gulf of Mexico is Total Nitrogen causing hypoxia in the Gulf<br />
(Rabalais et al., 1999). Other common endpoints are phosphorus concentrations of<br />
lakes or chlorophyll, sediment, bacterial pollution caused by livestock, or dissolved<br />
oxygen depletion caused by manure applications or algal respiration.<br />
Defining the objectives of management and endpoints is obviously important, the<br />
concern with large subcontinental or regional water bodies is justified, and nitrogen<br />
and phosphorus may be the most obvious villains under such circumstances. The<br />
problem is that the sources of the pollution loads are often quite far from the points<br />
of impact. For example, the main sources of nitrogen causing hypoxia in the Gulf of<br />
Mexico are farm operations in mid-west US states that are more than one thousand<br />
kilometers away (Burkart and James, 1999). Farmers in these states are therefore<br />
detached from the point of impact and have no economic and often no regulatory<br />
incentives to reduce fertilizer applications or change their farming practices. The<br />
same logistical dilemma is typical for many other large water bodies.<br />
The EU Nitrate Directive attempted to resolve the regulatory problem by putting<br />
limits on nitrogen loads and, indirectly, on the use of fertilizers. However, focusing<br />
on reducing inputs of nitrogen only may not improve the integrity of those streams<br />
draining agricultural watersheds that have been heavily modified by drainage,<br />
straightening and loss of riparian vegetation. The anthropogenic modifications of<br />
streams to serve agriculture, and overloading these water bodies with sediments<br />
and nutrients from surrounding fields have also caused these streams to lose their<br />
buffering (w<strong>as</strong>te <strong>as</strong>similative) capacity and have incre<strong>as</strong>ed their vulnerability.<br />
Objectives (Goals) of Management<br />
The c<strong>as</strong>es of large regional water quality deterioration such <strong>as</strong> those mentioned above<br />
could be characterized <strong>as</strong> single stressor problems. Single stressor management h<strong>as</strong><br />
been the core of most management programs, i.e. identify the problem (endpoint)<br />
and the most dominant cause of impairment (single stressor) and then devise the<br />
abatement to reduce or eliminate the dominant stress, hoping that other stressors,<br />
if any, will also be reduced. However, the Clean Water Act (CWA) and the EU Water<br />
Framework Directive (WFD) also put achievement and maintaining the integrity of the<br />
water body (CWA) or the best ecological status (WFD) <strong>as</strong> the main goal and focus of<br />
abatement. Both have similar meanings.<br />
Integrity h<strong>as</strong> been defined <strong>as</strong> the capacity of a receiving water body to support and<br />
maintain a balanced, integrated, adaptive community of organisms having a species<br />
composition, diversity and functional organization comparable to that of the natural<br />
habitat of the region (Karr et al., 1986; Barbour et al., 1999). Water body integrity is<br />
<strong>as</strong>sessed using multidimensional metrics of indicator organisms (Barbour et al., 1999).<br />
6
The fish indices of biotic integrity (IBIs) h<strong>as</strong> 12 metrics and the IBI is a summation of<br />
the metrics. IBIs have also been developed for benthic macroinvertebrates.<br />
“Integrity” h<strong>as</strong> three dimensions: physical/habitat, chemical and biological (US<br />
Environmental Protection Agency, 1994). ‘Pollution’ is then understood according<br />
to its definition in the CWA, i.e. any human action that downgrades the water body<br />
integrity. Watersheds and their water bodies impacted by anthropogenic effects are<br />
subjected to external and internal stresses. These stresses can lead to impairment<br />
and a loss of sustainability.<br />
Folke et al. (2002) investigated the concept of resilience which w<strong>as</strong> defined <strong>as</strong> the<br />
state of a system that tends to maintain its integrity when subject to disturbance<br />
(Holling, 1973). Figure 1 shows the simplest effect of the impact of agriculture on<br />
the concentrations of nitrogen in the receiving waters. N concentrations in the<br />
watersheds in Oregon exponentially incre<strong>as</strong>ed (resilient state) after the agricultural<br />
land use exceeded 40 % threshold.<br />
Vulnerability is the opposite of ‘resilience’ (Folke et al., 2002). Water body and<br />
watershed vulnerability refers to the expectation that near future water quality and<br />
ecological conditions may reach an impaired status. Vulnerability is synonymous<br />
to the ‘threatened’ status of a water body defined by the TMDL regulations. The<br />
‘triggers’ of change to an impaired status are Batjes (2000): land use changes,<br />
global climatic changes, acid rain, excessive water use and withdrawals, stream<br />
anthropogenic modifications, pollutant discharges and excessive unsustainable<br />
application of chemicals.<br />
Watershed Retention Capacity (WRC) defines watershed resilience. WRC (resilience)<br />
for pollutants is related to the Capacity Controlling Parameters (CCPs) that include<br />
(Salomons and Stol, 1995; Batjes, 2000; Novotny, 2003):<br />
Organic matter content of soil and vegetation<br />
Acid Neutralization Capacity (ANC)<br />
Sulfide content of soils and sediments<br />
Soil structure and texture<br />
Microbial activity<br />
Cation Exchange Capacity<br />
Redox Potential (Eh)<br />
Soil adsorption capacity<br />
Salinity<br />
Shallow bedrock geology<br />
Most significant loads of nitrogen from Midwest US, in addition to fertilizers, are<br />
caused by drainage of wetlands (Burkart and James, 1999).<br />
Recovery. Stålnacke et al. (2003) analysed the impact of dramatic reductions of<br />
nutrient fertilizer inputs in E<strong>as</strong>tern Europe following the political changes in 1989.<br />
For example, in Estonia and Latvia, sales of mineral fertilizers dropped by a factor<br />
of 15 from 1987 to 1996, and the number of livestock decre<strong>as</strong>ed by a factor of four.<br />
Yet, in the short run of about 5 to 10 years after these changes, decre<strong>as</strong>es of nutrient<br />
inputs into e<strong>as</strong>t European receiving waters and resulting concentrations were far<br />
less than expected. In some c<strong>as</strong>es, improvements in water quality were statistically<br />
insignificant.<br />
7
DOMINATING PARAMETERS OF IMPAIRMENT AND RECOVERY<br />
Streams draining agricultural b<strong>as</strong>ins are impaired by many stressors among which<br />
channel alteration, loss of riparian buffers, siltation, reduction of watershed buffering<br />
capacity, and nutrient loads are most important. Identifying the dominant stress may<br />
not be simple and the abatement activities may be directed to a stress that may not<br />
bring about the desired improvement of integrity to the best ecological status. New<br />
models quantitatively identifying the impact of multiple stressors and threshold of<br />
impairment and recovery are needed.<br />
The current STAR (Science To Achieve Results) project conducted at Northe<strong>as</strong>tern<br />
University (Boston, M<strong>as</strong>sachusetts) is developing non-linear models of watershed<br />
biotic integrity and loading by extracting knowledge from large data containing<br />
indices of biotic integrity and their metrics and stresses from several states. The<br />
b<strong>as</strong>ic model concept is a hierarchical, four-layer progression of risks from landscape<br />
and hydrologic/hydraulic stresses and diffuse and point source pollutant inputs to<br />
instream impacts causing risks to aquatic biota. Four risks can be considered: habitat<br />
degradation, water pollution by pollutants, sediment contamination and fragmentation<br />
(Novotny et al., 2005). Artificial Neural Net (ANN) non-linear layered models are highly<br />
compatible with the hierarchical risk propagation modelling concept.<br />
The ANN models identified clusters (states) of the fish Index of Biotic Integrity (IBI)<br />
(Virani et al. 2005) and its metrics. Data sets containing more than 50 parameters<br />
me<strong>as</strong>ured several times at about 2000 sites in Maryland and Ohio were analysed.<br />
The Self Organizing Maps (SOM) of the fish IBI and its metrics were developed<br />
by unsupervised ANN learning. SOM (Kohonen, 2001) is a data clustering and<br />
visualization technique which converts complex, non-linear relationships between<br />
high-dimensional data vectors into simple geometric relationships on an e<strong>as</strong>y to<br />
visualize low-dimensional display (usually a 2-dimensional space). In SOM analysis,<br />
each neuron unit h<strong>as</strong> a different weighted connection to each and every one of<br />
the SOM output layer. These weights model the influence of an input variable (fish<br />
IBI metrics) to the sites patterned in an SOM neuron. SOM is an effective data<br />
clustering tool with its output emph<strong>as</strong>izing the salient features of the data and<br />
allowing the subsequent automatic formation of clusters of similar data items. SOMs<br />
of environmental variables (habitat, chemistry, and macro-invertebrates) were then<br />
overlaid over the SOMs of the metrics and overall fish IBI to identify the parameters<br />
that showed a similar SOM pattern (Virani et al., 2005).<br />
The three clusters of fish IBI metrics recognized in Ohio reflect the quality of the<br />
fish community. The overall fish IBIs in the clusters indicated that sites in Cluster<br />
I had ‘superior’ fish composition, sites in Cluster II were intermediate, and sites in<br />
Cluster III were inferior. However, overall IBIs varied within each cluster and there<br />
w<strong>as</strong> a minor overlap because the overall IBI is a summation of scoring of metrics.<br />
Hence the same IBI can be achieved by many variants of metric scores. Because<br />
each neuron of SOM contains several physical monitoring sites, it w<strong>as</strong> possible to<br />
locate the clusters regionally and put them on a map (Figure 2). It can be seen that<br />
most Cluster III sites were located in the highly agricultural northwest corner of the<br />
state (dominated by monocultural corn growing) and around the Cleveland – Akron<br />
industrial area. The best Cluster I sites were in the hilly more pristine e<strong>as</strong>tern and<br />
southern parts of the state.<br />
8
Non-linear Canonical Correspondence Analysis (CCA) w<strong>as</strong> subsequently used<br />
to link the stressors, not used in the unsupervised ANN learning, to the SOM and<br />
quantitatively rank the stressors <strong>as</strong> to their impact on IBIs and their metrics (Figure<br />
3) (Virani et al., 2005). CCA is a powerful method for the multivariate exploration<br />
of large-scale data (Legendre and Legendre, 1998). This is a weighted average<br />
ordination technique providing simultaneous ordering of sites and species, rapid and<br />
simple computation and very good performance when species have non-linear and<br />
unimodal relationships to environmental gradients (Palmer, 1993). CCA can also be<br />
used to identify the Cluster Dominating Parameters (CDP). From Figure 3 it can be<br />
seen that sites in Cluster I (with superior fish IBIs) are most sensitive to habitat quality<br />
parameters and forested land (including riparian land) while sites in Cluster III (with<br />
inferior IBIs) are most impacted by pollutants and intensive land uses by humans.<br />
Figure 2: Distribution of Clusters of IBI in Ohio. Cluster III (poor) sites are<br />
located in the northwest (agricultural), north (Cleveland – Akron),<br />
central (Columbus) and southe<strong>as</strong>t (Dayton – Cincinnati) (Virani et al.,<br />
2005)<br />
9
Using the results of the unsupervised learning of SOMs and CCA, the top 25 CDP<br />
parameters affecting fish IBIs for Ohio were identified. Nitrogen and phosphorus<br />
concentrations were less important. Indeed P concentrations were not identified in<br />
the top 25 parameters impacting biotic integrity. Using this identification of CDPs, an<br />
accurate input/output ANN model w<strong>as</strong> then developed by supervised ANN learning<br />
wherein the overall fish IBI w<strong>as</strong> the dependent output and the 12 most important<br />
CDPs were inputs (Brooks and Novotny, 2005).<br />
Figure 3: Cluster Dominating Parameters <strong>as</strong>certained by the Canonical<br />
Correspondence Analysis overlaid with the IBI metric clusters<br />
(Virani et al., 2005)<br />
CONCLUSIONS<br />
A great majority of abatement plans for diffuse pollution in watersheds impacted by<br />
anthropogenic land use and activities focus on a single stressor, often related to a<br />
distant endpoint. These efforts and regulative approaches are justified because they<br />
involve large water bodies of great economic and ecological importance. However,<br />
many local diffuse pollution problems are caused by multiple stresses and a single<br />
stressor approach focusing on one nutrient may not necessarily help improve the<br />
integrity (ecological) status of the immediate small or medium size water body. Using<br />
this analysis of Ohio sites and a similar analysis for Maryland (Virani et al., 2005), it<br />
w<strong>as</strong> found that sites with superior Cluster I fish IBIs were impacted mostly by habitat<br />
parameters. Using the results of the unsupervised learning of SOMs and CCA, the<br />
top 25 CDP parameters affecting fish IBIs for Ohio were identified. Nitrogen and<br />
phosphorus concentrations were less important. Indeed P concentrations were not<br />
10
identified in the top 25 parameters impacting biotic integrity. Using this identification<br />
of CDPs, an accurate input/output ANN model w<strong>as</strong> then developed by supervised<br />
ANN learning wherein the overall fish IBI w<strong>as</strong> the dependent output and the 12 most<br />
important CDPs were inputs (Brooks and Novotny, 2005) within which embeddedness<br />
w<strong>as</strong> the most important CDP. Embeddedness is a consequence of siltation,<br />
gradient (affecting watercourse velocity), channelization and impounding (affecting<br />
watercourse depth). Other impacts that are correlated with it are shown on Figure 3.<br />
Incre<strong>as</strong>ing embeddedness drives the site towards Cluster III. Cluster III is dominated<br />
by more traditional pollutants and poor substrate.<br />
Identification of Clusters and their dominating stressors (CDPs) is important in the<br />
choice of abatement strategies. Focusing on a single ‘popular’ stressor and pollutant<br />
input may not lead to a successful restoration of integrity (good ecological status) of<br />
agricultural streams. Multi-stress modeling and identification of CDPs may therefore<br />
serve to help put the abatement activities on the right track.<br />
ACKNOWLEDGMENTS<br />
The work described in this paper w<strong>as</strong> partially sponsored by the US Environmental<br />
Protection Agency’s STAR program. The views expressed are those of the author<br />
and not of USEPA. Cooperation and input of Professor Eli<strong>as</strong> Manolakos and Hardik<br />
Virani are acknowledged and appreciated.<br />
REFERENCES<br />
Barbour MT, Gerritsen J, Snyder BD and Stribling JB (1999). Rapid Bio<strong>as</strong>sessment<br />
Protocols for Use in Streams and Wadeable Rivers: Periphyton, Benthic Macroinvertebrates,<br />
and Fish, Second edition, EPS-841-B-99/002, US Environmental Protection<br />
Agency, W<strong>as</strong>hington, DC.<br />
Batjes NH (2000). Soil Vulnerability to Diffuse Pollution in Central and E<strong>as</strong>tern Europe<br />
(COVEUR Project). Food and Agriculture Organization of United Nations, Rome (IT).<br />
Bendoricchio G (editor) (1999). Special issue, Water Science and Technology 39, 3,<br />
1-156.<br />
Brooks JK and Novotny V (2005). Evaluating Single and Multiple Stressors in Watershed<br />
Risk Assessment – Technical Report # 3, Center for Urban Environmental<br />
Studies, Northe<strong>as</strong>tern University, URL http://www.coe.neu.edu/environment.<br />
Burkart MR and James DE (1999). Agricultural-nitrogen contributions to hypoxia in<br />
the Gulf of Mexico. Journal of Environmental Quality 28, 850–859.<br />
Folke C, Carpenter S, Walker B, Scheffer M, Elmquist T, Gunderson L and Holling CS<br />
(2002). Regime shifts, resilience, and biodiversity in ecosystem management. Annual<br />
Review of Ecology, Evolution and Systematics 35, 557–581.<br />
Holling CS (1973). Resilience and stability of ecological systems. Annual Reviews of<br />
Ecology Systematics 4, 1–23.<br />
Karr JR, Fausch KD, Angermeier PL, Yant PR and Schlosser IJ (1986). Assessing<br />
Biological Integrity in Running Waters: a Method and its Rationale. Special Publication<br />
5, Illinois Natural History Survey, Champaign, IL.<br />
11
Kohonen T (2001). Self-Organizing Maps. Springer Verlag, Berlin.<br />
Legendre P and Legendre L (1998). Numerical Ecology. Elsevier Science BV, Amsterdam.<br />
National Science and Technology Council (2000). An Integrated Assessment Hypoxia<br />
in the Northern Gulf of Mexico. Executive Office of the President of the US, W<strong>as</strong>hington,<br />
DC.<br />
Novotny V (2003). Water Quality: Diffuse Pollution and Watershed Management. J.<br />
Wiley Publ., Hoboken, NJ.<br />
Novotny V and Chester G (1981) Handbook of Nonpoint Pollution: Sources and Management.<br />
Van Nostrand Reinhold, New York, NY.<br />
Novotny V, Bartošová A, O’Reilly N and Ehlinger T (2005). Unlocking the relationships<br />
of biotic integrity of impaired waters to anthropogenic stresses. Water Research 39,<br />
184–198.<br />
Ongley ED (1996). Control of Water Pollution from Agriculture. Food and Agriculture<br />
Organization, Rome.<br />
Palmer MW (1993). Putting things in even better order: The advantage of Canonical<br />
Correspondence Analysis. Ecology 74, 2215.<br />
Rabalais NN, Turner RE, Dunravko J, Dortsch Q and Wisman WJ Jr (1999). Characterization<br />
of Hypoxia – Topic 1 report for the Integrated Assessment on Hypoxia in<br />
the Gulf of Mexico. NOAA, Series No. 17, Silver Spring, MA.<br />
Rosset P, Collinds J and Moore-Lappe F (2000). Lessons from the Green Revolution,<br />
Food First, Institute for Food and Development Policy, URL http://www/foodfirst.<br />
org/media/opeds/4-grrrre.html.<br />
Salomons W and Stol B (1995). Soil pollution and its mitigation: Impact of land use<br />
changes on soil storage of pollutants, in Nonpoint Pollution and Urban Stormwater<br />
Management (V. Novotny, ed.), Technomic Publishing Co., Lanc<strong>as</strong>ter, PA.<br />
Stålnacke P, Grimwall A, Libiseller C, Laznik M and Kokorite I (2003). Trends in nutrient<br />
concentrations in Latvian rivers and the response to the dramatic change in<br />
agriculture. Journal of Hydrology 283, 184–205.<br />
US Geological Survey (1999). The Quality of Our Nation’s Waters, Circular 1225,<br />
USGS, Reston, VA.<br />
US Environmental Protection Agency (1994). Water Quality Standards Handbook,<br />
second edition, EPA-823-b-94-005A, Office of Water, W<strong>as</strong>hington, DC.<br />
Virani H, Manolakos E and Novotny V (2005). Self Organizing Features Maps Combined<br />
with Ecological Ordination Techniques for Effective Watershed Management.<br />
Tech. Report #4, Center for Urban Env. Studies, Northe<strong>as</strong>tern University, Boston,<br />
MA, URL www.coe.neu.edu/environment.<br />
12
MATCHING WATER FRAMEWORK DIRECTIVE<br />
CONTROLS WITH DIFFUSE POLLUTION CHALLENGES<br />
IN SCOTLAND<br />
RC Morris 1 , J MacDonald 1 , SM Greig 2 and C Preston 1<br />
1<br />
Scottish Environment Protection Agency, Corporate Office, Erskine Court, The C<strong>as</strong>tle<br />
Business Park, Stirling, FK9 4TR, UK, E-mail: rob.morris@sepa.org.uk; 2 Scottish<br />
Environment Protection Agency, Edinburgh Office, Clearwater House, Heriot Watt<br />
Research Park, Avenue North, Riccarton, Edinburgh, EH14 4AP, UK<br />
SUMMARY<br />
The Water Framework Directive (WFD) requires regulatory controls be established<br />
to prevent or control the input of pollutants to surface or groundwater. For the first<br />
time this provides potential for a regulatory approach to mitigating diffuse pollution<br />
in Scotland, currently the most significant chemical pressure on Scotland’s water<br />
quality. A regulatory approach on its own will not achieve the required water quality<br />
targets; rather, a combination of me<strong>as</strong>ures is required including education, economic<br />
incentives and regulation. Key to the proposed approach and integral to the WFD<br />
is the concept of control me<strong>as</strong>ures being proportionate to risk. This paper focuses<br />
on how best to match emerging WFD controls with diffuse pollution pressures on<br />
the water environment in Scotland. To do so requires an understanding of how<br />
and where diffuse pollution occurs <strong>as</strong> well <strong>as</strong> an understanding of the pollutant<br />
loading, <strong>as</strong>sociated short- and long-term impacts and the effectiveness of remedial<br />
me<strong>as</strong>ures.<br />
INTRODUCTION<br />
The nature of diffuse pollution h<strong>as</strong> important implications for its control. Diffuse<br />
pollution typically arises from a multitude of small sources, such <strong>as</strong> poaching of river<br />
banks by livestock or run-off from forestry tracks, that are individually insignificant in<br />
terms of environmental impact but at a catchment scale can have a detrimental effect.<br />
The transport of diffuse pollutants is also important. Pollutants often travel overland,<br />
mainly driven by rainfall events before reaching surface waters. For groundwater,<br />
pollutants are transported through the soil column (Scottish Executive, 2005).<br />
For the control of diffuse pollution these characteristics mean practical me<strong>as</strong>ures<br />
need to focus on land and run-off management practices rather than traditional ‘endof-pipe’<br />
regulation. It is the activities which cause diffuse pollution rather than the<br />
individual pollutant losses which must be addressed in order to see an improvement<br />
in water quality. The impacts of diffuse pollution are related to certain geographic,<br />
climatic and geological conditions and may differ greatly from place to place,<br />
resulting in the need for a targeted approach to pollution mitigation. The nature of<br />
diffuse pollution also means that environmental impacts and the success of control<br />
me<strong>as</strong>ures to address those impacts are me<strong>as</strong>ured on a catchment scale. This<br />
provides opportunities for community ownership of the problems and their solutions.<br />
A regulatory approach on its own will not achieve the required water quality targets<br />
and a combination of me<strong>as</strong>ures is required including education, economic incentives<br />
and regulation.<br />
13
WATER FRAMEWORK DIRECTIVE IMPLEMENTATION IN SCOTLAND<br />
The WFD is being progressively implemented in Scotland. In an annual report to the<br />
Scottish Parliament (Scottish Executive, 2003), the Scottish Executive set out the<br />
progress on implementing the Water Environment and Water Service (Scotland) Act<br />
2003 (WEWS Act). At this time, a National Stakeholder Forum w<strong>as</strong> established to<br />
inform implementation, a single River B<strong>as</strong>in District for Scotland w<strong>as</strong> designated with<br />
a separate cross-border area for the Solway-Tweed and the process for developing<br />
regulatory regimes w<strong>as</strong> described.<br />
Point source, engineering and building works, water abstraction and impoundment<br />
controls are now all in force under the Water Environment (Controlled Activities)<br />
(Scotland) Regulations 2005 (CAR). These came into force on 1 April 2006. In<br />
December 2005, the Scottish Executive published a consultation on proposals for<br />
a strategy to address diffuse water pollution from rural land use. A considerable<br />
amount of detailed work will be required in 2006-2007 to develop the shape of a<br />
diffuse pollution control regime. A package of me<strong>as</strong>ures is envisaged, both regulatory<br />
and supportive, using voluntary programmes and farm support payments whilst at<br />
the same time proposing that ‘national’ and ‘targeted’ GBRs be developed. SEPA<br />
strongly supports the ph<strong>as</strong>ing in of ‘national’ GBRs in 2007 and of ‘targeted’ GBRs<br />
in 2008. It will be important to align the conditions for the receipt of farm support<br />
to WFD objectives and not to lose, or dilute, any of the existing requirements under<br />
‘Good Farming Practice’ for payments made under Rural Development Regulation<br />
(RDR) Schemes. D’Arcy et al.. (2006) outlines how this legislation will work in practice<br />
and what regulatory options there are for the management of diffuse pollution, in<br />
particular.<br />
In 2004, SEPA carried out the most detailed characterisation <strong>as</strong>sessment of pressures<br />
and impacts on the water environment ever undertaken for both the Scotland and<br />
Solway-Tweed River B<strong>as</strong>in Districts (SEPA, 2005a). Diffuse pollution places up to<br />
45% of the water bodies in Scotland at risk of not meeting the WFD’s environmental<br />
objectives. Agriculture w<strong>as</strong> clearly shown to be the major pressure although not<br />
invariably the most severe. The results will be used to prioritise both environmental<br />
monitoring and those water bodies where management action is required. Further<br />
characterisation to refine the risk <strong>as</strong>sessments is ongoing and will be published by<br />
SEPA in the Significant Water Management Issues Report, <strong>as</strong> required by WFD, in<br />
mid-2007.<br />
SEPA recently published its River B<strong>as</strong>in Management Planning Strategy (SEPA<br />
2005b) which describes how SEPA plans to produce Scotland’s first and subsequent<br />
RBMPs. The first River B<strong>as</strong>in Management Plan will be published in 2009. This will<br />
establish the programme of me<strong>as</strong>ures to meet the objectives of WFD such that this<br />
programme is fully operational by 2012. The deadline for achieving environment<br />
objectives, including those for diffuse pollution, is 2015.<br />
NATURE OF THE PROBLEM – CHARACTERISATION OF DIFFUSE POLLUTION<br />
The characterisation results (SEPA, 2005a) clearly showed that diffuse pollution, from<br />
a range of sources, is a significant pressure on Scotland’s water resources. A total<br />
of 488 (24.3%) river, 57 (18.4%) loch, 18 (45%) transitional, 59 (13.1%) co<strong>as</strong>tal and<br />
21 (19.8%) groundwater bodies are at risk of not achieving the WFD’s environmental<br />
14
objectives due to diffuse pollution. Diffuse pollution is now a more significant source<br />
of pollution than point sources in most water bodies. This significant shift reflects the<br />
improvements in point source discharges brought about by more effective regulation.<br />
Agriculture is the most significant cause of diffuse water pollution in Scotland although<br />
it is not invariably the most severe. Urban run-off is responsible for some of the most<br />
polluted waters in Scotland. Other important pressures are forestry and acidification.<br />
Figure 1 shows the relative pressure on river waters by industry sector.<br />
Diffuse Pollution Pressures on Rivers in Scotland 2005<br />
Septic tanks Other<br />
Forestry<br />
Urba n run-off<br />
Agriculture and<br />
Forestry<br />
Acidification<br />
Arable and<br />
horticulture<br />
Mining a nd<br />
quarrying<br />
Mixed F arming<br />
Livestock<br />
Figure 1: Diffuse pressures on rivers in Scotland by sector. The category<br />
‘agriculture and forestry’ is where further characterisation is<br />
required to split their relative contributions. ‘Other’ includes<br />
recreation, water transport and refuse disposal activities (Scottish<br />
Executive, 2005)<br />
A screening tool for diffuse pollutants h<strong>as</strong> been developed (Anthony et al., 2005)<br />
to supplement the risk <strong>as</strong>sessment described above. This h<strong>as</strong> allowed sources of<br />
pollutants from agriculture, forestry, urban run-off, roads, septic tanks and sewage<br />
discharges to be estimated (Table 1). Agriculture clearly dominates the losses of<br />
N, P and soils, contributing 74%, 52% and 88% of the total load, respectively.<br />
Sewage discharges dominate the faecal pathogen load, but with agriculture making<br />
a significant 23% contribution. Forestry is a significant contributor to soil losses<br />
because of the sensitivity of some are<strong>as</strong>, e.g. upland nutrient-poor lochs, where P<br />
losses are locally significant.<br />
15
Table 1:<br />
Modelled total annual losses (for Escherichia coli 1014 cfu per year,<br />
otherwise tonnes per year) to surface and groundwater by source<br />
Diffuse sources<br />
Urban Roads Agriculture Forestry<br />
Septic<br />
tanks<br />
Point<br />
source<br />
Sewage<br />
discharges<br />
NO 3<br />
2724 470 45569 769 1886 10558<br />
P 289 36 2833 237 142 1928<br />
SS 46820 29598 773845 13449 7513 7198<br />
FIO 400 90 7300 – 2400 21400<br />
Information on agricultural practices causing water bodies to be placed at risk h<strong>as</strong><br />
been compiled from farm scale diffuse pollution audit work (Frost et al., 2000). Major<br />
activities posing a risk to the water environment include excessive use of nutrients<br />
in many c<strong>as</strong>es caused by not taking into account the nutrient content of manures<br />
and slurries, the use of contractors resulting in spreading of slurry in inappropriate<br />
conditions, cropping in high-risk locations e.g. arable cultivation of fields that flood<br />
regularly, cultivation of slopes next to watercourses, and the access of stock to<br />
watercourses.<br />
SEPA will continue to refine its risk <strong>as</strong>sessment data. A new monitoring programme<br />
will be underway in 2006. For diffuse pollution, monitoring needs to be more intensive<br />
and it is planned to monitor in a range of ‘priority catchments’ which represent a<br />
selection of land use, soil type and climatic conditions in Scotland. More details<br />
of this and the results of further characterisation will be described in the Significant<br />
Water Management Issues Report due to be published in 2007.<br />
MONITORING AND CLASSIFICATION<br />
The WFD requires SEPA, and other responsible organisations in Scotland, to develop<br />
new monitoring and cl<strong>as</strong>sification systems by December 2006. The monitoring and<br />
cl<strong>as</strong>sification systems will cover all surface water and groundwater bodies, and<br />
be b<strong>as</strong>ed on a new Ecological Cl<strong>as</strong>sification system, with five quality cl<strong>as</strong>ses. The<br />
cl<strong>as</strong>sification system will be underpinned by a range of biological quality elements,<br />
supported by me<strong>as</strong>urements of physico-chemistry, hydrology and morphology. As<br />
a prerequisite to remediation accurate estimates of the relative sources of diffuse<br />
pollutants must be made. For diffuse pollutants this presents a particular challenge<br />
due to the flow proportional nature of diffuse loads and concentrations (Figure 2).<br />
16
Figure 2: Total phosphorus concentration during a storm event in the Loch<br />
Leven catchment (South E<strong>as</strong>t Scotland) (Greig et al., 2005)<br />
SEPA’s approach to monitoring and <strong>as</strong>sessing diffuse pollution is being extended<br />
and the requirement to focus on quantifying diffuse pollution loads across a range of<br />
flows h<strong>as</strong> been identified. There remains a need to develop new tools for <strong>as</strong>sessing<br />
diffuse pollution and identifying and targeting remediation actions.<br />
As a mechanism for <strong>as</strong>sessing diffuse pollution inputs and informing selection of<br />
appropriate remediation targets, and options for achieving these targets, the Total<br />
Maximum Daily Load (TMDL) concept, described elsewhere in this volume, which<br />
h<strong>as</strong> been developed and applied successfully in North America, may have relevance<br />
to water pollution management in Scotland, particularly in respect to meeting WFD<br />
objectives.<br />
B<strong>as</strong>ed on SEPA’s preliminary <strong>as</strong>sessment of TMDLs, a summary of how elements<br />
of the TMDL approach could contribute to diffuse pollution <strong>as</strong>sessment and<br />
management in Scotland are provided below:<br />
• TMDLs differ from existing approaches to achieving water quality targets in that<br />
they shift attention to pollutant sources, rather than impact. This ensures that<br />
subsequent actions focus on cause <strong>as</strong> well <strong>as</strong> symptom.<br />
• The TMDL approach allows quantification and <strong>as</strong>sessment of both pollutant<br />
concentrations and pollutant loads.<br />
• Managing pollutant loads promotes the development of mechanisms to control<br />
the cumulative impact of diffuse, <strong>as</strong> well <strong>as</strong> point source, pressures in a catchment.<br />
This might include sedimentation of riverbeds, pollution of estuarine sediments,<br />
delivering bathing water compliance and eutrophication of lochs. Degradation of<br />
many freshwater and estuarine habitats occurs <strong>as</strong> a consequence of the gradual<br />
accumulation of materials or pollutants. This accumulation is controlled by loads<br />
rather than concentrations.<br />
17
• It should be possible to apply Water Quality Standards, <strong>as</strong> required by the WFD,<br />
within a TMDL approach. The development of load thresholds would be required<br />
to <strong>as</strong>sess those pollutants potentially resulting in a cumulative impact on water<br />
quality or ecosystem health. This is system specific (i.e. to discharge point and<br />
sensitive species’ etc.).<br />
• Diffuse pollution ‘hotspots’ can be targeted using the TMDL approach. This is<br />
consistent with the risk-b<strong>as</strong>ed approach identified within the WFD.<br />
• Source apportionment is central to the successful implementation of a TMDL and<br />
is identified within the WFD directive <strong>as</strong> a means of managing pollution.<br />
• Many elements of the TMDL process are similar to those that are applied with<br />
River B<strong>as</strong>in Management Plans (RBMPs), thus it may be possible to integrate<br />
TMDL targets and procedures into RBMPs.<br />
• SEPA’s diffuse pollution screening tool and proposed diffuse pollution monitoring<br />
strategy are broadly compliant with the <strong>as</strong>sessment and monitoring tools<br />
promoted with the TMDL approach.<br />
In summary, elements of the TMDL approach may have relevance to managing diffuse<br />
pollution, particularly in relation to providing a planning framework for identifying and<br />
implementing me<strong>as</strong>ures to address diffuse pollution pressures. Subsequent papers<br />
in this conference provide further details of the TMDL approach.<br />
RIVER BASIN MANAGEMENT PLANNING<br />
A RBMP must be produced for each river b<strong>as</strong>in district. These plans set out the<br />
characteristics, pressures and impacts of the district, including a list of the waterb<strong>as</strong>ed<br />
protected are<strong>as</strong> and an economic <strong>as</strong>sessment of water services. They<br />
must also provide a summary of monitoring carried out and the consultation and<br />
participation opportunities given to interested parties. Finally, they should list the<br />
environmental objectives to be met and summarise a programme of me<strong>as</strong>ures<br />
designed to deliver those objectives.<br />
The programme of me<strong>as</strong>ures within each RBMP will consist of a combination of the<br />
most cost effective me<strong>as</strong>ures that will include:<br />
• controls under the CAR regime delivered by SEPA;<br />
• regulatory regimes operated by other responsible authorities;<br />
• economic instruments such <strong>as</strong> agricultural support and forestry grants; and<br />
• voluntary me<strong>as</strong>ures such <strong>as</strong> initiatives to improve habitat quality and education<br />
initiatives, for example, to address urban diffuse pollution.<br />
The river b<strong>as</strong>in planning process is an ongoing one which protects, improves and<br />
promotes sustainable development and use of the water environment between each<br />
published RBMP (Figure 3). There is flexibility within river b<strong>as</strong>in planning which will<br />
ensure that objectives set within each RBMP are achievable and affordable, and that<br />
the plans are able to consider strategic trends, drivers and issues affecting the water<br />
environment (SEPA, 2005).<br />
18
Figure 3: The river b<strong>as</strong>in management planning process<br />
The WEWS Act requires that Advisory Groups are to be formed to <strong>as</strong>sist and advise<br />
SEPA in the RBMP production. To meet this requirement and facilitate the active<br />
involvement of stakeholders a river b<strong>as</strong>in planning advisory group network is to be<br />
established from April 2006. This will consist of a National Advisory Group and a<br />
network of Area Advisory Groups. Each Area Advisory Group will also establish a<br />
forum with a wide and open membership of interested stakeholders. This tiered<br />
system of stakeholder involvement will allow a bottom-up and top-down approach<br />
to the production of RBMPs.<br />
AGRICULTURAL SUPPORT PAYMENTS, PARTNERSHIP AND WFD<br />
Approximately £450 million is paid to Scottish farmers under the Common<br />
Agricultural Policy (CAP) and RDR Single Farm Payment and Agri-Environment<br />
Schemes, respectively. Making sure that this funding provides an incentive to deliver<br />
a protected and improved environment, including meeting WFD objectives, is critical.<br />
Changing from a system of support that encourages production, and progressive<br />
intensification, to one that delivers multiple benefits is needed. The significance of<br />
diffuse water pollution from agriculture is now well recognised and SEPA believes<br />
that the economic incentives now need to be directed to the uptake of me<strong>as</strong>ures to<br />
address it.<br />
The 2003 reform of the Common Agricultural Policy (CAP) took effect in Scotland<br />
in January 2005. As well <strong>as</strong> decoupling farm support from the need to produce<br />
crops or livestock, a system of cross-compliance w<strong>as</strong> introduced. This includes<br />
a limited range of environmental legislation such <strong>as</strong> the EC Groundwater, Nitrates<br />
and Sludge Directives <strong>as</strong> well <strong>as</strong> a requirement to keep land in ‘Good Agricultural<br />
and Environmental Condition’ (GAEC). SEPA is involved <strong>as</strong> a ‘specialist agency’<br />
in operating cross-compliance in Scotland. In Scotland, GAEC is <strong>as</strong>sessed by the<br />
19
Scottish Executive against 18 me<strong>as</strong>ures that relate to the protection of soil and<br />
habitats. Breaches of GAEC or the Statutory Management Requirements will lead to<br />
penalties being applied to farm support payments paid by the Scottish Executive.<br />
SEPA relies on partnerships to deliver on its environmental objectives. With such<br />
diverse sectors such <strong>as</strong> farming, it is difficult to know how best to communicate<br />
on issues such <strong>as</strong> diffuse pollution. No single representative organisation covers<br />
all types of farm business in Scotland. The Scottish Crofting Foundation, Scottish<br />
Rural Property and Business Association and NFU Scotland are key stakeholder<br />
groups and will continue to be closely involved in the RBMP process in Scotland. For<br />
sewage and water-related priorities, SEPA informs a forward investment programme<br />
b<strong>as</strong>ed on EC Directive requirements and agreed water quality objectives. It is not <strong>as</strong><br />
well structured <strong>as</strong> that for agriculture.<br />
Since SEPA w<strong>as</strong> created in 1996, we have set out to build a constructive relationship<br />
with farmers at both a national and local level. Working closely with SAC and the<br />
Farming and Wildlife Advisory Group (FWAG) on buffer strips, <strong>as</strong> well <strong>as</strong> on w<strong>as</strong>te<br />
minimisation and habitat enhancement work h<strong>as</strong> been central to this approach.<br />
Since 2001, SEPA h<strong>as</strong> also worked with farming, environmental, crop protection<br />
companies and the Government in supporting The Voluntary Initiative, the alternative<br />
to the introduction of a pesticides tax. This 5-year programme is to continue and is<br />
expected to align itself more closely with the delivery of WFD objectives, especially for<br />
diffuse pollution. SEPA h<strong>as</strong> also recently commenced dialogue with the Agricultural<br />
Industries Confederation (AIC) <strong>as</strong> the representative body of suppliers of fertilisers<br />
and feedstuffs to UK agriculture.<br />
Agricultural interests will be represented throughout the RBMP process. Advisory<br />
groups will identify priorities for environmental protection and an <strong>as</strong>sociated costeffective<br />
programme of me<strong>as</strong>ures. It is vital that land managers engage in this<br />
process <strong>as</strong> this will then maximise the opportunity to target effective management<br />
action. It will be possible for individual farmers to participate actively in the RBMP<br />
process through the RBMP Area Advisory Group Fora. Farm advisors will also be an<br />
important link between farmers and river b<strong>as</strong>in planning.<br />
REGULATORY CONTROLS<br />
The newly introduced CAR legislation will be covered in detail in the final session of<br />
this Conference. The CAR approach will apply to a number of industry sectors. A<br />
light touch of regulation is proposed for agriculture and forestry compared with other<br />
industries; the emph<strong>as</strong>is being on the use of GBRs <strong>as</strong> the mode of Authorisation.<br />
Currently, although there is a significant amount of guidance available for farmers and<br />
the economic drivers are now more aligned towards improving water quality, there is<br />
no single piece of legislation tackling diffuse pollution per se. For rural land use the<br />
proposed approach will follow a similar structure to CAR but will be considerably less<br />
stringent than that applied to point source discharges. A combination of me<strong>as</strong>ures<br />
encomp<strong>as</strong>sing economic incentives, education, guidance and regulation will be used<br />
<strong>as</strong> part of a supportive framework. This is in view of the fact that the mitigation of<br />
diffuse pollution requires a different regulatory approach to traditional point source<br />
controls. The nature of diffuse pollution is such that controls must be focused on<br />
the activities causing the pollution rather than quantitatively regulating pollutant<br />
20
losses. The proposed national GBR will ensure a level playing field for the industry.<br />
The targeted approach will ensure that me<strong>as</strong>ures are only applied where they are<br />
required, in accordance with risk.<br />
It is proposed that the GBRs for rural land use will be structured around the main<br />
pressures, <strong>as</strong> follows:<br />
• fertiliser and manure management;<br />
• land and livestock management;<br />
• management and use of pesticides and veterinary medicines;<br />
• control of surface water run-off; and<br />
• planning tools (e.g. diffuse pollution audits).<br />
CONCLUSIONS<br />
Managing rural diffuse pollution will depend on a good understanding of land<br />
use within catchments. The use of the Total Maximum Daily Loads could play<br />
a valuable part in River B<strong>as</strong>in Management Planning so <strong>as</strong> to address point and<br />
diffuse source pollution collectively. This will require SEPA to implement suitable<br />
monitoring strategies and learn from US experience. It will also require SEPA to work<br />
collaboratively through partnerships with key stakeholders.<br />
A combination of me<strong>as</strong>ures will be required to bring about an improvement in the<br />
water environment in respect of diffuse pollution pressures. While the WFD requires<br />
legislative controls to be introduced, this cannot work in isolation from voluntary<br />
programmes, education, promotion of guidance and the provision of financial<br />
incentives via farm support payments.<br />
A targeted approach that focuses on ‘priority catchments’ is proposed such that the<br />
accumulative benefit of adopting Best Management Practices can be gained (<strong>as</strong> well<br />
<strong>as</strong> effectiveness be me<strong>as</strong>ured).<br />
The River B<strong>as</strong>in Management Planning process is crucial to the delivery of WFD<br />
objectives and stakeholder engagement is central to this. The Programme of<br />
Me<strong>as</strong>ures developed for the Scotland River B<strong>as</strong>in District in relation to diffuse rural<br />
pollution will need to founded on a supportive approach.<br />
About this Text<br />
The opinions expressed in this paper are those of the authors and do not necessarily<br />
reflect the view of the Scottish Environment Protection Agency (SEPA).<br />
21
REFERENCES<br />
Anthony S, Betson M, Lord E, Tagg A, Abbot C, Struve J, Lilly A, Dunn S and Towers<br />
W (2005). Screening Tool to Identify and Characterise Diffuse Pollution Pressures.<br />
URL http://www.sniffer.org<br />
Frost A, Stewart S, Kerr D and MacDonald J (2000). The impacts of<br />
agricultural environmental management: c<strong>as</strong>e studies from theory to practice.<br />
URL http://www.sepa.org.uk/publications/technical/imp_env_man/index.htm<br />
Greig SM (2005). Total Maximum Daily Loads (TMDLs) <strong>as</strong> a B<strong>as</strong>is for Assessing and<br />
Improving the Quality of Freshwater Systems. Briefing note for SEPA staff.<br />
Scottish Executive (2003). Implementation of the Water Environment and Water<br />
Services (Scotland) Act 2003, Annual Report to the Scottish Parliament – 2003.<br />
Scottish Executive Publication, Edinburgh.<br />
Scottish Executive (2005). Scottish Executive Environment Group. Diffuse Water<br />
Pollution from Rural Land Use. Paper 2005/35. Scottish Executive Publication,<br />
Edinburgh.<br />
Scottish Executive (2005). Prevention of Environmental Pollution from Agricultural<br />
Activity (PEPFAA) Code. Scottish Executive Publication, Edinburgh.<br />
SEPA (2005a). Scotland River B<strong>as</strong>in District, Characterisation and impacts analyses<br />
required by Article 5 of the Water Framework Directive, Summary Report. URL<br />
http://www.sepa.org.uk/publications/wfd/index.htm<br />
SEPA (2005b). River B<strong>as</strong>in Management Planning Strategy for the Scotland River<br />
B<strong>as</strong>in District. URL http://www.sepa.org.uk/publications/wfd/index.htm<br />
22
TOTAL MAXIMUM DAILY LOADS: THE USEPA<br />
APPROACH TO MANAGING FAECAL INDICATOR<br />
FLUXES TO RECEIVING WATERS: LESSONS FOR UK<br />
ENVIRONMENTAL REGULATION?<br />
D Kay 1 , C Stapleton 1 , M Wyer 1 , A McDonald 2 and J Crowther 1<br />
1<br />
Centre for Research into Environment and Health, University of Wales, Lampeter,<br />
Ceredigion, Aberystwyth SA48 8HU, UK, E-mail: dvk@aber.ac.uk; 3 Earth and Biosphere<br />
Institute, University of Leeds, Leeds LS2 9JT, UK<br />
SUMMARY<br />
In the European Union, the Water Framework Directive (WFD) (CEC, 2000) requires<br />
the EU environmental regulators to design a ‘programme of me<strong>as</strong>ures’ (Article 11) to<br />
maintain at le<strong>as</strong>t ‘good’ status in ‘protected’ are<strong>as</strong> which are defined in Annex VI. The<br />
first protected area mentioned is that covered by the Bathing Water Directive 76/160/<br />
EEC which is currently under revision (CEC, 2002; CEC, 2004) . The original 1976<br />
Directive, and the revisions which now define ‘good’ (or possibly the newly defined<br />
‘sufficient’) status must be achieved or a member state could be subject to legal<br />
action, or infraction, proceedings, by the Commission. Several UK studies have been<br />
conducted to provide empirical data describing the impacts of catchment-derived<br />
faecal indicator loadings on recreational water compliance locations.<br />
In the United States of America, the Total Maximum Daily Loads (TMDLs) concept<br />
enshrines similar principles into water quality management (USEPA, 2002). Section<br />
303(d) of the Federal Water Pollution Control Water Act (page 103) requires that<br />
States identify water bodies that do not meet defined water quality standards.<br />
The TMDL process investigates these water quality problems and designs actions<br />
in consultation with stakeholders to effect remediation. In defining how much of a<br />
pollutant a water body can tolerate, whilst complying with water quality standards, a<br />
TMDL investigation should quantify all pollutant fluxes to include effluent discharges<br />
from w<strong>as</strong>tewater treatment facilities, diffuse source pollution from agriculture and<br />
surface drainage from streets or highways. Many TMDL studies are addressing<br />
catchment derived faecal indicator loadings to recreational waters and shellfish<br />
harvesting are<strong>as</strong> (USEPA, 2002).<br />
This paper provides an analysis of the TMDL and WFD approaches in the area<br />
of faecal indicator control. Common problems of (i) empirical data gaps; (ii) the<br />
absence of operationally appropriate modelling tools and (iii) inadequate data on<br />
the effectiveness of remedial me<strong>as</strong>ures are noted and some research priorities are<br />
suggested.<br />
INTRODUCTION<br />
This paper examines emerging issues surrounding implementation of the European<br />
Union (EU) Water Framework Directive (WFD) (CEC, 2000) and the parallel US<br />
concept of Total Maximum Daily Loads (TMDLs).<br />
The WFD is the most significant piece of environmental legislation so far produced<br />
by the EU. The WFD defines a new context and approach for water quality regulation<br />
23
<strong>as</strong>ed on the ‘drainage b<strong>as</strong>in’ in which the member states are required to manage<br />
both point and diffuse sources of pollution to achieve ‘good’ ecological status and<br />
water quality by 2015. The approach represents a radical change from traditional<br />
point-source effluent quality regulation towards ambient water quality control at the<br />
point where the water is used for ecosystem maintenance, water supply, recreation<br />
or fisheries. Whilst correction of poor effluent quality at point source discharges<br />
can be addressed through traditional ‘engineered’ solutions at treatment plants,<br />
maintenance of ambient water quality criteria, or good ecological status, requires<br />
integrated river b<strong>as</strong>in management (IRBM) involving a much wider community of<br />
stakeholders covering industrial dischargers, the farming community and land<br />
managers. Consultation with stakeholders and the wider public is required by the<br />
WFD which presents further challenges for those involved in implementation. Thus,<br />
engineers, social scientists and environmental professionals throughout Europe face<br />
new challenges and opportunities <strong>as</strong> the implications of the new approach become<br />
apparent.<br />
In a recent review of WFD implementation issues in Austria (Achleitner et al., 2005)<br />
defined seven principal requirements that the WFD places on EU member states,<br />
namely:<br />
1. Achievement of good ecological status (and/or potential) in all water bodies within<br />
the EU by 2015 through integrated catchment management with no deterioration<br />
of the current status;<br />
2. Establishment of coordinated river b<strong>as</strong>in management in the EU across borders<br />
for transboundary catchments (e.g. the Danube, Rhine, Elbe, etc.);<br />
3. Development of a full cost recovery system for water supply and w<strong>as</strong>tewater<br />
services which applies the ‘polluter pays’ principle and covers environmental<br />
and resource costs (although there may be a divergence between investments<br />
required by the regulator to treat ‘all flows’ and the charge b<strong>as</strong>ed on ‘actual flows’<br />
to the polluter by the water and sewage undertaker);<br />
4. Formulation of river b<strong>as</strong>in management plans which will be periodically<br />
updated;<br />
5. Integrated point and diffuse source pollution control;<br />
6. Reduction and subsequent elimination of defined priority hazardous<br />
substances;<br />
7. Develop a legally binding ‘programme of me<strong>as</strong>ures’ (PoM) and water quality<br />
and quantity monitoring programmes to underpin management programmes for<br />
control and planning.<br />
The TMDL Approach<br />
Parallel developments in the United States of America are seen in the Federal Water<br />
Pollution Control Act (USEPA, 2002) and the Total Maximum Daily Loads (TMDLs)<br />
concept. This encapsulates very similar principles of public consultation and<br />
catchment-wide management to those in the WFD (USEPA, 2005). Section 303(d)<br />
of the Federal Water Pollution Control Water Act (page 103) requires that States<br />
identify ‘impaired’ water bodies that do not meet defined water quality standards.<br />
24
The TMDL process investigates these water quality problems and designs actions in<br />
consultation with stakeholders to effect remediation (i.e. similar to a WFD ‘programme<br />
of me<strong>as</strong>ures’ outlined below). In defining how much of a pollutant a water body can<br />
tolerate, whilst complying with water quality standards, a TMDL investigation should<br />
quantify all pollutant fluxes to include effluent discharges from w<strong>as</strong>tewater treatment<br />
facilities, diffuse source pollution from agriculture and surface drainage from streets<br />
or highways. Some 59,356 water quality impairments have been reported between<br />
January 1996 and 23 February 2006 and 18,663 TMDLs were approved by USEPA<br />
over the same period. The top five re<strong>as</strong>ons for water quality impairment leading to<br />
an agreed TMDL, accounting for 69% of all TMDLs to date have been: heavy metal<br />
pollution (3,940 TMDLs); microbial pollutants and pathogens (3,630 TMDLs); nutrients<br />
(2,232 TMDLs); sediments and siltation (1,722 TMDLs); and organic enrichment and<br />
low DO (1,274 TMDLs) (USEPA, 2005). Some 4043 TMDLs, for all impairment causes,<br />
were approved by USEPA in fiscal year to 30 September 2005.<br />
Thus, in the United States, where ‘pressure and impacts’ on water resources similar<br />
to the EU are evident, the two principal ‘impairment’ re<strong>as</strong>ons leading to a TMDL are<br />
‘metal’ pollution and ‘pathogens’ (the pathogens themselves are rarely me<strong>as</strong>ured<br />
but are indexed by faecal indicator organisms (FIOs) which are used <strong>as</strong> the main<br />
compliance parameters for recreational and shellfish harvesting waters).<br />
The TMDL procedure defines ‘allocations which specify the amount (or concentration)<br />
of a pollutant that can be discharged to a waterbody such that standards are<br />
attained in both the receiving water body and all downstream waters’ (Anon, 2005a).<br />
This policy driver underpins the need for (i) information on the fluxes of catchmentderived<br />
point and diffuse source microbial loadings and (ii) the likely remediation<br />
efficacy of alternative control me<strong>as</strong>ures applied to the sewerage infra-structure and/<br />
or agricultural diffuse pollution sources (Kay et al., 2005a; Lewis et al., 2005; Kay et<br />
al., 2006; Dickson et al., 2005; Kay et al., 2005b).<br />
A CASE STUDY: TOMALES BAY, CALIFORNIA<br />
The Problem Statement<br />
In Tomales Bay, California, the principal ‘beneficial uses’ are recreation and shellfish<br />
harvesting. The bay h<strong>as</strong> been defined <strong>as</strong> ‘impaired by pathogens’ due to diffuse source<br />
pollution from agriculture and a range of other sources including human effluents,<br />
wildlife, recreational boating, equine sources, urban storm drainage and septic tanks<br />
(Anon, 2004). The ten small sewage treatment works and sewage holding ponds<br />
were not permitted to discharge to the Bay directly, rather, they spread any effluents<br />
onto fields. However, accidental spills were considered an ongoing possibility. This<br />
combined loading had caused a ‘threatened’ cl<strong>as</strong>sification under the State Shellfish<br />
Protection Act and a prohibition on commercial harvesting during rainfall periods by<br />
the California Department of Health Services. In addition, the Bay’s shellfish have<br />
been implicated in an illness outbreak (Anon, 2003).<br />
The Sources<br />
A source analysis suggested that agricultural diffuse pollution produced the principal<br />
FIO loading to the Bay. The TMDL process sought to rectify this through targeted<br />
development of non-point pollution control strategies including on-farm ‘best<br />
25
management practices’ (BMPs) together with an education and outreach programme<br />
driven by a catchment-wide stakeholder participation exercise including shellfishery<br />
and watershed user groups. The principal non-point source control me<strong>as</strong>ures for<br />
FIOs were outlined in a B<strong>as</strong>in Plan amendment of September 2005 (Anon, 2005a).<br />
This identified the three main tributaries for the bay <strong>as</strong> ‘impaired’ producing four<br />
clearly impaired locations, (i) Tomales Bay itself, (ii) Laqunt<strong>as</strong> Creek, (iii) Walker Creek<br />
and (iv) Olema Creek.<br />
Numeric targets<br />
The targets are an interpretation of water quality standards and those set for the Bay<br />
were:<br />
i.
operators, which number approximately 150. The operators may be eligible for state<br />
and federal water quality grants and federal agricultural support grants, although the<br />
extent of grant aid is not specified.<br />
Table 1:<br />
Concentration-b<strong>as</strong>ed pollutant load allocations for dischargers of<br />
pathogens in Tomales Bay watershed<br />
W<strong>as</strong>te load allocation faecal coliform 100 ml -1<br />
Pollutant source For direct discharge to the Bay<br />
For discharge to<br />
tributaries<br />
median 90 th percentile geometric mean<br />
Onsite Sewage<br />
Disposal Systems<br />
0 0 0<br />
Small W<strong>as</strong>tewater<br />
Treatment Facilities<br />
0 0 0<br />
Boat Discharges 0 0 N/A<br />
Grazing land
It is envisaged that these data will allow the quinquennial review process to answer<br />
the following questions (Anon, 2005a):<br />
1. Are the Bay and the tributaries progressing toward TMDL targets <strong>as</strong> expected? If<br />
progress is unclear, how should monitoring efforts be modified to detect trends?<br />
If there h<strong>as</strong> not been adequate progress, how might the implementation actions<br />
or allocations be modified?<br />
2. What are the pollutant loads for the various source categories (including naturally<br />
occurring background pathogen contributions and the contribution from open<br />
space lands), how have these loads changed over time, how do they vary<br />
se<strong>as</strong>onally, and how might source control me<strong>as</strong>ures be modified to improve load<br />
reduction?<br />
3. Is there new, reliable, and widely accepted scientific information that suggests<br />
modifications to targets, allocations, or implementation actions? If so, how<br />
should the TMDL be modified?<br />
4. The allocations <strong>as</strong>sume a conservative bacterial die-off rate of 0.02 per hour.<br />
This value is b<strong>as</strong>ed on rates reported for San Francisco Bay in 1970. If bacterial<br />
die-off is found to be higher, higher allocations may be considered. What are<br />
bacterial die-off rates in the water column and stream sediments? Do they vary<br />
by se<strong>as</strong>on? What are bacteria transport times from sources to the Bay?<br />
5. How does estuarine mixing and dilution of tributary waters vary by flow and<br />
se<strong>as</strong>on?<br />
6. What is the relationship between precipitation, run-off, tributary loads, Bay coliform<br />
levels, and water quality exceedances and shellfish harvesting closures?<br />
7. Are there bacteria in Tomales Bay sediments that enter the water column during<br />
storm events? If yes, how should this process be accounted for?<br />
A b<strong>as</strong>eline faecal coliform tributary and Bay water quality monitoring programme<br />
is also planned from January 2006 with weekly sampling intervals for five weeks,<br />
thence monthly, sampling from March to December. Clearly, this programme would<br />
not be adequate to address the questions above and further investigations would be<br />
required to address the detailed scientific issues implied in these questions.<br />
Parallels with WFD<br />
There are many parallels between TMDLs and WFD ‘programmes of me<strong>as</strong>ures’,<br />
both require significant stakeholder engagement, they operate at the catchment or<br />
drainage b<strong>as</strong>in scale and commence by defining the ‘pressures and impacts (WFD)’<br />
or ‘problem statement’ (TMDL).<br />
The existing TMDL studies are clearly ahead of the implementation of WFD<br />
‘programmes of me<strong>as</strong>ures’ in the area of faecal indicator flux modelling and control<br />
but they do not appear to have, at this early stage, to have developed a set of<br />
operational tools to <strong>as</strong>sist UK authorities with implementation of WFD principles at<br />
‘protected are<strong>as</strong>’ where compliance with FIO standards is to be achieved via WFD<br />
implementation.<br />
28
UK Implementation of FIO Control<br />
The most significant policy challenge presented by the implementation of the WFD is<br />
the quantification and management of diffuse source pollution which derives from the<br />
farming community and urban sources (Defra, 2002; Defra, 2003). Examination of the<br />
available policy instruments for diffuse pollution control have been undertaken in the<br />
United Kingdom by Defra and others (Oxera, 2003; Defra, 2004; Dampney, 2002) and<br />
cost estimates have been published (RPA Consulting, 2003; WRc 1999). Clearly, the<br />
nutrient parameters, such <strong>as</strong> phosphorus and nitrogen, have sewage (point source)<br />
and agricultural (diffuse source) components. In 1999, the Water Research Centre<br />
(WRc) undertook an early scoping study b<strong>as</strong>ed on the Commission’s proposals for a<br />
WFD first published in 1997 (COM 97(49) FINAL) (WRc, 1999). This centred principally<br />
on phosphorus reduction and calculated an additional cost to the farming sector<br />
at the time of £35,000 for each tonne of phosphorus not discharged to receiving<br />
waters, or £175 per ha per year.<br />
Tackling diffuse water pollution from agriculture (DWPA) in England and Wales is<br />
being taken forward through the Catchment-Sensitive Farming (CSF) programme<br />
within Defra. Some £25 million is being spent over the next 2 years on a network<br />
of Catchment-Sensitive Farming Officers (CSFOs) for collective and individual<br />
engagement with farmers in priority catchments where the problems are most acute.<br />
Assessment of priority catchments includes, amongst other parameters, catchments<br />
where failures in bathing water criteria have been recorded due to DWPA. In parallel,<br />
Defra is also working to identify the most cost-effective additional policy options<br />
likely to be required to meet WFD objectives. Options being considered include the<br />
extension of existing Defra policies <strong>as</strong> well <strong>as</strong> the development of new approaches<br />
for tackling DWPA and investigation of the principal DWPA problems (Haygarth,<br />
2005).<br />
Considered overall, the nutrient parameters have received by far the most coordinated<br />
European attention, to date, within both the policy and academic communities with<br />
major EU projects such <strong>as</strong> EUROHARP (Borgvang, 2005) developing a ‘toolkit for<br />
nutrient management and <strong>as</strong>sessments of nutrient mobility in river b<strong>as</strong>in districts<br />
(Neal et al., 2005). In the UK, nutrient pressure ‘risk maps’ for controlled waters<br />
have been produced by the UK Environment Agency using an approach reported<br />
by Heathwaite et al. (2005) The analysis sponsored by Defra and that in Haygarth et<br />
al. (2005) provide a provisional inventory of diffuse pollution losses in England and<br />
Wales. They reinforce this <strong>as</strong>sessment and conclude:<br />
“Nitrogen, because of its sheer volume of usage and early legislative controls (The<br />
Nitrates Directive), is the most researched and understood pollutant. However, its<br />
impact in some regions is now thought to be of less importance than phosphorus,<br />
which controls the productivity of many inland freshwater lakes and waterways.<br />
Sediment and pathogen transfers (sic. i.e. in fact faecal indicators) represent the<br />
‘newer’ challenge for the 21st century.”<br />
and suggest the following forward strategy for Defra:<br />
• Modelling to be at the centre of a future research strategy, but this needs to be<br />
backed up with long term and well co-ordinated platform catchments. Scenario<br />
29
testing (including climate change) to quantify effects of me<strong>as</strong>ures is most costeffectively<br />
done using appropriate policy models. We have identified that these<br />
exist (albeit better for some contaminants than others).<br />
• There is still a need for field/catchment scale experimentation to address some<br />
issues. We suggest that the best way forward is to <strong>as</strong>sess what models are now<br />
capable of achieving in support of programmes of me<strong>as</strong>ures. Where a lack of<br />
knowledge limits progress (e.g. the effectiveness of mechanism of a mitigation<br />
method), then experiments should then be commissioned to provide the data.<br />
• This integrated, multi-pollutant ‘model centric’ approach, that attempts to<br />
integrate all previous models that have previously focussed on individual final<br />
goal of a robust policy model for diffuse pollution.<br />
In terms of the suggested ‘21st Century Challenge’ of microbial modelling to limit<br />
pathogen risk <strong>as</strong> indexed by compliance with the faecal indicator criteria set in relevant<br />
Directives, source apportionment budget studies and some empirical black box<br />
models predicting faecal indicator concentration and flux from land use parameters<br />
have been reported for UK catchments. Most recently, the UKs sentinel catchment<br />
for WFD research, the Ribble catchment w<strong>as</strong> modelled in this manner (Kay et al.,<br />
2005c). Additionally, empirical studies seeking to quantify the remediation potential<br />
of on-farm me<strong>as</strong>ures to reduce diffuse pollution have been completed in Scotland<br />
and reported in Dickson et al. (2005) and Kay et al. (2005d). Other interventions<br />
to reduce faecal indicator flux in UK catchments have been reported in Kay et al.<br />
(2005b) (i.e. flood retention wetlands) and ‘natural treatment systems’ for effluents<br />
including reed beds, a lagoon and integrated constructed wetland (ICWs) (Kay et<br />
al., 2005). One of the most promising interventions reported to date are on-farm<br />
Integrated Constructed Wetlands (ICWs) used in Ireland for treating contaminated<br />
water from farm hardstanding are<strong>as</strong> and roofs (Harrington, 2005). Initial nutrient and<br />
faecal indicator removal efficiencies seem very encouraging and the systems appear<br />
more robust to flow alterations than engineered ‘natural treatment’ systems such <strong>as</strong><br />
reed beds (Kay et al., 2005a). However, regulatory concerns have been expressed<br />
concerning the downward translocation of pollutants to groundwater and these are<br />
the subject of current investigation with EU support in Ireland and the UK.<br />
The conclusions of Haygarth et al. (2005) identify key research requirements of the<br />
policy community. There is a particular need to progress the field of catchment microbial<br />
and sediment modelling. The microbial component h<strong>as</strong> received more international<br />
attention in Canada, Australia, the United States (i.e. via the TMDL approach outlined<br />
above) than to date in the UK and EU <strong>as</strong> part of the WFD implementation. When this<br />
emerging area h<strong>as</strong> a similar science b<strong>as</strong>e to the nutrient parameters, the type of<br />
multi-parameter model needed to inform the policy community should be possible.<br />
There is a need, however, for pan-European coordination. This might be implemented<br />
through amendments to the current remits of the WFD ‘Common Implementation<br />
Strategy’ and, in the UK, through attention to microbial and sediment modelling<br />
needs by the UK Technical Advisory Groups addressing WFD implementation.<br />
Detailed examination of this area will be required if ‘protected are<strong>as</strong>’, such <strong>as</strong><br />
bathing and shellfish harvesting waters, are to be managed effectively through the<br />
implementation of the principles enshrined in the WFD <strong>as</strong> clearly envisaged in early<br />
drafts (CEC, 2002) of the new Bathing Water Directive published in November 2005<br />
(Anon, 2005b).<br />
30
Whilst US regulatory approaches exemplified in the TMDL concept have sought<br />
to set water quality criteria in ‘inputs’ <strong>as</strong> seen in Table 1. There is little evidence<br />
to date that the US studies have progressed to the stage of distributed white box<br />
modelling which could underpin evidence-b<strong>as</strong>ed advice on remediation strategies<br />
to the farming community. Current criteria specified in Table 1 are little more than<br />
‘ambient’ water quality criteria for recreational and shellfish harvesting waters. This<br />
‘precautionary’ approach is understandable but only serves to illustrate the b<strong>as</strong>ic lack<br />
of hard scientific information on catchment microbial dynamics. This suggests that<br />
Haygarth’s (Hagarth et al., 2005) definition of microbial dynamics <strong>as</strong> the 21st Century<br />
Challenge is just <strong>as</strong> appropriate to the agencies and research scientists responsible<br />
for TMDL application <strong>as</strong> it is to those EU colleagues designing programmes of<br />
me<strong>as</strong>ures for WFD implementation.<br />
ACKNOWLEDGEMENTS<br />
Elements of this analysis related the WFD components will be published in the May<br />
2006 edition of the Proceedings of the Chartered Institution of Civil Engineers. We<br />
are grateful for helpful advice from US scientists involved in TMDL investigations<br />
including David J Lewis, Peter Krottje and Farhad Ghodrati. All errors of fact or<br />
interpretation are, however, the authors’ responsibility.<br />
REFERENCES<br />
Achleitner S, De Toffol S, Engelhard C and Rauch W (2005). The European Water<br />
Framework Directive: Water quality cl<strong>as</strong>sification and implications to engineering<br />
planning. Environmental Management 35(4), 517-525.<br />
Anon (2003). Tomales Bay Pathogen Protection Plan. California Regional Water<br />
Quality Control Board, San Francisco Bay Region.<br />
Anon (2004). Pathogens in Tomales Bay Total Maximum Daily Load: Final Project<br />
Report. California Regional Water Quality Control Board, San Francisco Bay<br />
Region.<br />
Anon (2005a). Tomales Bay California, TMDL Report Appendix A. Appendix A<br />
Tentative Resolution With Proposed B<strong>as</strong>in Plan Amendment (Exhibit A). California<br />
Regional Water Quality Control Board San Francisco Bay Region Resolution R2-<br />
2005, San Francisco.<br />
Anon (2005b). Directive of the European Parliament and of the Council concerning the<br />
management of bathing water quality and repealing Directive 76/160/EEC, 2002/2054<br />
(COD) C6-0373/2005. The European Parliament and The Council, Brussels.<br />
Borgvang SA and Bar LJ (2005). The EUROHARP Toolbox - a Tool towards Bridging<br />
the Gap between Scientists and Managers in Policy Instrument Implementation.<br />
http://euroharp.org/showart_open_area.php?art=31<br />
Council of the European Communities (CEC) (2000). Directive 2000/60/EC of the<br />
European Parliament and of the Council of 23 October 2000, establishing a framework<br />
for Community action in the field of water policy. Official Journal of the European<br />
Communities L327, 1-72, 2000.<br />
31
Council of the European Communities (CEC) (2002). Proposal of the European<br />
Parliament and of the Council concerning the quality of bathing waters COM 581<br />
final, 2002, Brussels, 24 October 2002.<br />
Council of the European Communities (CEC) (2004). Amended proposal for a<br />
Directive of the European Parliament and of the Council concerning the management<br />
of bathing water quality. Brussels, 23 June 2004.<br />
Dampney P, M<strong>as</strong>on P, Goodl<strong>as</strong>s G and Hillman J (2002). Methods and me<strong>as</strong>ures to<br />
minimise diffuse pollution form agriculture - a critical appraisal. ADAS, Gleadthorpe.<br />
http://www.defra.gov.uk/environment/water/quality/diffuse/agri/reports/pdf/<br />
dwpa05.pdf<br />
Defra (2002). Directing the flow priorities for future water policy. Department of<br />
Environment, Food and Rural Affairs, HMSO, London.<br />
Defra (2003). Strategic review of diffuse water pollution from agriculture. Discussion<br />
document, Department of Environment, Food and Rural Affairs, London.<br />
http://www.defra.gov.uk/environment/water/quality/diffuse/agri/reports/pdf/<br />
dwpa07.pdf<br />
Defra (2004). Strategic review of diffuse water pollution from agriculture. Initial<br />
appraisal of policy instruments to control water pollution from agriculture. Department<br />
of Environment Food and Rural Affairs, London.<br />
Dickson JW, Edwards AC, Jeffrey B and Kay D (2005). Catchment scale<br />
appraisal of best management practices (BMPs) for the improvement of<br />
bathing water – Brighouse Bay. Edinburgh, SAC Environmental, Auchincruive.<br />
http://www.scotland.gov.uk/Topics/Environment/Water/15561/15068<br />
Harrington R, Dunne EJ, Carroll P, Keohane J and Ryder C (2005). The concept, design<br />
and performance of integrated constructed wetlands for the treatment of farmyard<br />
dirty water, in Nutrient Management in Agricultural Watersheds: A Wetlands Solution.<br />
Eds. EJ Dunne, KR Reddy and OT Carton. Wageningen Academic Publishers: The<br />
Netherlands.<br />
Haygarth P, Granger S, Chadwick D, Shepherd M and Fogg P (2005). A Provisional<br />
Inventory of Diffuse Pollution Losses. ADAS Report for DEFRA, London.<br />
Heathwaite AL, Dils RM, Liu S, Carvalho L, Brazier RE, Pope L, Hughes M, Phillips<br />
G and May L (2005). A tiered risk-b<strong>as</strong>ed approach for predicting diffuse and point<br />
source phosphorus losses in agricultural are<strong>as</strong>. Science of the Total Environment<br />
344(1-3), 225-239.<br />
Kay D, Francis C, Edwards A, Kay C, McDonald A, Lowe N, Stapleton C, Watkins<br />
J and Wyer M (2005a). The efficacy of natural w<strong>as</strong>tewater treatment systems in<br />
removing faecal indicator bacteria. UK Water Industry Research (UKWIR). Report<br />
Number 07/WW/21/5 Water UK, ISBN 1 84057 385 6, London.<br />
Kay D, Wyer MD, Crowther J, Wilkinson J, Stapleton C and Gl<strong>as</strong>s P (2005b).<br />
Sustainable reduction in the flux of microbial compliance parameters to co<strong>as</strong>tal<br />
32
athing waters by a wetland ecosystem produced by a marine flood defence<br />
structure. Water Research 39, 3320-3332.<br />
Kay D, Wyer MD, Crowther J, Stapleton C, Bradford M, McDonald AT, Greaves J,<br />
Francis C, and Watkins J (2005c). Predicting faecal indicator fluxes using digital<br />
land use data in the UK’s sentinel Water Framework Directive catchment: the Ribble<br />
study. Water Research 39, 655-667.<br />
Kay D, Wilkinson J, Crowther J, Reid S, Francis C, Kay C, Hopkins M, Watkins<br />
J, Edwards A, McDonald A, Wyer M and Stapleton C (2005d). Monitoring the<br />
effectiveness of field and steading me<strong>as</strong>ures to reduce diffuse pollution from<br />
agriculture to bathing waters in the Ettrick, Cessnock, Nairn and Sandyhills<br />
catchments. Scottish Executive Report reference: ENV/7/4/04, Edinburgh.<br />
URL http://www.scotland.gov.uk/Topics/Environment/Water/15561/15068<br />
Kay D, Aitken M, Crowther J, Dickson I, Edwards AC, Francis C, Hopkins M, Jeffrey<br />
W, Kay C, McDonald AT, McDonald D, Stapleton CM, Watkins J, Wilkinson J, and<br />
Wyer M (2006). Reducing fluxes of faecal indicator compliance parameters to<br />
bathing waters from diffuse agricultural sources, the Brighouse Bay study, Scotland.<br />
Environmental Pollution (under editorial consideration).<br />
Lewis DJ, Atwill ER, Lennox MS, Hou L, Karle B and Tate KW (2005). Linking onfarm<br />
dairy management practices to storm-flow fecal coliform loading for California<br />
co<strong>as</strong>tal waters. Environmental Monitoring and Assessment 107, 407-425.<br />
Neal C and Heathwaite AL (2005). Nutrient mobility within river b<strong>as</strong>ins: a European<br />
perspective. Journal of Hydrology 304(1-4), 477-490.<br />
Oxera (2003). Policy instruments for the control of pollution of water by diffuse<br />
agricultural sources. Oxford, UK.<br />
RPA Consulting (2003). Water framework directive – indicative costs of agricultural<br />
me<strong>as</strong>ures. Summary Paper, prepared for DEFRA, July, London, UK.<br />
US Environmental Protection Agency (USEPA) (2002). Federal Water Pollution Control<br />
Act [<strong>as</strong> amended through P.L. 107–303, 27 November 27 2002]. USEPA, W<strong>as</strong>hington DC.<br />
URL http://www.epa.gov/r5water/cwa.htm<br />
US Environmental Protection Agency (USEPA) (2005). Total Maximum<br />
daily loads US Environmental Protection Agency. USEPA, W<strong>as</strong>hington DC.<br />
URL http://o<strong>as</strong>pub.epa.gov/waters/national_rept.control<br />
Water Research Centre (WRc) (1999). The Potential Costs and Benefits of<br />
Implementing the Proposed Water Resources Framework Directive. Water Research<br />
Centre, Medmenham, UK.<br />
33
DECREASING THE NITROGEN SOIL SURFACE<br />
SURPLUS IN THE DANUBE RIVER BASIN BY APPLYING<br />
AGRICULTURAL MEASURES: A COMPARISON OF COST-<br />
EFFECTIVENESS RATIOS<br />
L Fröschl, R Pierrard and W Schönbäck<br />
Department of Spatial Development, Infr<strong>as</strong>tructure and Environmental Planning,<br />
Section Public Finance and Infr<strong>as</strong>tructure Policy, Vienna University of Technology,<br />
Resselg<strong>as</strong>se 5/2/2, 1040 Vienna, Austria, E-mail: lena.froeschl@tuwien.ac.at<br />
SUMMARY<br />
Agricultural production is one of the main sources of diffuse nitrogen emissions.<br />
The major issue of the present work is the economic <strong>as</strong>sessment of agricultural<br />
me<strong>as</strong>ures to reduce the nitrogen surplus in agricultural land of selected countries in<br />
the Danube River B<strong>as</strong>in. Hence it aims at the development of a method, b<strong>as</strong>ed on<br />
cost-effectiveness analysis, to <strong>as</strong>sess the potential of ‘best available techniques’–<br />
me<strong>as</strong>ures in agricultural production to reduce the nitrogen surplus in surface soils.<br />
The national nitrogen soil surface balance is used to generate an indicator for the<br />
effectiveness value for me<strong>as</strong>ures. Internal costs considering the induced change<br />
in direct and indirect production costs <strong>as</strong> well <strong>as</strong> the change of gross output are<br />
calculated. Cost-effectiveness ratios are derived and used to rank the different<br />
me<strong>as</strong>ures considered. Although the majority of ecologically favourable me<strong>as</strong>ures<br />
induce costs, ecologically and economically beneficial ones are also identified.<br />
INTRODUCTION<br />
The European research project daNUbs, funded under the 5th framework programme,<br />
aims at the reduction of nutrients flowing via the Danube River into the Black Sea in<br />
order to establish respectively an ecologically good condition in the western Black Sea<br />
area. The daNUbs project is b<strong>as</strong>ed on the common understanding that all countries<br />
in the Danube River Catchment influence the Black Sea ecology and can contribute<br />
to coping with these problems. The Danube River Catchment area comprises 13<br />
countries: Germany, Austria, Czech Republic, Slovak Republic, Hungary, Slovenia,<br />
Croatia, Bosnia and Herzegovina, Serbia and Montenegro, Romania, Bulgaria,<br />
Moldova and Ukraine, either totally or partly. At present the nitrogen load flowing into<br />
the Black Sea, originating in the Danube River Catchment, amounts to 386,816 t N<br />
per year (81% from anthropogenic sources, from which 46% points originate from<br />
agricultural production). The most important diffuse nutrient source considered here<br />
is nitrogen, originating from agricultural production processes. However, the states<br />
of nitrogen emissions from agricultural production vary widely in the countries.<br />
In the daNUbs project, it is <strong>as</strong>sumed that me<strong>as</strong>ures to reduce the contribution<br />
from agricultural production to the nitrogen load flowing into the Black Sea will be<br />
implemented by the year 2015. A general ‘High Production Scenario (HP 2015)’ w<strong>as</strong><br />
defined, in which the agricultural production levels of Austria and Germany were<br />
<strong>as</strong>sumed to stay constant by 2015. The agricultural production of the other countries<br />
forming the Danube River Catchment area were <strong>as</strong>sumed to regain the level of 1990<br />
by 2015 because their agricultural production will p<strong>as</strong>s an intensification and reach<br />
34
western productivity standards. Consequently, in scenario HP 2015 the nitrogen<br />
loads from agriculture in all of the countries forming the Danube River Catchment will<br />
incre<strong>as</strong>e by 29% on average, compared with the level of 2000. Using the HP 2015<br />
scenario <strong>as</strong> a reference, the impact of implementing Best Available Techniques (BAT)<br />
in agricultural production, in particular me<strong>as</strong>ures to minimise nitrogen emissions<br />
from agricultural production, were studied.<br />
The main objective of the authors’ contributions to the daNUbs project (IFIP, 2005)<br />
w<strong>as</strong> the development of a suitable <strong>as</strong>sessment methodology for the nitrogen load<br />
flowing into the Black Sea. The present paper summarises the first step in this<br />
work, which consists of the methodology <strong>as</strong> well <strong>as</strong> their exemplarily use to <strong>as</strong>sess<br />
the agricultural nitrogen surplus on the soil level. The method is b<strong>as</strong>ed on costeffectiveness<br />
analysis and uses the OECD nutrient balance calculation scheme<br />
(OECD, 2001) to <strong>as</strong>sess the effects of the me<strong>as</strong>ures considered to reduce nitrogen<br />
emissions from agricultural production.<br />
COST-EFFECTIVENESS ANALYSIS<br />
The work presented here considers nine of the 13 countries mentioned. For Croatia,<br />
Bosnia/Herzegovina, Serbia/Montenegro and Moldova, no reliable agricultural<br />
production data were available and consequentially no nitrogen soil surface balance<br />
could be calculated. However, the nine countries considered form 78% of the Danube<br />
River B<strong>as</strong>in. The shares of the area of the countries forming part of the Danube River<br />
b<strong>as</strong>in are: Germany 16%, Austria 96%, Slovenia 81%, Czech Rep. 28%, Hungary<br />
100%, Slovak Rep. 96%, Bulgaria 50%, Romania 93% and Ukraine 6%.<br />
First, in cost-effectiveness analysis, the annual average internal costs of a me<strong>as</strong>ure,<br />
for utilised agricultural area (UAA) where it is applied, have to be identified. Second,<br />
the effect of a me<strong>as</strong>ure in terms of changed nitrogen surplus in the surface soil h<strong>as</strong> to<br />
be calculated. Finally the cost-effectiveness ratios in terms of annual cost occurring<br />
per annually avoided unit of nitrogen surplus in the surface soil can be calculated for<br />
the me<strong>as</strong>ures considered.<br />
The long-term internal costs of a me<strong>as</strong>ure consist of the difference in direct<br />
production costs, indirect production costs and change of gross output of the<br />
agricultural producer, induced by the me<strong>as</strong>ure. Costs of an activity are me<strong>as</strong>ured<br />
by what h<strong>as</strong> to be given up in terms of real resources for what is currently being<br />
done, by implementing a me<strong>as</strong>ure corresponding to the opportunity cost concept<br />
(Schleiniger, 1999). The analysis of costs is b<strong>as</strong>ed on the price level in 2002/03.<br />
In addition, it is <strong>as</strong>sumed that the real price level in Central and E<strong>as</strong>tern European<br />
countries (CEEC) incre<strong>as</strong>es by 2% annually up to 2015 compared with Austria and<br />
Germany (IFIP, 2005). In the present work, governmental costs (such <strong>as</strong> subsidies)<br />
are not taken into consideration.<br />
To calculate the effects of selected me<strong>as</strong>ures their impacts on the soil surface are<br />
determined by calculating the national nitrogen soil surface balance before and<br />
after carrying out the me<strong>as</strong>ure. This calculation is done according to the OECDcalculation<br />
scheme (OECD, 2001). The nitrogen soil surface balance is calculated<br />
<strong>as</strong> the difference between the total quantity of nitrogen inputs entering the soil and<br />
the total quantity of nitrogen outputs leaving the soil annually, a positive balance is<br />
called surplus.<br />
35
Table 1:<br />
Overview of the me<strong>as</strong>ures considered to be realised in the Danube<br />
River Catchment Countries and their share of implementation<br />
M1<br />
M2<br />
M3<br />
M4<br />
Objective of<br />
me<strong>as</strong>ure<br />
Accurate<br />
application of<br />
fertilisers regarding<br />
amount and time<br />
related application<br />
rates<br />
Reduction of<br />
nitrogen emissions<br />
from manure<br />
Incre<strong>as</strong>e of plant<br />
productivity<br />
by applying<br />
capital intensive<br />
production<br />
techniques<br />
Reduction of direct<br />
nitrogen emissions<br />
to the hydrosphere<br />
Quantitative<br />
Objective<br />
Reduction of<br />
mineral fertilisers<br />
use by 10%<br />
Reduction<br />
of ammonia<br />
emissions from<br />
manure by 25%<br />
Incre<strong>as</strong>e in plant<br />
productivity<br />
Austria, Germany:<br />
+10%<br />
CEEC: +20%<br />
Reduction of<br />
erosion by 75 %<br />
and surface run-off<br />
by 20%<br />
Best available<br />
technique<br />
(1) Timely<br />
application rates<br />
(2) Chemical soil<br />
analysis<br />
(3) Soil surface<br />
balance on field<br />
level<br />
(4) Ban on<br />
application of<br />
fertilisers<br />
during winter<br />
(1) Use of hose<br />
spreader<br />
(2) Accurate<br />
manure storage<br />
capacity<br />
(3) Accurate straw<br />
bedding in animal<br />
housing<br />
(1) Demandoriented<br />
irrigation<br />
(2) Demandoriented<br />
plant<br />
protection<br />
(3) Improvement of<br />
plant nutrition<br />
(1) Minimum soil<br />
tillage<br />
(2) Zero tillage<br />
(3) Mulch seeding<br />
(4) Cover crops<br />
Share of UAA where<br />
M is applied<br />
Austria, Germany:<br />
30%<br />
CEEC: 10%<br />
100% in all countries<br />
Austria, Germany:<br />
15%<br />
CEEC: 30%<br />
20%<br />
3%<br />
10%<br />
50%<br />
in all<br />
countries<br />
36
Figure 1: Methodical scheme<br />
For the calculations of production data, fertiliser input, nitrogen emission coefficients<br />
for livestock and rates of nitrogen fixation by crops were taken from the FAOSTAT<br />
(2004) datab<strong>as</strong>es <strong>as</strong> well <strong>as</strong> national statistics and adjusted to the scenarios. To<br />
calculate the nitrogen balances, after carrying out a specific me<strong>as</strong>ure, the induced<br />
changes in production and fertiliser input of this me<strong>as</strong>ure were estimated. The<br />
difference in the nitrogen surplus before and after carrying out the me<strong>as</strong>ure represents<br />
the effect in cost-effectiveness analysis.<br />
RESULTS OF THE COST-EFFECTIVENESS ANALYSIS<br />
Using the method described above, the costs of the me<strong>as</strong>ures specified <strong>as</strong> well<br />
<strong>as</strong> their effects on the nitrogen soil surface surplus (see Table 2) were calculated.<br />
Subsequently, cost-effectiveness ratios for each of the me<strong>as</strong>ures regarding the<br />
nitrogen soil surface surplus (see Table 2) were determined.<br />
37
Table 2:<br />
Costs (C), effects (E) and cost-effectiveness ratio (CER) of me<strong>as</strong>ures<br />
regarding the nitrogen soil surface surplus in million Euro per year,<br />
1.000 tons per year and 5/kg in 2015<br />
CER<br />
Germany 2,97<br />
Austria 8,43<br />
Czech<br />
Republic<br />
Slovak<br />
Republic<br />
0,71<br />
1,02<br />
Hungary 0,87<br />
Slovenia 1,38<br />
Romania 1,01<br />
Bulgaria 0,56<br />
Ukraine 1,28<br />
M1 M2 M3 M4 Bundle<br />
C<br />
E<br />
24,5<br />
8,3<br />
30,1<br />
3,6<br />
0,9<br />
1,3<br />
1,6<br />
1,6<br />
5,9<br />
6,7<br />
0,4<br />
0,3<br />
6,6<br />
6,5<br />
1,7<br />
3,0<br />
0,7<br />
0,6<br />
CER<br />
19,91<br />
24,21<br />
14,83<br />
12,62<br />
12,57<br />
27,69<br />
10,68<br />
9,69<br />
5,47<br />
C<br />
E<br />
268,5<br />
13,5<br />
291,6<br />
12,0<br />
65,4<br />
4,4<br />
98,0<br />
7,8<br />
217,7<br />
17,3<br />
42,6<br />
1,5<br />
364,7<br />
34,2<br />
68,9<br />
7,1<br />
31,0<br />
5,7<br />
CER<br />
–3,39<br />
–4,78<br />
–1,01<br />
–2,07<br />
–0,77<br />
–3,27<br />
0,36<br />
0,51<br />
3,68<br />
C<br />
E<br />
-93,4<br />
27,6<br />
-57,0<br />
11,9<br />
-13,5<br />
13,4<br />
-50,0<br />
24,1<br />
-78,0<br />
101.2<br />
-9,9<br />
3,0<br />
35,5<br />
98,2<br />
22,9<br />
44,9<br />
30,7<br />
8,4<br />
CER<br />
3,21<br />
5,32<br />
0,53<br />
0,50<br />
0,59<br />
1,67<br />
–0,39<br />
–0,11<br />
–1,23<br />
C<br />
E<br />
94,8<br />
29,5<br />
99,5<br />
18,7<br />
6,8<br />
12,9<br />
8,7<br />
17,4<br />
35,0<br />
59,5<br />
6,6<br />
4,0<br />
-31,6<br />
81,1<br />
-2,9<br />
25,7<br />
-10,9<br />
8,8<br />
CER<br />
3,73<br />
7,88<br />
1,87<br />
1,14<br />
0,98<br />
4,49<br />
1,71<br />
1,12<br />
2,20<br />
C<br />
E<br />
294,4<br />
78,8<br />
364,3<br />
46,3<br />
59,8<br />
32,0<br />
58,3<br />
50,9<br />
180,6<br />
184,7<br />
39,7<br />
8,9<br />
375,2<br />
220,0<br />
Notes: M1, accurate application of fertilisers regarding amount and time-related<br />
application rates; M2, Reduction in nitrogen emissions from manure; M3, incre<strong>as</strong>e of plant<br />
productivity by applying capital intensive production techniques; M4, reduction in direct<br />
nitrogen emissions to the hydrosphere<br />
Costs<br />
90,5<br />
80,7<br />
51,5<br />
23,4<br />
The internal costs accruing to the agricultural producer when carrying out a me<strong>as</strong>ure<br />
differ strongly depend on the area on which it is applied (considering only those<br />
are<strong>as</strong> being part of the Danube River B<strong>as</strong>in), on the structure of production regarding<br />
the kinds of agricultural products <strong>as</strong> well <strong>as</strong> on the cost levels in the countries<br />
examined. Both, me<strong>as</strong>ures imposing additional costs to the agricultural producers<br />
and me<strong>as</strong>ures incre<strong>as</strong>ing net profits, are identified. Me<strong>as</strong>ure M3 is commercially<br />
profitable in Germany, Austria, Czech Republic, Slovak Republic, Hungary and<br />
Slovenia. However, in Romania, Bulgaria and Ukraine this me<strong>as</strong>ure imposes costs<br />
and thus decre<strong>as</strong>es net profits, because the cost-level for machinery which is<br />
involved in applying the me<strong>as</strong>ure is high in comparison to the general cost-level. On<br />
the contrary, the labour intense me<strong>as</strong>ure M4 is profitable in Romania, Bulgaria and<br />
Ukraine because of labour costs being low, while its implementation imposes costs<br />
to the agricultural producers in the remaining countries analysed.<br />
38
Effects of the Me<strong>as</strong>ures<br />
If all the me<strong>as</strong>ures are put into effect, the nitrogen surpluses are on average cut by<br />
a third compared with scenario HP 2015, the highest reduction compared with the<br />
initial level of the nitrogen surplus is achieved in the Ukraine ( 46 %), the lowest<br />
in the Czech Republic ( 23 %). The absolute reductions achieved are by far the<br />
highest in Hungary and Romania, primarily because of the size of the area on which<br />
the me<strong>as</strong>ures are applied. In these two countries together, the nitrogen surplus is<br />
reduced by more than 400.000 tons, which is 56 % of the total reduction achieved.<br />
Cost-effectiveness Ratios<br />
The b<strong>as</strong>ic variables are the costs of me<strong>as</strong>ures on the one hand and the effects of<br />
me<strong>as</strong>ures regarding the difference of the nitrogen soil surface surplus on the other<br />
hand: from these, the cost-effectiveness ratios of single me<strong>as</strong>ures were calculated.<br />
From the viewpoint of cost-effectiveness, the most satisfactory me<strong>as</strong>ures are ones<br />
that are commercially profitable and at the same time beneficial to the environment,<br />
like M3 in all the EU member states <strong>as</strong> well <strong>as</strong> M4 in Romania, Bulgaria and Ukraine.<br />
Because of the high investment necessary, the highest cost-effectiveness ratios<br />
have been calculated for M2 in all of the countries examined, hence being the le<strong>as</strong>t<br />
preferable me<strong>as</strong>ure. If all of the me<strong>as</strong>ures considered are carried out simultaneously,<br />
the overall cost-effectiveness ratios will be positive in each of the countries. The<br />
highest cost-effectiveness ratios occur in Austria, Germany and Slovenia and the<br />
lowest in Hungary. Hence they are, <strong>as</strong> a whole, economically a burden for the<br />
agricultural producers.<br />
Ranking of Me<strong>as</strong>ures B<strong>as</strong>ed on Cost-effectiveness Ratios<br />
Figure 2 shows the costs and the effects of the me<strong>as</strong>ures. The ranking of the me<strong>as</strong>ures<br />
according to their CER reflects that profitable me<strong>as</strong>ures shall be implemented first.<br />
The costs of implementing all the me<strong>as</strong>ures considered in the different countries<br />
show a large difference regarding the expected effects. In many of the countries, a<br />
significant effect may be obtained by profitable me<strong>as</strong>ures, e.g. in Romania 80% of<br />
the reduction of nitrogen surplus may be achieved in a profitable way. Although the<br />
long-term profitability of specific me<strong>as</strong>ures is shown, high investment costs may<br />
prevent their implementation.<br />
39
Figure 2: Combination of ‘best available techniques’ – me<strong>as</strong>ures for the<br />
different countries (ranking according to CER in brackets)<br />
ACKNOWLEDGEMENTS<br />
The daNUbs project, being the b<strong>as</strong>is for this research, w<strong>as</strong> funded by the European<br />
Commission. In particular, the authors would like to thank Dipl.-Ing. Franz Sinabell,<br />
Austrian Institute of Economic Research (WIFO) <strong>as</strong> well <strong>as</strong> Dipl.-Ing. Zdenek Luk<strong>as</strong><br />
and Dr. Josef Pöschl, The Vienna Institute for International Economic Studies (WIIW)<br />
for their support. Furthermore the authors would like to thank Dr. Horst Behrendt,<br />
Leibniz-Institute of Freshwater Ecology and Inland Fisheries (IGB) for providing<br />
agricultural production data and Dr. Erika Quendler for her expertise regarding<br />
agricultural cost analysis.<br />
REFERENCES<br />
IFIP (2005). Consideration of socio-economic <strong>as</strong>pects and selection of most<br />
promising solutions for future management strategies. Final Report of Deliverable<br />
9.1, 9.2 and 9.3 of the daNUbs project. URL http\\danubs.tuwien.ac.at<br />
OECD (2001). OECD national soil surface nitrogen balances, explanatory notes.<br />
OECD secretariat. URL http://www.oecd.org/dataoecd/0/11/1916652.pdf<br />
Schleininger, R. (1999). Comprehensive cost-effectiveness analysis of me<strong>as</strong>ures to<br />
reduce nitrogen emissions in Switzerland. Ecological Economics 30, 147–159.<br />
40
HIGH RESOLUTION PHOSPHORUS TRANSFERS IN<br />
RURAL CATCHMENTS: THE HIDDEN IMPORTANCE OF<br />
RURAL POINT SOURCES<br />
P Jordan 1 , J Arnscheidt 1 , S McCormick 1 and C Ward 2<br />
1<br />
School of Environmental Sciences, University of Ulster, Coleraine, BT52 1SA, UK,<br />
E-mail: p.jordan@ulster.ac.uk; 2 Blackwater Regional Partnership, The Courthouse,<br />
Caledon, BT68 4TZ, UK<br />
SUMMARY<br />
Monitoring nutrient transfers from land to freshwater is generally limited to labour<br />
intensive discrete and/or automatic sampling regimes and, when estimating m<strong>as</strong>s<br />
fluxes, some form of interpolation to fill gaps in the data series. Short-term patterns<br />
may be missed completely and storm events inappropriately sampled. Here we<br />
present a high-resolution dat<strong>as</strong>et of total phosphorus (TP) concentrations in a stream<br />
draining a 5-km 2 agricultural catchment in Northern Ireland. The TP data are collected<br />
on-site every 10 min using homogenisation, digestion and colorimetric ph<strong>as</strong>es in<br />
continuous flow instrumentation. Concurrently, rainfall and stream discharge data<br />
are collected at 5 and 15 min, respectively. The data from this new technology<br />
indicate that TP depletion curves initiate prior to storm peaks. A period of b<strong>as</strong>eflow<br />
also indicates the importance of rural point sources that maintain the stream in a<br />
eutrophic state between storm events.<br />
INTRODUCTION<br />
The Blackwater River drains approximately 1,480 km 2 of predominantly gr<strong>as</strong>sland<br />
agriculture in the wider Lough Neagh b<strong>as</strong>in (4,500 km 2 ) and the catchment straddles<br />
the Irish border region where the topography is dominated by drumlins and interdrumlin<br />
swales. Previous research in this area h<strong>as</strong> shown that diffuse and point<br />
source phosphorus (P) transfers from Blackwater sub-catchments combine to deliver<br />
an annual load of approximately 2 to 3 kg TP/ha/yr (Jordan et al., 2005a). In smaller<br />
sub-catchments, diffuse, storm-dependent P transfers also combine with chronic P<br />
transfers during non-storm periods even though there is an absence of major point<br />
sources. These chronic transfers are a minor proportion of the total annual load<br />
delivered to Lough Neagh in any year but do, however, maintain streams and larger<br />
tributaries in a eutrophic state between storms. This is particularly important during<br />
the summer when warmer temperatures promote eutrophic impacts in the river<br />
channel. In the current study, a 5-km 2 agricultural sub-catchment w<strong>as</strong> monitored<br />
with a new in-stream TP analyser to investigate the patterns of both acute and<br />
chronic P transfer. The 10 min resolution of this analyser transcends all previous<br />
catchment-b<strong>as</strong>ed P monitoring that is either, at le<strong>as</strong>t, time-b<strong>as</strong>ed grab sampling<br />
or, at most, grab sampling augmented with some form of flow-b<strong>as</strong>ed automatic<br />
water sampling during storm events (Kronvang and Iversen, 2002). Either method<br />
is labour intensive, and does not adequately sample the dynamics of P transfers<br />
over extended time periods. Stone et al. (2000) and Scholefield et al. (2005), for<br />
example, have demonstrated the importance of sampling both acute and chronic P<br />
transfers to investigate both storm and non-storm P transfer dynamics, respectively.<br />
The methods employed could not, however, be used to sample extensively over all<br />
flow ranges and for extended periods.<br />
41
MATERIALS AND METHODS<br />
At the 5-km 2 catchment outlet, a Dr Lange Sigmatax and Phosphax suite of<br />
instrumentation w<strong>as</strong> installed to extract and analyse a water sample for TP on a<br />
10-min cycle. The Sigmatax extracts a sample from the stream water column using<br />
positive air pressure and pumps into a 100-mL homogenisation chamber. This ultr<strong>as</strong>ound<br />
homogenisation cycle is included to break up larger organic particles prior<br />
to digestion. A 10-mL aliquot is delivered to a digestion chamber where the sample<br />
is reduced by boiling using the sulphuric acid–persulphate method. Phosphorus is<br />
determined photometrically using the molybdate antimony–<strong>as</strong>corbic acid method<br />
and conforms to DIN EN 38405 D11. Data are stored by internal and external<br />
dataloggers and downloaded by telemetry. A weekly cleaning cycle is performed to<br />
ensure that intake tubing is free from detritus. Reagents are changed every 3 months.<br />
Concurrent with the TP monitoring, stream discharge and rainfall data are collected<br />
by a Starflow depth–velocity recorder on a 15-min cycle, and an ARG100 tipping<br />
bucket rain gauge set to me<strong>as</strong>ure events on a 5-min cycle, respectively. In this paper,<br />
all data are averaged to a 1-h resolution for comparison.<br />
RESULTS<br />
Results are presented for April to October 2005 and incorporate several large storm<br />
events and periods of b<strong>as</strong>eflow (Figure 1). Three TP transfer ‘event-types’ were<br />
observed during this period. First, large TP transfers were coincident with storm<br />
discharges, although lower TP peaks were observed with succeeding storms and<br />
TP depletion during storm events occurred prior to discharge peaks. This indicates<br />
periods of P flushing where build-up from, for example, channel attenuation occurs<br />
during smaller events. This acute diffuse transfer is likely to be from a combination<br />
of soil P and channel sediment P sources. Second, <strong>as</strong> b<strong>as</strong>eflow established over the<br />
summer period, non-storm TP transfers became greater, indicating a concentration<br />
effect of one or more chronic point sources. Furthermore, during periods of zero<br />
rainfall, these chronic TP transfers had a diurnal pattern with a recovery between<br />
23:00 and approximately 11:00 hours each day followed by a rapid incre<strong>as</strong>e that w<strong>as</strong><br />
sustained for the rest of the day (Jordan et al., 2005b). The third ‘event-type’ w<strong>as</strong><br />
characterised by sudden TP incre<strong>as</strong>es that did not correspond with similar incre<strong>as</strong>es<br />
in stream discharge. These events were attributed to discrete pollution episodes<br />
unrelated to storm diffuse or chronic point sources.<br />
DISCUSSION<br />
The identification of three TP transfer ‘event-types’ in an agricultural mini-catchment<br />
w<strong>as</strong> only possible by implementing a high resolution, time-b<strong>as</strong>ed sampling regime, in<br />
this c<strong>as</strong>e using a bank-side automated analyser. Even with the data limited to a single<br />
summer, the results have important implications for monitoring and management<br />
of freshwater eutrophication in rural rivers. The diffuse, storm dependent transfers<br />
accounted for most of the TP load transferred from this gr<strong>as</strong>sland catchment. The<br />
chronic and discrete TP transfers that were independent of stream discharges did,<br />
however, present an ongoing eutrophication impact and maintained the stream<br />
system in the hypertrophic range for the summer of 2005. This is a pattern observed<br />
in many Northern Ireland rivers. In the absence of w<strong>as</strong>te-water treatment works<br />
and other industrial point sources, it will be important to define and mitigate these<br />
42
sources. They are most likely to be a combination of single dwelling septic tanks<br />
and farmyard infr<strong>as</strong>tructure and the impact will be reach specific depending on<br />
agricultural intensity and rural population density.<br />
Figure 1: Hourly rainfall, discharge and TP concentration time-series from<br />
April to October 2005 in a 5-km 2 agricultural mini-catchment<br />
CONCLUSIONS<br />
Routine monitoring of eutrophic streams on a weekly to monthly b<strong>as</strong>is may largely<br />
sample non-diffuse P transfers. In some agricultural catchments, where diffuse<br />
sources are <strong>as</strong>sumed to transfer most of the annual P load, monitoring on such a<br />
coarse resolution will not adequately <strong>as</strong>sess the effects of managing P loss from soils<br />
after mitigation me<strong>as</strong>ures and are more likely to continue me<strong>as</strong>uring the impacts<br />
from rural point sources.<br />
ACKNOWLEDGEMENTS<br />
We acknowledge support from SEUPB (INTERREG IIIa 020204) and NERC (NER/H/<br />
S/1999/00164) for personnel and infr<strong>as</strong>tructure funding.<br />
43
REFERENCES<br />
Jordan P, Menary W, Daly K, Kiely G, Morgan G, Byrne P and Moles R (2005a).<br />
Patterns and processes of phosphorus transfer from Irish gr<strong>as</strong>sland soils to rivers<br />
– integration of laboratory and catchment studies. Journal of Hydrology 304, 20–34.<br />
Jordan P, Arnscheidt J, McGrogan H and McCormick S (2005b). High-resolution<br />
phosphorus transfers at the catchment scale: the hidden importance of non-storm<br />
transfers. Hydrology and Earth Systems Science 9, 685-691.<br />
Kronvang B and Iverson HL (2002). Danish experience on sampling strategy and<br />
estimation method when calculating phosphorus transport in streams, In: B<br />
Kronvang (ed.) Diffuse Phosphorus Losses at the Catchment Scale, Cost Action 832<br />
– Quantifying the Agricultural Contribution to Eutrophication, pp. 21–26. ALTERRA,<br />
Wageningen.<br />
Scholefield D, Le Goff T, Baven J, Ebdon L, Long T and Butler M (2005). Concerted<br />
diurnal patterns in riverine nutrient concentrations and physical conditions. Science<br />
of the Total Environment 344, 201–210.<br />
Stone KC, Hunt PG, Novak, JM, Johnson MH and Watts DW (2000). Flow-proportional,<br />
time-composited, and grab sample estimation of nitrogen export from an e<strong>as</strong>tern<br />
Co<strong>as</strong>tal Plain watershed. Transactions of the ASAE 43, 281–290.<br />
44
AN INITIAL ASSESSMENT OF THE SUITABILITY OF<br />
TOTAL MAXIMUM DAILY LOADS (TMDLs) AS A MEANS<br />
OF MANAGING DIFFUSE POLLUTION UNDER THE<br />
WATER FRAMEWORK DIRECTIVE<br />
RJ Cooper 1 , RC Ferrier 1 , RD Harmel 2 , SJ Langan 1 , AJA Vinten 1 and MI Stutter 1<br />
1<br />
The Macaulay Institute, Craigiebuckler, Aberdeen, AB15 8QH, UK, E-mail: r.cooper@<br />
macaulay.ac.uk; 2 USDA-ARS, 808 E. Blackland Road, Temple, Tex<strong>as</strong>, 76502, USA<br />
SUMMARY<br />
In the United States, the control of diffuse pollution is addressed by the Total<br />
Maximum Daily Loads programme. In this paper, we <strong>as</strong>sess whether this programme<br />
is suitable for use under the Water Framework Directive, and identify two key issues<br />
concerning the setting of water quality standards and uncertainty.<br />
INTRODUCTION<br />
The Water Framework Directive (WFD) raises a number of challenges for water<br />
quality regulation in the UK, one of which concerns the identification, quantification<br />
and control of diffuse pollution inputs to water bodies. With the initial diffuse<br />
pollution characterisation and impacts analysis now complete, and the monitoring<br />
programmes about to be implemented, attention must now turn to the setting of<br />
environmental objectives and the design and implementation of programmes of<br />
me<strong>as</strong>ures (POMs) to control diffuse pollution inputs. While the WFD provides a<br />
b<strong>as</strong>is for the development of legislation in this respect, an appropriate regulatory<br />
framework h<strong>as</strong> yet to be established. In the United States (US), the control of diffuse<br />
pollution is addressed by the Total Maximum Daily Loads (TMDL) programme, which<br />
provides a framework within which linkages between diffuse pollution sources and<br />
impacts are <strong>as</strong>sessed, and permissible loads accordingly defined. The purpose of<br />
this paper is to introduce the TMDL concept, demonstrate its application using the<br />
Tarland Burn in NE Scotland <strong>as</strong> a c<strong>as</strong>e study, and discuss its suitability <strong>as</strong> a means<br />
of managing water quality under the WFD.<br />
THE TMDL CONCEPT<br />
Over the p<strong>as</strong>t 30 years, water quality management in the US h<strong>as</strong> focussed mainly<br />
on the control of point source pollution, via effluent-b<strong>as</strong>ed water quality standards<br />
established under the Clean Water Act (CWA). Although this h<strong>as</strong> resulted in a general<br />
improvement in water quality, in 2000 over 36 % of water bodies still did not meet<br />
the CWA goal of being ‘fishable, swimmable’, due to inputs of pollutants such <strong>as</strong><br />
nutrients and sediment from diffuse sources such <strong>as</strong> agriculture and urban runoff<br />
(Boyd, 2000). Consequently, there h<strong>as</strong> been a recent shift in the focus of water<br />
quality management from effluent-b<strong>as</strong>ed to ambient–b<strong>as</strong>ed water quality standards.<br />
This is the context within which the Environmental Protection Agency (EPA) is<br />
obligated to implement the TMDL programme, the objective of which is attainment<br />
of ambient water quality standards through the control of both point source and<br />
diffuse pollution.<br />
45
Although the TMDL programme originated in the 1970s, it w<strong>as</strong> largely overlooked<br />
until the early 1990s, when the EPA w<strong>as</strong> forced to develop guidance in response<br />
to incre<strong>as</strong>ing litigation concerning the status of many water bodies. Under new<br />
regulations issued by the EPA in 1992, all states and tribes were t<strong>as</strong>ked with<br />
<strong>as</strong>sessing the condition of their water bodies every two years, establishing priorities<br />
for pollutant load reductions and implementing improvements. As a result, over<br />
21,000 water bodies have since been identified <strong>as</strong> being impaired, which will<br />
necessitate the development of more than 40,000 TMDLs over the next 10–15 years.<br />
To address this problem, the EPA published proposed changes to the TMDL rules in<br />
1999, which were intended to strengthen the programme’s ability to achieve clean<br />
water goals, by offering clearer guidance, new tools and improved stakeholder<br />
engagement via knowledge transfer. However, while the proposed rules were seen<br />
by some <strong>as</strong> a welcome step towards a more holistic approach to managing water<br />
quality, it w<strong>as</strong> also clear that they would significantly alter the politics, economics and<br />
implementation of water quality regulation. As a result, the proposed rules attracted<br />
significant criticism, particularly in terms of the timetable for implementation and<br />
the adequacy of the science underpinning the control of diffuse pollution. The new<br />
rules were finally approved in 2000, but Congress delayed their implementation,<br />
and the EPA h<strong>as</strong> since withdrawn them, stating that their implementation would be<br />
untenable. For now, the 1992 regulations remain in effect.<br />
Under the 1992 regulations, all states and tribes must <strong>as</strong>sess the condition of their<br />
water bodies in relation to numeric and narrative water quality standards set for<br />
designated uses (e.g. aquatic life protection, drinking water supply, recreation).<br />
It is recognised that such standards may not always be met, due to background<br />
variability and me<strong>as</strong>urement errors, and <strong>as</strong> a result a 10% violation rate is allowed<br />
(up to 10 % of samples collected may exceed set standards). However, in instances<br />
where the violation rate exceeds 10%, the affected water body must be cl<strong>as</strong>sed <strong>as</strong><br />
impaired, and a TMDL developed for the pollutant causing the impairment (EPA,<br />
1999). The first step in the process of TMDL development is the identification of the<br />
key factors and background information that describe the nature of the impairment<br />
and the context for the TMDL. The second step is the identification of numeric or<br />
me<strong>as</strong>urable indicators and target values that can be used to evaluate attainment of<br />
water quality standards in the impaired water body. Often the TMDL target will be<br />
the numeric standard for the pollutant of concern, but in some c<strong>as</strong>es TMDLs must<br />
be developed for parameters that do not have numeric standards. In these situations<br />
impairment is determined using narrative standards or identifiable impairment of<br />
designated uses (e.g. no fish), which are then interpreted to develop quantifiable<br />
target values to me<strong>as</strong>ure attainment or maintenance of the desired level of water<br />
quality.<br />
The third step in the process is a source <strong>as</strong>sessment, in which the sources of<br />
pollutant loading to the impaired water body are identified and characterised by type,<br />
magnitude and location. In the fourth step of the process, a linkage must be defined<br />
between the selected indicator(s) or target(s) and the identified sources. This linkage<br />
establishes the cause and effect relationship between the pollutant of concern<br />
and the pollutant sources, and enables the total loading capacity to be estimated.<br />
Acceptable pollutant loadings that will not exceed the total loading capacity and will<br />
lead to attainment of the desired level of water quality are then calculated in step<br />
46
five. These loadings are distributed among the significant sources of the pollutant<br />
of concern, with w<strong>as</strong>teload allocations containing the allowable loadings from point<br />
sources, and load allocations containing the allowable loadings from diffuse sources.<br />
A margin of safety is identified at this stage to take account of uncertainty in the<br />
analysis, although this is often arbitrarily determined rather than rigorously quantified.<br />
The margin of safety may be applied implicitly, using conservative <strong>as</strong>sumptions, or<br />
explicitly, by setting <strong>as</strong>ide a portion of the total loading capacity. Finally, in step six<br />
an implementation and monitoring plan is devised to oversee changes on the ground<br />
and determine whether the TMDL h<strong>as</strong> resulted in attaining the desired level of water<br />
quality. A conceptual overview of how the TMDL framework could be integrated with<br />
river b<strong>as</strong>in management planning under the WFD is presented in Figure 1.<br />
Figure 1: Conceptual overview of how water quality could be managed under<br />
the Water Framework Directive using the Total Maximum Daily<br />
Loads framework (in grey) <strong>as</strong> a means of regulation<br />
CASE STUDY: TARLAND BURN<br />
Introduction<br />
The Tarland Burn is a tributary of the River Dee in NE Scotland, and drains an area of<br />
intensive mixed land use. Agriculture in the lower zone of the catchment comprises a<br />
mosaic of arable fields and improved gr<strong>as</strong>sland, supporting cattle, sheep, barley and<br />
potato. The headwaters of the catchment feature steeper slopes comprising rough<br />
47
gr<strong>as</strong>sland and heather moorland, supporting widespread plantation forestry. The<br />
village of Tarland h<strong>as</strong> a population of 520, and is served by a w<strong>as</strong>te water treatment<br />
plant (WWTP) situated on the main stem of the burn. The remainder of the population is<br />
rural, with on-site sewerage in the form of septic tanks. Under the recently completed<br />
characterisation and impacts analysis, the Tarland Burn w<strong>as</strong> cl<strong>as</strong>sified <strong>as</strong> being at<br />
significant risk (1a) of not achieving good status by 2015, due to diffuse pollution<br />
and morphological pressures. A significant amount of research on diffuse pollution<br />
impacts and best management practices (BMPs) h<strong>as</strong> been conducted within the<br />
catchment over the p<strong>as</strong>t 5 years, making it an ideal study site for an <strong>as</strong>sessment of<br />
the suitability of TMDLs <strong>as</strong> a means of managing diffuse pollution.<br />
Data Acquisition<br />
During the 353-day period from the 3rd of July 2004 to the 20th of June 2005,<br />
intensive stream monitoring w<strong>as</strong> conducted on the main stem of the burn at Coull<br />
Bridge. It should be noted that this location is several kilometres upstream of the<br />
true catchment outflow, meaning that only 72% (51.6 km 2 ) of the true catchment<br />
area (71.6 km 2 ) w<strong>as</strong> monitored. Stage w<strong>as</strong> me<strong>as</strong>ured continuously using an SR50<br />
sonic stage sensor, and logged on a CR10X datalogger. The record of stage w<strong>as</strong><br />
subsequently converted into a time series of discharge using a rating relationship<br />
derived from discrete me<strong>as</strong>urements of discharge over the full range of flows (n = 10,<br />
r 2 > 0.99). The burn w<strong>as</strong> sampled on a daily b<strong>as</strong>is using an automatic pump sampler.<br />
Additional samples were acquired on a four hourly b<strong>as</strong>is whenever flows exceeded<br />
Q10 (2.756 m 3 s- 1 , 1999-2002). All samples were stored in the sampler until collection,<br />
and returned to the laboratory for analysis on a weekly b<strong>as</strong>is. Total phosphorus<br />
(TP) concentrations were then determined colorimetrically (Skaler SAN++) on the<br />
unfiltered samples after persulphate digestion. For days when only a single sample<br />
w<strong>as</strong> collected, the daily TP flux w<strong>as</strong> calculated by multiplying the total daily water<br />
flux by the sample concentration. On days when flows exceeded Q10, the daily TP<br />
flux w<strong>as</strong> calculated by summing fluxes determined for each four hourly period (in turn<br />
determined by multiplying the four hourly water flux by the corresponding sample<br />
concentration).<br />
TMDL Development<br />
As new physico-chemical standards for use under the WFD have yet to be<br />
published, we opted to use a target concentration value for TP of 0.05 mg/L, which<br />
is recommended by the EPA <strong>as</strong> an indicative value of impairment in many rivers and<br />
streams in the US (EPA, 1999). Over 24% of samples collected during the period of<br />
monitoring had TP concentrations in excess of this standard; under EPA guidelines<br />
this would necessitate the development of a TMDL (EPA, 1999). The total water flux<br />
recorded in the period of monitoring (2.27 x 10⁷ m 3 ) w<strong>as</strong> then multiplied by the<br />
target concentration value for TP (0.05 mg/L) to give the target loading capacity for<br />
TP (1135 kg). This value w<strong>as</strong> then divided by the number of days in the period of<br />
monitoring (353) to give a TMDL of 3.2 kg (presented against actual daily fluxes of<br />
TP in Figure 2). The target loading capacity for TP w<strong>as</strong> then compared with the actual<br />
flux of TP recorded during the period of monitoring (1428 kg), in order to determine<br />
the amount by which the actual flux of TP must be reduced in order to meet the<br />
target concentration value for TP (= 293 kg).<br />
48
Figure 2: Time series of total daily phosphorus loads at Coull Bridge during<br />
the period of monitoring and the TMDL for TP b<strong>as</strong>ed on a target<br />
concentration value of 0.05 mg/L<br />
The major sources of P in the catchment were then identified and their respective<br />
contributions to the actual flux of TP recorded during the period of monitoring<br />
determined using GIS-b<strong>as</strong>ed tools (Ferrier et al., 2004). These tools enable human<br />
population density data from the 2001 census to be used in conjunction with userentered<br />
per-capita rates for specified pollutants to estimate annual pollutant fluxes<br />
from w<strong>as</strong>te water treatment plants (WWTPs) and septic tanks. The estimated annual<br />
P loadings from these sources in the Tarland catchment were adjusted for the length<br />
of the monitoring period and then subtracted from the actual flux of TP recorded<br />
during the period of monitoring to give an estimate of P loading from diffuse sources<br />
(Figure 3). Relationships between loadings of P from major sources in the catchment<br />
and violations of the target concentration value of TP were then examined in order<br />
to determine acceptable load allocations to meet the desired level of water quality.<br />
Analysis of the field data revealed that the export of P during the period of monitoring<br />
w<strong>as</strong> positively correlated with discharge (r = 0.47, P =
Given that the rele<strong>as</strong>e of P from the WWTP and septic tanks would have been<br />
relatively consistent during the period of monitoring, we concluded that loadings<br />
from diffuse sources were probably responsible for the majority of violations of the<br />
target concentration value for TP. We therefore set w<strong>as</strong>teload allocations for the<br />
WWTP and septic tanks at the estimated values for the period of monitoring, and<br />
set the load allocation for diffuse sources <strong>as</strong> the estimated value for the period of<br />
monitoring minus the amount by which the actual flux of TP must be reduced in<br />
order to meet the target concentration value for TP. In order to allow for a margin<br />
of safety in our load allocation budget, we derived mean probable errors for best<br />
and worse c<strong>as</strong>e data acquisition scenarios using results published in the literature<br />
(Figures 4 and 5). Sources of error in load calculations may be grouped into four<br />
main categories, namely errors <strong>as</strong>sociated with the me<strong>as</strong>urement of flow, errors<br />
<strong>as</strong>sociated with sample collection, errors <strong>as</strong>sociated with sample storage and errors<br />
<strong>as</strong>sociated with laboratory analysis. Further sources of error also arise when using<br />
process-b<strong>as</strong>ed models and GIS tools to estimate source loadings, but these have<br />
yet to be satisfactorily quantified. Therefore, the error ranges presented should be<br />
viewed <strong>as</strong> minimum estimates.<br />
Figure 4: Time series of best c<strong>as</strong>e uncertainty (± 17 %) in daily phosphorus<br />
loads at Coull Bridge during the period of monitoring. At this level<br />
of uncertainty, a 49% reduction in diffuse P loading is required to<br />
achieve the target concentration value of 0.05 mg/L for TP<br />
50
Figure 5: Time series of worst c<strong>as</strong>e uncertainty (± 67 %) in daily phosphorus<br />
loads at Coull Bridge during the period of monitoring. At this level<br />
of uncertainty a 79% reduction in diffuse P loading is required to<br />
achieve the target concentration value of 0.05 mg/L for TP<br />
After recalculating the required reduction in diffuse P loading under the best and worst<br />
c<strong>as</strong>e error scenarios, we finally calculated the cost of implementing best management<br />
practices (BMPs) to meet the desired level of water quality. A number of BMPs have<br />
been shown to be effective at reducing P losses from agricultural land, particularly<br />
when used <strong>as</strong> part of a treatment train (Vinten et al., 2005). However, for simplicity,<br />
we opted to consider only a single control me<strong>as</strong>ure, namely the installation of buffer<br />
strips. Removal efficiencies of between 50 - 80 % for TP have been reported in the<br />
literature for properly sized and managed buffer strips (Novotny and Olem, 1994).<br />
Under the best c<strong>as</strong>e error scenario, we opted to install 6-m wide buffer strips along<br />
29.3 km of streams lying within the zone of arable fields and improved gr<strong>as</strong>sland<br />
using Land Management Contracts Menu Scheme (LMCMS) rates for buffer strip<br />
creation and management (£200 per ha), at a total cost of £35,160 over 5 years.<br />
However, in order to meet the desired level of water quantity under the worst c<strong>as</strong>e<br />
error scenario, we opted to install 20 m wide buffer along the same stream length<br />
using Rural Stewardship Scheme (RSS) rates for fencing (£3 per m) and the creation<br />
and management of species-rich gr<strong>as</strong>sland (£250 per ha), at a total cost of £322,300<br />
over 5 years.<br />
DISCUSSION<br />
The TMDL programme forms the backbone of the EPA’s current watershed level<br />
approach to water quality regulation, and is in many ways similar to the framework<br />
established for river b<strong>as</strong>in management planning under the WFD. One important<br />
difference arises when considering the establishment of environmental objectives,<br />
and that is that the WFD requires all water bodies to achieve both good ecological<br />
and chemical status, where<strong>as</strong> the TMDL programme requires only the latter. However,<br />
providing that indicators of ecological status are me<strong>as</strong>urable using numeric targets,<br />
then there is no re<strong>as</strong>on why the TMDL process could not be implemented under<br />
the WFD. Indeed, we believe that the TMDL process offers a robust framework<br />
for controlling both point source and diffuse pollution, <strong>as</strong> it integrates the variable<br />
effects of flow and targets both acute and chronic impacts. Moreover, it also shifts<br />
the focus of water quality regulation away from symptoms of impairment and on<br />
51
to the underlying causes, and thus provides a more holistic approach to managing<br />
water quality at the catchment scale. The c<strong>as</strong>e study presented above highlights<br />
two are<strong>as</strong> of critical importance to the success or otherwise of the TMDL process.<br />
The first area concerns the setting of the environmental standard; where do we<br />
draw the line? If we had used a target concentration value of 0.03 mg/L for TP<br />
instead of the guideline value recommended by the EPA, the required reduction<br />
in diffuse P loading would have been 79%, even before the effects of uncertainty<br />
were considered (adding in the effects of uncertainty under the worst c<strong>as</strong>e scenario<br />
would have required the complete eradication of diffuse P loading, and even then the<br />
desired level of water quality would not have been met). The second area concerns<br />
the level of uncertainty itself; who pays for this? It is not unre<strong>as</strong>onable to <strong>as</strong>sume that<br />
the worst c<strong>as</strong>e scenario presented here is probably typical of spatially distributed,<br />
investment-limited monitoring programmes. The cost of regulation under the worst<br />
c<strong>as</strong>e scenario is an order of magnitude greater than under the best c<strong>as</strong>e scenario,<br />
and the difference should not be cl<strong>as</strong>sed <strong>as</strong> an agricultural externality. Rather, the<br />
cost of additional uncertainty should be considered in its own right, and perhaps<br />
targeted ahead of remediation actions in order to make regulation more cost effective<br />
in the long term.<br />
REFERENCES<br />
Boyd J (2000). The new face of the Clean Water Act: a critical review of the EPA’s<br />
proposed TMDL rules. In: Resources for the Future, Discussion Paper 00-12,<br />
W<strong>as</strong>hington DC, 35 pp.<br />
EPA (1999). Protocol for developing nutrient TMDLs. EPA 841-B-99-007. Office of<br />
Water (4503F), US EPA, W<strong>as</strong>hington DC, 135 pp.<br />
Ferrier RC, Boorman D, DeGroote J, Elston D, Hutchins M, Jenkins A and Potts J<br />
(2004). Sustainable management of waters in Scotland: achieving good ecological<br />
status. SEERAD Flexible Fund Report, MLU/765/01.<br />
Novotny V and Olem H. (1994). Water Quality: Prevention, identification and<br />
management of diffuse pollution. Van Nostrand Reinhold, New York, 1054 pp.<br />
Vinten AJA, Towers W, King JA, McCracken DI, Crawford C, Cole LJ, Duncan A, Sym<br />
G, Aitken M, Avdic K, Lilly A, Langan S and Jones M (2005). Appraisal of rural BMP’s<br />
for controlling diffuse pollution and enhancing biodiversity. SNIFFER Report, Project<br />
WFD13.<br />
52
A STATEWIDE APPROACH TO IDENTIFYING,<br />
QUANTIFYING AND MITIGATING DIFFUSE POLLUTION-<br />
RELATED PROBLEMS<br />
BM Evans<br />
Pennsylvania State University, University Park, PA 16801, USA,<br />
E-mail: bme1@psu.edu<br />
SUMMARY<br />
The State of Pennsylvania h<strong>as</strong> implemented a number of strategies and programs<br />
to mitigate surface water quality problems throughout the state. To address these<br />
problems, the state h<strong>as</strong> developed an integrated approach to identify and quantify<br />
water quality problems using rapid bio-<strong>as</strong>sessment and simulation modeling<br />
protocols, respectively. In the latter c<strong>as</strong>e, watershed and/or ‘in-stream’ computer<br />
models are used to estimate loads <strong>as</strong> part of ‘total maximum daily load’ <strong>as</strong>sessments<br />
required by the Clean Water Act. The results of such <strong>as</strong>sessments are used to<br />
prioritize are<strong>as</strong> for future restoration activities. These restoration activities, which are<br />
normally co-ordinated by local watershed groups, are funded by the State’s ‘Growing<br />
Greener’ programme that combines money from both federal and state sources.<br />
INTRODUCTION<br />
Under Section 303(d) of the Clean Water Act, all states within the United States<br />
are required to conduct Total Maximum Daily Load (TMDL) <strong>as</strong>sessments for all<br />
water bodies within their jurisdiction that are not attaining water quality standards<br />
for their designated use. To address this requirement, the Pennsylvania Department<br />
of Environmental Protection (PaDEP) h<strong>as</strong> developed a multi-tiered approach to<br />
identifying, quantifying and rectifying water quality problems within the state. This<br />
paper describes PaDEP’s integrated approach to addressing those problems<br />
primarily related to diffuse or non-point source pollution impacts on streams.<br />
This integrated approach incorporates the following components: (1) identification<br />
of water quality impacts via the use of <strong>as</strong>sorted protocols, (2) inclusion of identified<br />
problem are<strong>as</strong> on a statewide ‘impaired waters’ list, (3) quantification of specific<br />
pollutant loads via the use of in-stream water quality data or simulation modelling,<br />
(4) development and implementation of mitigation plans, (5) evaluation of results<br />
through future <strong>as</strong>sessment activities, and (6) development and implementation of<br />
new mitigation strategies <strong>as</strong> needed.<br />
PROBLEM IDENTIFICATION<br />
PaDEP’s <strong>as</strong>sessment and listing methodology constitutes the ‘decision rules’ that<br />
the Department uses when <strong>as</strong>sessing the quality of waters and identifying water<br />
bodies that do not meet designated and existing uses. The primary ‘uses’ for water<br />
bodies include aquatic life use, human health use and recreational use. Problems<br />
<strong>as</strong>sociated with impacts to aquatic life use are identified primarily through stream<br />
biological community <strong>as</strong>sessments. The Department identifies impacts to human<br />
health using fish tissue analyses and evaluations of raw (intake) water monitored by<br />
water purveyors. Recreational use impairments are identified using bacteriological<br />
data.<br />
53
All water body use attainment information is organized by State Water Plan Subb<strong>as</strong>in,<br />
PaDEP five-digit stream code, and a segment identifier which identifies multiple<br />
unique stream segments within each five-digit stream code (see Figure 1). PaDEP’s<br />
five-digit stream code system is b<strong>as</strong>ed on surface waters that appear on United<br />
States Geological Survey, 1:24,000-scale, 7.5-Minute Quadrangle Maps. Streams<br />
are segmented at the confluence of tributaries, and each segment is identified by the<br />
PaDEP five-digit stream code and upstream and downstream river miles (distance<br />
above the mouth of the stream).<br />
Figure 1: Mapping protocol for organizing stream <strong>as</strong>sessment data<br />
54
State water quality standards <strong>as</strong>sign designated beneficial uses to waters, and the<br />
PaDEP <strong>as</strong>sesses waterways to determine if uses are being attained. A variety of<br />
physical, chemical, and biological water quality and habitat indicators are me<strong>as</strong>ured,<br />
and this information is used to decide if water uses are attained. The water quality<br />
indicators used by Pennsylvania for making use attainment decisions are interpreted<br />
within the context of the standards, including designated uses, narrative or numeric<br />
criteria, and anti-degradation policies. Other factors that influence the state’s<br />
selection of indicators include: sampling effort, the cost of collecting and analysing<br />
samples, the variability of the indicator in the environment, the level of precision<br />
desired by decision makers, and the sampling frequency required to meet data<br />
quality objectives. In reality, the bulk of the problems identified for future mitigation<br />
activities are a result of rapid bio-<strong>as</strong>sessment stream surveys.<br />
Aquatic life use data are used to <strong>as</strong>sess the ability of Pennsylvania’s water bodies<br />
to maintain and/or propagate fish species and additional flora and fauna that are<br />
indigenous to state aquatic habitats. Aquatic life use attainment surveys of the<br />
state’s wade able streams and rivers (systems that do not exceed one meter in<br />
depth or one meter/second velocity) are conducted through the DEP’s Statewide<br />
Surface Waters Assessment Program (SSWAP). This SSWAP involves a statewide<br />
<strong>as</strong>sessment of habitat and biological (benthic macroinvertebrate) indicators that are<br />
used to me<strong>as</strong>ure the ability of surface waters to support expected aquatic life uses.<br />
Human health use attainment surveys of Pennsylvania’s surface waters are conducted<br />
through the Pennsylvania Fish Tissue Sampling and Fish Advisories Programme. The<br />
purpose of this multi-agency programme is to sample for toxins potentially harmful<br />
to humans. Target species usually consist of water body-specific, recreationally<br />
important species that are commonly taken by anglers for consumption. Fish tissue<br />
samples are generally collected during periods of low flow between August and<br />
October when reproduction is complete and a full summer of exposure to potential<br />
toxins h<strong>as</strong> occurred.<br />
Currently, this programme includes a mixture of risk <strong>as</strong>sessment-b<strong>as</strong>ed methods<br />
and U.S. Food and Drug Administration (FDA) Action Levels that are used <strong>as</strong> the<br />
b<strong>as</strong>is for issuing or lifting advisories. Risk <strong>as</strong>sessment methods form the b<strong>as</strong>is for<br />
meal-specific advisories due to PCBs and mercury. Advisories for other compounds<br />
use FDA Action levels to issue ‘Do Not Eat’ advice. Once advisories are issued,<br />
the affected stream segments are put on the State’s ‘impaired water body list’.<br />
Additional Human Health use attainment evaluations, which may result in subsequent<br />
‘listing’, are conducted through the review of raw (intake) water quality <strong>as</strong> described<br />
through self-monitoring efforts of drinking water facilities. Physical, chemical, or<br />
bacteriological quality over extended periods of time is compared to potable water<br />
supply criteria outlined in Pennsylvania’s Water Quality Standards regulations to<br />
determine use attainment status.<br />
Recreational use attainment decisions for Pennsylvania’s surface waters are made<br />
using bacteriological indicator data collected by government agencies (including the<br />
PaDEP, the Pennsylvania Department of Health, and the United States Geological<br />
Survey) and citizen/volunteer groups. Faecal coliform bacteria are used <strong>as</strong> indicators<br />
of possible sewage contamination because they are commonly found in human and<br />
animal feces. Although faecal coliforms are generally not harmful themselves, they<br />
55
indicate the possible presence of pathogenic (dise<strong>as</strong>e causing) bacteria, viruses<br />
and protozoa that also live in human and animal digestive systems. Therefore, their<br />
presence in a water body suggests that pathogenic microorganisms may be present<br />
<strong>as</strong> well, and that water contact recreation such <strong>as</strong> swimming may be a health risk.<br />
Important recreational are<strong>as</strong> and aquatic life use impaired water bodies with obvious<br />
potential sources of bacteria (e.g. municipal point sources, combined sewer overflows,<br />
and agricultural sources relating to manure application, livestock grazing, and animal<br />
feeding) are targeted for bacteriological sampling. Sampling is conducted during<br />
the swimming se<strong>as</strong>on (May 1 through to September 30) and consists of at le<strong>as</strong>t two<br />
sampling groups collected per site per se<strong>as</strong>on.<br />
B<strong>as</strong>ed on the use of various me<strong>as</strong>ures, the water quality status of Pennsylvania’s<br />
waters is summarized using a five-part categorization of waters according to their<br />
use attainment status. Each five-digit water body segment (<strong>as</strong> shown in Figure 1)<br />
is placed into one of these categories. Different segments of the same stream may<br />
appear on more than one list if the attainment status changes <strong>as</strong> the water flows<br />
downstream. The listing categories are <strong>as</strong> follows:<br />
Category 1: Waters attaining all designated uses.<br />
Category 2: Waters where some, but not all, designated uses are met. Attainment<br />
status of the remaining designated uses is unknown because data are insufficient to<br />
categorize a water consistent with the state’s listing methodology.<br />
Category 3: Waters for which there are insufficient or no data and information to<br />
determine, consistent with the State’s listing methodology, if designated uses are<br />
met.<br />
Category 4: Waters impaired for one or more designated uses but not needing<br />
a TMDL because a TMDL h<strong>as</strong> been completed, use attainment is expected to<br />
occur within a short time frame (within 3 years), or the impairment is not due to a<br />
pollutant.<br />
Category 5: Waters impaired for one or more designated uses by any pollutant.<br />
LISTING OF IMPAIRED WATERS<br />
The results of all <strong>as</strong>sessments completed within the state are reported on a publiclyavailable<br />
‘Integrated List’ (www.depweb.state.pa.us/dep/cwp/view.<strong>as</strong>p?a=3&q=461<br />
149&depNav=|).<br />
On this site, streams can be displayed on top of topographic maps and queried via<br />
the use of an interactive datab<strong>as</strong>e. Among other things, streams can be queried <strong>as</strong><br />
to the re<strong>as</strong>on for their being given an ‘impaired’ (i.e. Category 5) listing. Such re<strong>as</strong>ons<br />
are described in terms of the ‘source’ (e.g. municipal point source, agriculture, urban<br />
run-off, surface mining, etc.) and ‘cause’ (e.g. nutrients, siltation, organic enrichment/<br />
low DO, etc.) <strong>as</strong>signments given to each impaired stream segment.<br />
Waters included under Category 5 essentially constitute the Section 303(d) list (i.e.<br />
‘impaired waters list’) that the U.S. EPA will approve or disapprove under the Clean<br />
Water Act. Where more than one pollutant is causing the impairment, the water<br />
56
emains in Category 5 until all pollutants are addressed in a completed/EPA-approved<br />
TMDL, or until the water is ‘de-listed’ via other approved administrative means.<br />
QUANTIFICATION OF PROBLEM<br />
Water bodies identified on the State’s 303(d) list <strong>as</strong> being impaired require the<br />
completion of a TMDL <strong>as</strong>sessment. Such <strong>as</strong>sessments can be done for individual<br />
impaired stream segments. More typically, however, such <strong>as</strong>sessments are done on<br />
a watershed or sub-watershed b<strong>as</strong>is, with the <strong>as</strong>sessed are<strong>as</strong> ranging in size from<br />
about 2–200 square kilometres. Development of a TMDL implies development of a<br />
report with specific mandated elements. At a minimum, this report must describe<br />
the water quality problem and identify allowable pollutant loads to the water body<br />
from both point and non-point sources that would prevent a violation of water quality<br />
standards in the future. This latter requirement dictates that some means be used to<br />
quantify pollutant loads in a watershed for which a TMDL is being prepared. Given<br />
the general lack of sufficient in-stream water quality data, many states in the United<br />
States have decided to use computer simulation models to derive the necessary load<br />
estimates. In Pennsylvania, a GIS-b<strong>as</strong>ed modelling approach h<strong>as</strong> been developed<br />
to support TMDL <strong>as</strong>sessments in watersheds where nutrients and/or sediments have<br />
been determined to be the primary cause(s) of stream impairment. This approach<br />
involves the use of AVGWLF, a calibrated modeling tool that facilitates the use of<br />
the Generalized Watershed Loading Function (GWLF) model (Haith and Shoemaker,<br />
1987) and customized statewide dat<strong>as</strong>ets and model parameterization routines<br />
within an ArcView GIS software interface.<br />
The general approach used for non-point source TMDLs in Pennsylvania is to: (1)<br />
derive GWLF input data for use in the impaired watershed; (2) simulate nutrient and/<br />
or sediment loads within the impaired watershed; (3) compare simulated loads within<br />
the impaired watershed against loads simulated for a nearby ‘reference’ watershed<br />
that exhibits similar landscape, development and agricultural patterns, but that also<br />
h<strong>as</strong> been deemed to be unimpaired; and (4) identify and evaluate pollution mitigation<br />
strategies that could be applied in the impaired watershed to achieve pollutant loads<br />
similar to those calculated for the reference watershed.<br />
With AVGWLF, a customized interface developed by Penn State for the ArcView GIS<br />
package is used to parameterize input data for the GWLF model (Evans et al., 2002).<br />
In utilizing this interface, the required GIS files are loaded automatically, and various<br />
tools are provided to create and select watersheds for simulation purposes. Once<br />
the selected watershed is identified (see Figure 2), the user is prompted to specify the<br />
desired file location for model output and to supply other information related to “nonspatial”<br />
model parameters (e.g. beginning and end of the growing se<strong>as</strong>on; and the<br />
months during which manure is spread on agricultural land). Critical terrain and other<br />
watershed data are extracted b<strong>as</strong>ed on the watershed boundary and subsequently<br />
used to automatically derive values for required model input parameters that are<br />
then written to the transport.dat and nutrient.dat input files needed to execute the<br />
GWLF model. Also accessed through the interface is a statewide weather datab<strong>as</strong>e<br />
that contains 25 years of temperature and precipitation data for 78 weather stations<br />
across Pennsylvania. This datab<strong>as</strong>e is used to create the necessary weather.dat<br />
input file for a given watershed simulation. Subsequent to input file creation, the<br />
GWLF model is executed directly within the GIS interface. An example of some of<br />
the loading output generated by the model is shown in Figure 3.<br />
57
DEVELOPMENT AND IMPLEMENTATION OF MITIGATION PLANS<br />
As part of the TMDL report, some description of potential strategies for mitigating<br />
water quality problems in the watershed must be provided. However, little detail is<br />
required at this stage since more in-depth analyses are usually undertaken <strong>as</strong> part of<br />
‘watershed restoration’ activities subsequent to TMDL development. In Pennsylvania,<br />
the completion of a TMDL typically triggers the rele<strong>as</strong>e of state funds from the State’s<br />
‘Growing Greener’ programme to develop and implement a restoration plan. This<br />
particular programme is the largest environmental investment in modern Pennsylvania<br />
history, and represents a dramatic restructuring of state spending policy to address<br />
critical environmental concerns. To date, the Growing Greener programme h<strong>as</strong><br />
provided nearly $650 million to protect watersheds, preserve farmland open space,<br />
invest in parks and outdoor recreation, reclaim abandoned mines and wells, and<br />
make improvements to the state’s water and sewer infr<strong>as</strong>tructure. This programme<br />
h<strong>as</strong> distributed grants to local governments, watershed groups and others for the<br />
protection of Pennsylvania’s water resources, including the management of nonpoint<br />
sources of pollution.<br />
Figure 2: GIS interface<br />
58
Figure 3: Example loading output from the model<br />
One of the first activities typically completed during the restoration planning and<br />
implementation process is a more thorough evaluation of potential mitigation<br />
strategies. One tool that many groups in Pennsylvania use to support this activity<br />
is a software programme that operates in tandem with AVGWLF. More specifically,<br />
nutrient and sediment loadings derived via the use of AVGWLF can be used <strong>as</strong><br />
input in a companion software tool called PRedICT (Pollution Reduction Impact<br />
Comparison Tool). This tool allows the user to create various ‘scenarios’ in which<br />
current landscape conditions and pollutant loads (both point and non-point) can<br />
be compared against ‘future’ conditions that reflect the use of different pollution<br />
reduction strategies (best management practices) such <strong>as</strong> agricultural and urban<br />
BMPs, stream protection activities, and upgrading of w<strong>as</strong>tewater treatment systems.<br />
It includes pollutant reduction coefficients for nitrogen, phosphorus and sediment,<br />
and also h<strong>as</strong> built-in cost information for an <strong>as</strong>sortment of pollution mitigation<br />
techniques. The user specifies desired conditions in terms of such things <strong>as</strong> acres<br />
of agricultural BMPs used, number of septic systems to be converted to centralized<br />
w<strong>as</strong>tewater treatment, types of plant upgrades, percentage of urban are<strong>as</strong> to be<br />
treated by wetlands and detention b<strong>as</strong>ins, etc. Built-in reduction coefficients and unit<br />
costs are then utilized to calculate resultant nutrient and sediment load reductions<br />
and scenario costs.<br />
Figure 4 illustrates the type of output that can be obtained for a given watershed via<br />
the use of AVGWLF and PRedICT. Shown in this figure are ‘existing’ and ‘future’<br />
loads calculated on the b<strong>as</strong>is of a suite of proposed pollution mitigation strategies.<br />
Calculations of pollutant load reductions and <strong>as</strong>sociated costs within PRedICT are<br />
accomplished via a series of data handling algorithms and mathematical expressions<br />
written in Visual B<strong>as</strong>ic. The general approach used in most c<strong>as</strong>es is to calculate load<br />
reductions for each pollutant b<strong>as</strong>ed on the number of additional ‘units’ (e.g. acres,<br />
stream miles, per capita septic system conversions, etc.) for which the particular<br />
59
BMP is being implemented and the appropriate pollutant reduction coefficients and<br />
unit costs specific to that BMP. These additional ‘units’ are b<strong>as</strong>ed on the difference<br />
between ‘existing’ and ‘future’ values (e.g. acres, stream miles) specified by the user<br />
for each BMP or pollutant reduction strategy. More specific information on the usage<br />
of PRedICT is provided in Evans (2003).<br />
POST-RESTORATION EVALUATION<br />
After restoration activities have been implemented in a watershed, the success of<br />
such activities is evaluated on the b<strong>as</strong>is of in-stream surveys conducted to verify<br />
if the health of the stream h<strong>as</strong> improved. If no improvements are noted, additional<br />
funds are provided by the State to implement more or better corrective me<strong>as</strong>ures in<br />
the watershed until the desired results are achieved. This is an iterative process that<br />
may take many years to complete in significantly degraded watersheds. However,<br />
this approach is predicated on the belief that moving towards a corrective solution is<br />
better than not moving at all.<br />
To date, few restoration projects funded through the Growing Greener programme<br />
have been in place long enough to warrant re-examination of affected streams.<br />
However, limited data from some fixed water quality monitoring stations maintained<br />
by PaDEP that are located at the mouth of watersheds where mitigation me<strong>as</strong>ures<br />
have been taken suggests that improvements in stream health are beginning to<br />
occur. Within the next 2–5 years, PaDEP plans to begin the process of re-surveying<br />
Pennsylvania’s streams to evaluate the effectiveness of mitigation me<strong>as</strong>ures that<br />
have been implemented over the p<strong>as</strong>t few years.<br />
Figure 4: Example of predicted load reductions via combined use of AVGWLF<br />
and PRedICT<br />
60
REFERENCES<br />
Evans BM, Lehning DW, Corradini KJ, Petersen GW, Nizeyimana E, Hamlett JM,<br />
Robillard PD and Day RL (2002). A comprehensive GIS-b<strong>as</strong>ed modeling approach<br />
for predicting nutrient loads in watersheds. Journal of Spatial Hydrology 2, (www.<br />
spatialhydrology.com).<br />
Evans BM (2003). A generic tool for evaluating the utility of selected pollution<br />
mitigation strategies within a watershed. In: Proceedings of the 7th International<br />
Conference on Diffuse Pollution and <strong>as</strong> in Management, Dublin, Ireland, Vol. 2 of 4,<br />
pp. 10.7–10.12, Centre for Water Resources Research, University College Dublin,<br />
Dublin, Ireland.<br />
Haith DA and Shoemaker LL (1987). Generalized watershed loading functions for<br />
stream flow nutrients. Water Resources Bulletin 23, 471–478.<br />
61
THE USE OF PONDS TO REDUCE POLLUTION FROM<br />
POTENTIALLY CONTAMINATED STEADING RUN-OFF<br />
KV Heal 1 , AJA Vinten 2 , F Gouriveau 1 , J Zhang 1 , M Windsor 1 , B D’Arcy 3 , A Frost 4 ,<br />
L Gairns 5 and SJ Langan 2<br />
1<br />
The University of Edinburgh, School of GeoSciences, Crew Building, West Mains<br />
Road, Edinburgh, EH9 3JN, UK, E-mail: k.heal@ed.ac.uk; 2<br />
The Macaulay Institute,<br />
Craigiebuckler, Aberdeen, AB15 8QH, UK; 3 SEPA, 7 Whitefriars Crescent, Perth, PH2<br />
0PA, UK; 4 Soil and Water Scotland, 4 Bayswell Road, Dunbar, EH42 1AB, UK; 5 SEPA,<br />
Heriot Watt Research Park, Avenue North, Riccarton, Edinburgh, EH14 4AP, UK<br />
SUMMARY<br />
Ponds/wetlands are being incre<strong>as</strong>ingly encouraged <strong>as</strong> a tool for reducing diffuse<br />
pollution from farm steadings in Scotland to comply with the EC Water Framework<br />
Directive. However, guidance on their design and maintenance is limited and<br />
their effectiveness for different farm types in Scotland is not known. Results from<br />
continuous flow and water quality monitoring (May–July 2005) of a mature onstream<br />
pond/wetland, constructed on a dairy farm prior to current best practice guidelines,<br />
and from vegetation and macroinvertebrate surveys of this and two other farm ponds/<br />
wetlands highlight some <strong>as</strong>pects to be considered in monitoring the performance of<br />
these systems. Future work will focus on testing and improving design guidance<br />
by systematically monitoring and modelling flow, water quality, habitat and factors<br />
affecting performance and maintenance in representative farm ponds/wetlands,<br />
including new systems constructed with funding from the Scottish Executive and<br />
SEPA’s Diffuse Pollution and Habitat Enhancement Initiatives.<br />
INTRODUCTION<br />
The EC Water Framework Directive (WFD) (EC, 2000) requires the introduction of<br />
co-ordinated programmes of me<strong>as</strong>ures to achieve good ecological status in surface<br />
waters. The control of diffuse, land-b<strong>as</strong>ed sources of pollution to these waters is of<br />
incre<strong>as</strong>ing concern to regulatory agencies seeking to implement the Directive. In<br />
Scotland, nutrients [nitrogen (N) and phosphorus (P)], suspended solids (SS) and<br />
faecal indicator organisms (FIOs) arising from diffuse agricultural run-off are a major<br />
cause of downgrading of rivers, lakes and co<strong>as</strong>tal bathing waters. The use of farm<br />
ponds to mitigate the collectively significant pollution arising from steadings h<strong>as</strong><br />
recently been promoted in Scotland. The aim of installing ponds is to treat run-off<br />
from farms, particularly from are<strong>as</strong> such <strong>as</strong> access tracks and roads, roofs, road<br />
crossings and peripheral yards with only minor or occ<strong>as</strong>ional pollutant loading.<br />
While many studies report good removal of nutrients, SS and FIOs in ponds and<br />
constructed wetlands (e.g. Borin et al., 2001; Hunt and Poach, 2001; Dunne et al.,<br />
2005a), it is necessary to evaluate the likely performance of farm ponds/wetlands, not<br />
only immediately after installation, but also over time. Performance of these systems<br />
h<strong>as</strong> been shown to vary se<strong>as</strong>onally (Thorén et al., 2004; Dunne et al., 2005b), with<br />
changing hydraulic and pollutant loadings (Fink and Mitsch, 2004) and may decre<strong>as</strong>e<br />
with incre<strong>as</strong>ing age <strong>as</strong> sediment accumulates and vegetation develops.<br />
The processes involved in water treatment in farm ponds vary between pollutants. P<br />
removal occurs mainly by sedimentation, adsorption to substrate and plant uptake<br />
62
(including algae) where<strong>as</strong> for N nitrification/denitrification can be a significant sink.<br />
Conversely, farm ponds may also be sources of N and P, rele<strong>as</strong>ed from sediment<br />
and winter die-back of vegetation and algae. Pond performance may therefore vary<br />
between farm types, depending on the nature and timing of pollutants received, and<br />
this may need to be reflected in design guidance. For instance, it is hypothesised<br />
that ponds could be less effective in retaining nutrients (particularly P) from livestock<br />
farm run-off compared with arable farms for a number of re<strong>as</strong>ons, including:<br />
• Much of the P will be <strong>as</strong>sociated with organic w<strong>as</strong>te in particulate, colloidal<br />
and soluble form, and hence be less quick to sediment than inorganic soil<br />
aggregates.<br />
• Inorganic P may be sorbed onto organic colloids and desorb to form soluble P<br />
when run-off is diluted strongly by water.<br />
• Organic rich sediment accumulated in ponds may be highly susceptible to the<br />
formation of anaerobic conditions, leading to potential P rele<strong>as</strong>e from any iron<br />
oxides present.<br />
• Organic sediment will also be more prone to resuspension than inorganic sediment<br />
because of its lower density.<br />
Guidance on farm steading ponds in Scotland is currently limited. SEPA’s interim<br />
guidance states that: ‘All livestock farms will have existing drainage systems in<br />
place to allow roof water and run-off from ‘clean’ roads and yards to discharge to<br />
local watercourses… it is this existing drainage that steading ponds are intended to<br />
address… Such an approach would also be consistent with what is currently defined<br />
<strong>as</strong> ‘good agricultural practice’ in The PEPFAA (Prevention of Environmental Pollution<br />
from Agricultural Activity) Code’. To provide demonstration sites and incre<strong>as</strong>e<br />
understanding of the factors affecting pond performance, the Scottish Executive and<br />
SEPA’s Diffuse Pollution and Habitat Enhancement Initiatives have funded the design<br />
and construction of four farm ponds throughout Scotland. This will be augmented<br />
by ongoing SEERAD-funded work at SAC and the Macaulay Institute evaluating best<br />
management practices (BMPs) on farms, supported by a new PhD project at The<br />
University of Edinburgh that aims to investigate the factors (including design) which<br />
influence the long-term performance of farm ponds and the relationships between<br />
pollutant removal efficiency, biodiversity enhancement and costs. This paper presents<br />
results from a SEERAD-funded project on the performance of a mature farm pond/<br />
wetland (constructed prior to current best practice guidance) and from a biodiversity<br />
survey of three existing farm pond/wetland systems. A discussion on plans for future<br />
work is also presented.<br />
MATERIALS AND METHODS<br />
Performance of an Established Onstream Farm Pond/Wetland<br />
The pond studied w<strong>as</strong> on Langside dairy farm (110 dairy cows plus followers) in the<br />
Cessnock catchment, Ayrshire. The main watercourse draining the farm steading<br />
and 221 ha of land p<strong>as</strong>ses through an abandoned 5000-m 3 reservoir and <strong>as</strong>sociated<br />
wetland, with a total area of 0.63 ha. The system is ‘onstream’ and not designed<br />
in accordance with current best practice guidelines [<strong>as</strong> outlined, for instance, by<br />
Campbell et al. (2004)], but it provided the opportunity to <strong>as</strong>sess the efficacy of an<br />
63
established pond/wetland for nutrient removal and FIO mitigation. In summer 2005,<br />
water samples from the inlet and outlet of the pond were collected by ISCO 6712<br />
samplers equipped with an Area Velocity Flow 750 module and WAVECOM Modem<br />
Control, serviced by a FLOWLINK data retrieval package. Composite water sampling<br />
(10 shots per bottle) w<strong>as</strong> triggered by discharge at the inlet and by time (hourly)<br />
at the outlet because the stream cross-section below the outlet structure w<strong>as</strong> too<br />
wide for flow-b<strong>as</strong>ed sampling. Water samples were analysed for total N, total P and<br />
ammoniacal N (NH 4<br />
-N) using automated colorimetric methods and SS (m<strong>as</strong>s of dried<br />
solids retained on filter paper from a known volume of sample). Although bottles from<br />
the water samples were collected on a weekly b<strong>as</strong>is, comparison of fresh versus<br />
aged samples showed < 5% decline in ammoniacal N content. Discharge at the inlet<br />
w<strong>as</strong> estimated by the area-velocity method from 5-minute me<strong>as</strong>urements of water<br />
level and velocity. Outlet water level data showed that there w<strong>as</strong> little hydraulic delay<br />
in the system (about 1 hour) and that the water residence time during storm events is<br />
about 1 day. From the water sample analysis results, hourly interpolated water quality<br />
data were calculated for the monitoring period using a double-parabolic interpolation<br />
function (XlXtrFun, Advanced Systems Design and Development, 2003). These were<br />
then combined with hourly discharge data from the inlet to provide a continuous<br />
estimate of loads.<br />
Comparison of Biodiversity Between Existing Farm Pond/Wetland<br />
Systems<br />
To provide a me<strong>as</strong>ure of the habitat value of farm ponds/wetlands, vegetation and<br />
macroinvertebrates were surveyed in three systems in Scotland in July 2005: (i)<br />
Langside farm, Ayrshire (described above); (ii) Black Loch wetland, Lunan Lochs,<br />
Angus – an established wetland of ~ 1.5 ha area and ~ 20,000 m 3 volume (again<br />
constructed prior to best practice guidelines) that receives run-off from fields<br />
amended with poultry manure; (iii) a pond/wetland system designed in accordance<br />
with best practice guidelines and constructed in 2004 at Old C<strong>as</strong>tle mixed arable<br />
farm, Berwickshire. Each system w<strong>as</strong> arbitrarily divided into six compartments from<br />
inlet to outlet and within each compartment plant species were identified and counted<br />
in five randomly located 1-m x 1-m quadrats. Macroinvertebrates were sampled and<br />
identified to species level in each system using the National Pond Survey method<br />
(Biggs et al., 1998).<br />
RESULTS<br />
Performance of an Established Onstream Farm Pond/Wetland<br />
Inlet and outlet total P and discharge for Langside pond are shown in Figure 1. Total<br />
P concentrations at the inlet rise with inlet discharge, peaking during storm events,<br />
while outlet total P concentrations often exceed inlet concentrations. When compared<br />
with total P water quality standards for Scottish freshwater lochs (SEPA, 2002), the<br />
outlet water quality would be cl<strong>as</strong>sified <strong>as</strong> ‘hypertrophic’ (total P > 0.1 mg/L). To<br />
<strong>as</strong>sess the performance of the pond/wetland in pollutant removal, mean hydraulic<br />
load, and total N, total P, NH 4<br />
-N, and SS concentrations at the inlet and outlet were<br />
used to calculate the overall m<strong>as</strong>s removal efficiency (<strong>as</strong> % of inlet load) for five<br />
periods where continuous inlet–outlet data exist (Table 1). Removal of SS by the<br />
pond/wetland is good. The overall efficiency of removal of both N and P is poor, but<br />
64
emoval varied between periods from –84% to 20% and –183% to 46%, respectively.<br />
The area is therefore at times a source of nutrients, particularly during low flows. The<br />
removal of FIOs is good (e.g. 83% for Escherichia coli bacteria; Vinten, pers. comm.).<br />
A positive (but not significant) relationship w<strong>as</strong> observed between % removal of SS,<br />
total P and total N and hydraulic load which w<strong>as</strong> attributed to the entry of larger<br />
particles (with f<strong>as</strong>ter settling velocity and containing total P and N) into the pond<br />
at higher flows. Marginally significant relationships between total P (P = 0.088) and<br />
total N (P = 0.075) removal and SS removal suggest that designing a pond/wetland<br />
to maximise SS removal should also result in good total P and N removal. In order to<br />
elucidate P retention within farm ponds/wetlands, the fractionation of P needs to be<br />
explored in more detail, although this w<strong>as</strong> not possible at Langside because of the<br />
field storage of water samples.<br />
Figure 1: Inlet discharge and total P concentrations at the inlet and outlet to<br />
Langside pond/wetland, days 138-180 of 2005. Horizontal bars on<br />
total P values show the time period represented by each sample<br />
65
Table 1:<br />
Hydraulic load, mean water quality and overall m<strong>as</strong>s removal efficiency<br />
of pollutants for Langside pond/wetland for five periods, 2005<br />
Start<br />
time<br />
End<br />
time<br />
Hydraulic<br />
load<br />
Mean concentration (mg/L) inlet/outlet<br />
(Days 2005) (m 3 /day) SS NH 4<br />
- N TN TP<br />
138.6 144.6 0.32 115/47.8 0.17/0.32 2.78/2.77 0.24/0.30<br />
150.7 158.6 1.27 44.0/22.4 0.31/0.39 3.04/2.93 0.15/0.20<br />
158.6 161.3 0.41 10.9/13.8 0.30/0.11 1.41/2.60 0.06/0.17<br />
161.3 164.3 0.58 20.4/15.5 0.36/0.23 2.83/2.15 0.18/0.12<br />
171.6 172.5 1.40 121/37.3 0.34/0.14 3.20/2.57 0.41/0.22<br />
Overall removal efficiency 53% -15% 4% -12%<br />
Comparison of Biodiversity between existing Farm Pond/Wetland Systems<br />
Me<strong>as</strong>ures of the abundance, richness and diversity (the Shannon diversity<br />
index, commonly used to describe the value of a habitat) for vegetation and<br />
macroinvertebrates are shown in Table 2 for the three farm wetland/pond systems<br />
surveyed in July 2005. For vegetation, the highest species richness is found at<br />
Langside, the highest abundance and Shannon diversity at Old C<strong>as</strong>tle, while Black<br />
Loch h<strong>as</strong> the lowest abundance, richness and diversity. Although the Old C<strong>as</strong>tle<br />
system is considerably younger than Langside, vegetation is clearly very well<br />
established. For macroinvertebrates, the highest richness and Shannon diversity<br />
occurs at Old C<strong>as</strong>tle and Langside, while the lowest diversity is at Black Loch and<br />
the lowest abundance at Langside.<br />
Table 2:<br />
Me<strong>as</strong>ures of vegetation and macroinvertebrate abundance, richness<br />
and diversity from sampling of three Scottish farm wetland/pond<br />
systems, July 2005<br />
Me<strong>as</strong>ure<br />
Pond/wetland system<br />
Old C<strong>as</strong>tle Langside Black Loch<br />
Vegetation<br />
Total abundance 22337 21771 13018<br />
Density (individuals m -2 ) 745 726 434<br />
Richness (No. of species) 17 23 15<br />
Shannon diversity index 2.01 1.55 1.42<br />
Macroinvertebrates<br />
Total abundance 814 90 1340<br />
Richness (No. of families) 20 13 11<br />
BMWP (Biological Monitoring<br />
Working Party) score<br />
37 33 24<br />
Shannon diversity index 2.30 2.29 1.18<br />
ASPT (average score per taxon) 4.63 4.71 4.00<br />
Most me<strong>as</strong>ures of abundance and diversity are similar at Old C<strong>as</strong>tle and Langside<br />
(apart from macroinvertebrate abundance and the Shannon diversity index<br />
for vegetation which are both considerably lower at Langside) but the species<br />
66
compositions in the two systems are quite different. Apart from various species of<br />
water boatmen that occur in both systems, the most abundant macroinvertebrates at<br />
Old C<strong>as</strong>tle were chironomids, midge larvae (Orthocladiinae (subfam.)) and common<br />
darter (dragonfly) (Sympetrum striolatum), compared with bivalves (Anodonta spp.),<br />
caddis larvae (Dicranota spp.), shrimps (Gammarus spp.) and flies (Leptocera<br />
humida) at Langside. The dominant plant species were floating sweet-gr<strong>as</strong>s (Glyceria<br />
fluitans) (28%) and Yorkshire fog (Holcus lanatus) (22%) at Old C<strong>as</strong>tle, common reed<br />
(Phragmites australis) (55%) at Langside and water horsetail (Equisetum fluviatile)<br />
(49%) at Black Loch, where the figures in brackets are the relative abundances for<br />
the overall sample.<br />
Black Loch appears impoverished for most indicators compared with the other two<br />
systems; its high total macroinvertebrate abundance is due to the dominance of<br />
water fle<strong>as</strong> (Bosmina sp.), accounting for 66% of individuals. Comparison of the<br />
ASPT values with SEPA’s Scottish River Cl<strong>as</strong>sification System indicates that water<br />
quality is ‘fair’ (Cl<strong>as</strong>s B) in the Old C<strong>as</strong>tle and Langside systems and ‘poor’ (Cl<strong>as</strong>s C)<br />
in Black Loch.<br />
DISCUSSION<br />
Detailed flow and water quality monitoring at Langside suggest that mature onstream<br />
ponds/wetlands can be sources of nutrients <strong>as</strong> well <strong>as</strong> sinks at certain times of<br />
year. This variable efficiency of wetlands h<strong>as</strong> been observed in other pond/wetland<br />
systems receiving agricultural run-off (Table 3).<br />
Table 3:<br />
Performance of other pond/wetland systems treating agricultural<br />
run-off/w<strong>as</strong>tewater<br />
Reference and study information<br />
Br<strong>as</strong>kerud (2002): instream wetlands receiving<br />
arable and dairy run-off, Norway<br />
Dunne et al. (2005b): constructed wetland<br />
treating dairy farmyard water, Ireland<br />
Fink and Mitsch (2004): restored wetland<br />
receiving arable and forest run-off, USA<br />
Geary and Moore (1999): pond-wetland<br />
system for dairy w<strong>as</strong>tewater, Australia<br />
Kadlec (2003): review of 21 lagoon-wetland<br />
systems, North America<br />
Raisin and Mitchell (1995): constructed<br />
wetland treating livestock run-off, Australia<br />
Reddy et al. (2001): experimental marsh-pond<br />
system for swine w<strong>as</strong>tewater, USA<br />
Thorén et al. (2004): constructed pond-marsh<br />
treating agricultural/urban run-off, Sweden<br />
% m<strong>as</strong>s removal: mean (min – max<br />
values)<br />
SS NH 4<br />
-N Total N Total P<br />
65<br />
(27–93)<br />
21-44<br />
(5–84)*<br />
41† 28<br />
26<br />
(3.2–45)<br />
50<br />
(–33–99)<br />
28<br />
(–8.6–57)<br />
49<br />
(7–99)<br />
(–25–40) (–15–45)<br />
66–69 43–60‡ 37–51 31–44<br />
17<br />
(6–36)§<br />
*SRP: 5% removal in winter; 81–84% removal rest of year. †Nitrate N. ‡Most removed<br />
in warmer months. §Annual removal, but 40% of annual N removal exported February<br />
to March 2001.<br />
67
Comparable SS removals have been reported in other systems, but the lower<br />
nutrient removal rates at Langside probably reflect a number of factors: the onstream<br />
nature of the system and short residence time (1 day compared with the 14–21 days<br />
preferred for offstream ponds); the often organic nature of the pollution; the presence<br />
of large amounts of sediment which rele<strong>as</strong>es nutrients <strong>as</strong> the water warms in spring;<br />
the residual effect of large winter loadings; and the likelihood that the vegetation is<br />
no longer acting <strong>as</strong> a sink. In terms of pond design, this means that offstream pond/<br />
wetland systems are preferable because, even if nutrient remobilisation occurs, input<br />
to the receiving watercourse would be small during low flow conditions.<br />
The results emph<strong>as</strong>ise the need to evaluate new ponds carefully and to establish<br />
maintenance protocols that ensure maximum retention capability is retained.<br />
Continuous flow and water quality monitoring is essential for <strong>as</strong>sessing treatment<br />
efficiency <strong>as</strong> performance varies over short timescales (hours and days) and infrequent<br />
water quality analyses may miss rapid changes in concentration during storm events<br />
that can impact on receiving watercourses. Vegetation and macroinvertebrate survey<br />
results show that considerable variability in biodiversity and conservation value exists<br />
between systems, probably due to the interaction of many factors, including: system<br />
age, pollutant and hydraulic loading, habitat heterogeneity, microclimate, localisation<br />
within the landscape and proximity of other wetlands/ponds for colonisation. There is<br />
a need to investigate the relationships between faunal and floral diversity and water<br />
treatment efficiency, and therefore quality, in order to propose recommendations for<br />
design and maintenance that maximise both pollutant removal and habitat value in<br />
farm ponds/wetlands.<br />
FURTHER WORK<br />
The issues identified above will be investigated in systematic <strong>as</strong>sessments of<br />
established and newly-constructed farm ponds/wetlands in Scotland during the next<br />
2 years. The research will include continuous flow and water quality monitoring of<br />
systems of different ages, representing the main farm types in Scotland that present<br />
a risk of diffuse pollution from steading run-off. Sites will include ponds designed in<br />
accordance with current best practice and constructed with funding from the Scottish<br />
Executive and SEPA’s Diffuse Pollution and Habitat Enhancement Initiatives. Factors<br />
relating to pond maintenance requirements and costs (e.g. vegetation growth,<br />
sediment accumulation) and their habitat and surroundings will also be considered.<br />
Although these pond/wetland systems are highly complex, it is hoped that the key<br />
processes and influencing factors can be identified and modelled to provide answers<br />
to questions, including:<br />
• What are the relationships between hydraulic and pollutant loadings and treatment<br />
performance?<br />
• How does design of a pond/wetland (e.g. water depth, extent of margins, presence<br />
of a treatment train, treatment of first flush) affect treatment performance and<br />
habitat value?<br />
• How compatible are water quality treatment and habitat functions of ponds, and<br />
do trade-offs need to be made?<br />
• How does pond/wetland treatment performance and habitat value change over<br />
time?<br />
68
Through addressing the above questions, the ultimate aim is to improve guidance<br />
on the design and maintenance of ponds and wetlands to reduce the contribution of<br />
farm steading run-off to diffuse pollution of Scottish waters.<br />
ACKNOWLEDGEMENTS<br />
We acknowledge the support of SEERAD in funding the Langside research, Colin<br />
Crawford (Scottish Agricultural College) for field support and the farmers at Old C<strong>as</strong>tle,<br />
Langside and Black Loch for access to their land. Jill Lanc<strong>as</strong>ter (The University of<br />
Edinburgh) and SEPA advised on the macroinvertebrate surveys.<br />
REFERENCES<br />
Biggs J, Fox G, Nicolet P, Walker D, Whitfield M and Williams P (1998). A Guide to the<br />
Methods of the National Pond Survey. Pond Action, Oxford.<br />
Borin M, Bonaiti G, Santamaria G and Giardini L (2001). A constructed surface flow<br />
wetland for treating agricultural w<strong>as</strong>te waters. Water Science and Technology 44,<br />
523–530.<br />
Br<strong>as</strong>kerud BC (2002). Factors affecting phosphorus retention in small constructed<br />
wetlands receiving agricultural non-point source pollution. Ecological Engineering<br />
19, 41–61.<br />
Campbell N, D’Arcy B, Frost A, Novotny V and Sansom A (2004). Diffuse Pollution:<br />
An Introduction to the Problems. IWA Publishing, London.<br />
Dunne EJ, Reddy KR and Carton AE (Eds.) (2005a). Nutrient Management in<br />
Agricultural Watersheds: A Wetlands Solution. Wageningen Academic Publishers,<br />
Wageningen, The Netherlands.<br />
Dunne EJ, Culleton N, O’Donovan G, Harrington R and Olsen AE (2005b). An<br />
integrated constructed wetland to treat contaminants and nutrients from dairy<br />
farmyard dirty water. Ecological Engineering 24, 221–234.<br />
EC (2000). Directive 2000/60/EC of the European Parliament and of the Council of<br />
23 October 2000 establishing a framework for Community action in the field of water<br />
policy. Official Journal L 327 22/12/2000: P. 0001 – 0073.<br />
Fink DF and Mitsch WJ (2004). Se<strong>as</strong>onal and storm event nutrient removal by a<br />
created wetland in an agricultural watershed. Ecological Engineering 23, 313–325.<br />
Geary PM and Moore JA (1999). Suitability of a treatment wetland for dairy<br />
w<strong>as</strong>tewaters. Water Science and Technology 40, 179–185.<br />
Hunt PG and Poach ME (2001). State of the art for animal w<strong>as</strong>tewater treatment in<br />
constructed wetlands. Water Science and Technology 44, 19–25.<br />
Kadlec RH (2003). Pond and wetland treatment. Water Science and Technology 48,<br />
1–8.<br />
Raisin GW and Mitchell DS (1995). The use of wetlands for the control of non-point<br />
source pollution. Water Science and Technology 32, 177–186.<br />
69
Reddy GB, Hunt PG, Phillips R, Stone K and Grubbs A (2001). Treatment of swine<br />
w<strong>as</strong>tewater in marsh-pond-marsh constructed wetlands. Water Science and<br />
Technology 44, 545–550.<br />
SEPA (2002). Total phosphorus water quality standards for Scottish freshwater lochs.<br />
SEPA Policy No. 16.<br />
Thorén A-K, Legrand C and Tonderski KS (2004). Temporal export of nitrogen from<br />
a constructed wetland: influence of hydrology and senescing submerged plants.<br />
Ecological Engineering 23, 233–249.<br />
70
COST-EFFECTIVE PROGRAMMES OF MEASURES:<br />
THEORY VERSUS REALITY<br />
S Blacklocke 1 , A Hooper 1 , M Rosenberg 2 and R Earle 3<br />
1<br />
CDM Ireland Ltd., Floor 1, 87-89 Morehampton Road, Dublin 4, Ireland, E-mail:<br />
blacklockesp@cdm.com; 2 CDM International Services Group, 50 Hampshire Blvd,<br />
Cambridge, MA 02139, USA; 3 Dublin City Council, Floor 3, 68-70 Marrowbone Lane,<br />
Dublin 8, Ireland<br />
SUMMARY<br />
The European Union Water Framework Directive (WFD) requires that river b<strong>as</strong>in<br />
management authorities identify cost-effective (i.e. le<strong>as</strong>t-cost) combinations of best<br />
management practices and other me<strong>as</strong>ures – programmes of me<strong>as</strong>ures (POMs)<br />
– to achieve at le<strong>as</strong>t ‘good’ status of surface and ground waters in Member States.<br />
However, the cost-minimisation requirement does come with an allowance for<br />
accommodating unique cost-distribution and other constraints or objectives the<br />
implementing river b<strong>as</strong>in management authorities may have. In conducting preliminary<br />
cost-effectiveness analysis of POMs for pilot catchments in Ireland’s E<strong>as</strong>tern River<br />
B<strong>as</strong>in District (ERBD), it h<strong>as</strong> become evident that the estimated cost-effective POMs<br />
for catchments throughout the District may often come with unobtainable or highly<br />
disproportionate marginal costs among the three major sectors. In response to this<br />
reality, the ERBD project team is developing a tool that will allow ERBD management<br />
officials to essentially conduct their own constrained cost-effectiveness analysis,<br />
thereby allowing them to identify cost-effective POMs subject to their own unique<br />
cost-distribution/limitation constraints.<br />
INTRODUCTION<br />
In 2003, the E<strong>as</strong>tern River B<strong>as</strong>in District (ERBD) project team commenced with a<br />
biophysical characterisation of four hydrometric are<strong>as</strong> in 12 local authorities that<br />
comprise the ERBD in the Republic of Ireland. A socioeconomic characterisation<br />
w<strong>as</strong> completed in 2004, and in 2005 the project team began distilling this information<br />
into a series of scientific and economic analyses. This included a cost-effectiveness<br />
analysis of ERBD water resources protection and remediation strategies – known <strong>as</strong><br />
POMs. This paper (1) details the cost-effectiveness analysis requirements under the<br />
WFD, (2) explains the theory behind identifying cost-effective POMs, and (3) shares<br />
experiences from and developments in formulating and implementing piloted costeffective<br />
POMs in the ERBD.<br />
COST-EFFECTIVE POMS UNDER THE WFD<br />
Annex III (b) of the WFD (European Union, 2000) stipulates that a cost-effectiveness<br />
analysis of water resource management me<strong>as</strong>ures be conducted <strong>as</strong> a prerequisite in<br />
formulating POMs.<br />
‘The economic analysis shall contain enough information in sufficient detail (taking<br />
account of the costs <strong>as</strong>sociated with collection of relevant data) in order to make<br />
judgements about the most cost effective combination of me<strong>as</strong>ures in respect of<br />
water uses to be included in the programme of me<strong>as</strong>ures under Article 11 b<strong>as</strong>ed on<br />
estimates of the potential costs of such me<strong>as</strong>ures.’<br />
71
In general, the combinations of me<strong>as</strong>ures that comprise a programme of me<strong>as</strong>ures<br />
must be adequate to yield at le<strong>as</strong>t ‘good ecological status’, <strong>as</strong> defined in Annex V<br />
(1.2):<br />
‘The values of the biological quality elements for the surface water body type show<br />
low levels of distortion resulting from human activity, but deviate slightly from<br />
those normally <strong>as</strong>sociated with the surface water body type under undisturbed<br />
conditions.’<br />
Quantitative evaluation of aquatic flora and fauna is required to determine ‘biological<br />
quality elements’. Numeric estimates of hydromorphological, chemical and<br />
physicochemical elements supporting these biological elements are required under<br />
Annex V (1.1).<br />
Thus the WFD-required cost-effectiveness analysis entails identifying le<strong>as</strong>t-cost<br />
combinations of me<strong>as</strong>ures that, if undertaken over a pre-specified time period<br />
(typically from 2010 to 2015), will yield some pre-specified quantifiable water<br />
resource management objective. Given that the information and data generation<br />
resources necessary to determine current water body conditions are typically scarce<br />
in Member States, <strong>as</strong> are the resources to determine the effectiveness of various<br />
management me<strong>as</strong>ures in reducing the impacts of the various pressures causing<br />
these conditions, Annex II (1.5) of the WFD provides that:<br />
‘Member States may utilise modelling techniques to <strong>as</strong>sist in such an <strong>as</strong>sessment…<br />
to optimise the design of…the programmes of me<strong>as</strong>ures required under Article 11.’<br />
However, where<strong>as</strong> the identification of cost-effective POMs is a requirement of the<br />
WFD, the implementation of the le<strong>as</strong>t-cost combinations of me<strong>as</strong>ures is not a rigid<br />
requirement. With regard to the establishments, economic sectors or subsectors,<br />
or jurisdictions that pay the costs of water services such <strong>as</strong> potable water supply,<br />
sewage treatment, or diffuse pollution mitigation, Article 9 of the WFD states that:<br />
‘Member States shall ensure by 2010 an adequate contribution of the different<br />
water uses, disaggregated into at le<strong>as</strong>t industry, households, and agriculture, to the<br />
recovery of costs of water services, b<strong>as</strong>ed on the economic analysis conducted<br />
according to Annex III and taking account of the polluter pays principle. Member<br />
States may in doing so have regard to the social, environmental and economic<br />
effects of the recovery…’<br />
Further, explicit me<strong>as</strong>ures that have already been transcribed into State or jurisdictional<br />
administrative law from the 11 EU Directives enumerated in Part A of Annex VI of<br />
the WFD (termed ‘b<strong>as</strong>ic me<strong>as</strong>ures’) are ‘to be included within the programmes of<br />
me<strong>as</strong>ures’, regardless of their relative cost-effectiveness. Thus, technically, the WFD<br />
implicitly requires that a constrained cost-effectiveness analysis be undertaken <strong>as</strong> a<br />
prerequisite to the formulation of POMs, where constraints to the cost-minimisation<br />
might include:<br />
1) full implementation of me<strong>as</strong>ures that are not comparatively cost effective; and<br />
2) limitations on the proportions of total costs of water services each establishment,<br />
economic sector or subsector, or jurisdiction is required to contribute via<br />
implementation of me<strong>as</strong>ures.<br />
72
THEORY IF IDENTIFYING COST-EFFECTIVE POMs<br />
In theory, estimating ‘optimal’ programmes of me<strong>as</strong>ures is a simple proposition.<br />
In other words, deriving algorithms to yield le<strong>as</strong>t-cost combinations of me<strong>as</strong>ures<br />
implemented at various levels, subject to a series of constraint variables with prespecified<br />
maximum or minimum relative or absolute values, is not a difficult exercise.<br />
In fact, the ERBD project team approached its pilot study to identify a constrained<br />
cost-effective programme of me<strong>as</strong>ures to achieve the anticipated water quality<br />
standard for phosphorous in the Athboy Catchment in the ERBD in this very way.<br />
Barring hydromorphological and groundwater pressures and having determined that<br />
phosphorous is likely to be the sole surface water quality limiting pollutant in the<br />
Athboy Catchment, with<br />
• data from simulations of phosphorous loadings to surface waters in the Catchment<br />
via the MIKE BASIN water quality modeling suite;<br />
• an <strong>as</strong>sessment of b<strong>as</strong>ic me<strong>as</strong>ures and their respective levels of implementation<br />
in the jurisdictions that overlap the Athboy Catchment; and<br />
• some literature-b<strong>as</strong>ed costs and effectiveness estimates of a relatively<br />
comprehensive list of phosphorous reduction me<strong>as</strong>ures;<br />
an adequate collection of variables were on hand to estimate the ‘optimal’ programme<br />
of me<strong>as</strong>ures for the Athboy Catchment via application of relatively simple linear<br />
algebra. However, since<br />
• the ERBD project team is not charged with the ultimate selection of programmes<br />
of me<strong>as</strong>ures to be implemented in the Athoby Catchment (and since the<br />
responsibility does lie with the lead local authorities); and<br />
• ground-truthing the cost-effectiveness analysis inputs and communicating the<br />
outputs must be done in direct consultation with local authority officials in the<br />
Athboy Catchment (and since this action is to be taken <strong>as</strong> a follow-up to the initial<br />
cost-effectiveness analysis);<br />
the ERBD project team considers it unrealistic to expect those who will make the<br />
final determinations of cost-effectiveness analysis variable inputs, including and<br />
especially the constraint variables for the cost-minimisation calculations, to simply<br />
work from a series of such algorithms.<br />
Hence a user-friendly, web-b<strong>as</strong>ed POMs selection feature with b<strong>as</strong>ic optimization<br />
functionality is being developed and integrated into the project’s decision support<br />
tool. With this feature, those who are charged with making these final determinations<br />
should be able to draw upon the most recent and precise information relevant to<br />
optimising their final preferred POMs to be implemented.<br />
REALITY OF SELECTING AND IMPLEMENTING COST-EFFECTIVE POMs<br />
Through its Athboy Catchment and other pilot applications, the ERBD project team<br />
h<strong>as</strong> come to realise that identifying constrained cost-effective POMs and ultimately<br />
implementing them over a 5-year or longer period cannot take place in an analytical<br />
vacuum, especially considering the fact that the project’ analysts do not have the<br />
73
final word on the POMs selection and long-term implementation. Table 1 contains<br />
the Athboy Catchment’s phosphorous loadings that were determined via modelling,<br />
summed across categories of pressures, and then compared against the loading<br />
consistent with the anticipated standard at average annual flow.<br />
Table 1:<br />
Estimated P loadings in the Athboy Catchment (Preliminary)<br />
P Loads (kg/year)<br />
Manure fertilised land 2,186<br />
Chemical fertilised land 2,255<br />
Septic systems 35<br />
WWTPs 811<br />
Total current 5,288<br />
Good status 2,299<br />
Target reduction 2,989<br />
Table 2 shows the literature-b<strong>as</strong>ed costs and effectiveness estimates of analysed<br />
me<strong>as</strong>ures.<br />
Table 2:<br />
Cost-effective me<strong>as</strong>ures for phosphorous for Athboy Catchment<br />
(preliminary)<br />
P Sources<br />
74<br />
Management<br />
me<strong>as</strong>ures<br />
Effectiveness<br />
(kg/year P red)<br />
Costs(5/year<br />
– 10 years)<br />
Cost-<br />
Effective<br />
(5/kg P red)<br />
Manure Manure management 437 250,000 572 6<br />
fertilised<br />
land<br />
plans<br />
25% stocking 546 22,800,000 41,758 15<br />
reduction<br />
Sheltered manure 218 150,000 688 7<br />
storage<br />
1.5 km 2 riparian 328 580,000 1,768 9<br />
buffers<br />
Feed optimisation 219 3,200 15 1<br />
plans<br />
500 m 3 retention 164 60,000 366 5<br />
ponds<br />
Chemical Fertiliser management 564 82,500 146 3<br />
fertilised<br />
land<br />
plans<br />
50% gr<strong>as</strong>sland 1,128 408,500 362 4<br />
conversion<br />
1.5 km 2 riparian 338 580,000 1,715 8<br />
buffers<br />
500 m 3 retention 451 60,000 133 2<br />
ponds<br />
Septic Inspections and 32 652,408 20,388 14<br />
systems upgrades<br />
Treatment plant tie-ins 35 244,678 6,991 12<br />
Education programme 9 75,000 8,333 13<br />
WWTPs MLE without filtration 561 2,649,000 4,722 10<br />
MLE with filtration 686 3,788,000 5,522 11<br />
CE<br />
Rank<br />
Figure 1 is the transformation of this information into the web-b<strong>as</strong>ed POM selection<br />
feature.
Figure 1: The ERBD project decision support system’s web-b<strong>as</strong>ed POM<br />
selection feature (v.ß)<br />
The POM selection feature is designed around the premise that local authority<br />
officials making final decisions regarding POMs will be primarily interested in (1)<br />
whether existing legal requirements will be met (hence the b<strong>as</strong>ic and supplemental<br />
me<strong>as</strong>ures categories); (2) what the cost-effective combination of me<strong>as</strong>ures is and<br />
how much this POM will cost (see x-marked me<strong>as</strong>ures for selections and note totals<br />
in the first view); and (3) how the marginal cost burden is distributed among the<br />
major sectors (8% agriculture and 92% domestic for the constrained cost-effective<br />
selection shown in the second view). Note the utility allows the user to identify the<br />
cost differential between the cost-effective POM (first view) and any constrained<br />
cost-effective POM (second view).<br />
75
CONCLUSIONS<br />
The ERBD project team is currently in the process of refining its estimates of<br />
phosphorous loadings and water resources protection and restoration me<strong>as</strong>ures’<br />
effectiveness and costs in response to face-to-face consultations with the local<br />
authority engineers and procurement officers that manage the Athboy Catchment.<br />
This process that will be undertaken for each of the catchments in the ERBD<br />
throughout 2006. The project team will also continue to modify and improve the POM<br />
selection feature of its decision support system in consultation with the ultimate<br />
users, which are these same local authority officials. Although the cost-effectiveness<br />
analytical inputs (and thus outputs) and user interface will undoubtedly change <strong>as</strong><br />
each of the catchments are analysed in further detail throughout 2006 and beyond,<br />
the ERBD project’s b<strong>as</strong>ic cost-effectiveness analysis methodology will not change.<br />
Under the ERBD project’s cost-effectiveness analysis methodology, le<strong>as</strong>t-cost POMs<br />
for each catchment will be identified along with the variety of real-world constraints<br />
that must be applied when making final selections of POMs and proceeding to<br />
implementation. With this information, <strong>as</strong> it is to be incorporated into this highly<br />
flexible and dynamic process, WFD objectives for the maintenance and achievement<br />
of good or excellent status water bodies will be achieved pragmatically, transparently,<br />
inclusively, expeditiously, and with the highest possible level of fiscal responsibility.<br />
ACKNOWLEDGEMENTS<br />
The authors wish to acknowledge the ERBD project team members who have<br />
contributed and continue to contribute to the development of the ERBD project’s<br />
cost-effectiveness analysis methodology:<br />
Melanie Heather, Henning Moe, Kieran Phillips (CDM Ireland Ltd)<br />
Matt Gamache, Larry Kelly, Jack Kiefer, Marianne MacDonald, Tom Pederson,<br />
Michael Waddell, Kirk Westphal (CDM Inc.)<br />
Ken Dowling, Paul Mills (Comp<strong>as</strong>s Informatics Ltd).<br />
REFERENCES<br />
European Union (2000). Directive of the European Parliament and of the Council<br />
2000/60/EC Establishing a Framework for Community Action in the Field of Water<br />
Policy, Luxembourg (Water Framework Directive). Published by the European<br />
Parliament and the Council, Luxembourg.<br />
76
ASSESSING THE COST-EFFECTIVENESS OF<br />
INTEGRATED MEASURES TO DECREASE LOSS OF<br />
NITRATE, PHOSPHORUS AND FAECAL INDICATOR<br />
ORGANISMS<br />
M Shepherd 1 , S Anthony 1 , P Haygarth 2 , D Harris 1 , P Newell-Price 1 , S Cuttle 2 , B<br />
Chambers 1 and D Chadwick 2<br />
1<br />
ADAS, Gleadthorpe, Meden Vale, Mansfield, Notts, NG20 9PF, UK, E-mail: mark.<br />
shepherd@ad<strong>as</strong>.co.uk; 2 IGER, North Wyke, Okehampton, Devon, EX20 SB, UK<br />
SUMMARY<br />
The timetable for implementation of the Water Framework Directive requires best<br />
available information to be synthesised now. Cost-effectiveness is an important<br />
consideration when deciding what actions should be taken to control diffuse pollution<br />
losses from agriculture. This paper presents preliminary results from a toolkit for<br />
<strong>as</strong>sessing the cost-effectiveness of combinations of mitigation methods invoked<br />
by a range of policy options. It is a mix of simplified diffuse pollution models (to<br />
determine b<strong>as</strong>eline losses of nitrate, phosphorus and faecal indicator organisms),<br />
best available information on cost-effectiveness drawn from other projects and,<br />
using these building blocks, a cost-curve approach. The approach relies on expert<br />
judgement.<br />
INTRODUCTION<br />
Implementation of the Water Framework Directive and addressing diffuse water<br />
pollution from agriculture means identifying and implementing practical on-farm<br />
methods for mitigating losses of pollutants from land to water. Agricultural sources<br />
of diffuse pollution include nutrients (nitrogen and phosphorus), agrochemicals (plant<br />
protection products, veterinary medicines and biocides), sediment and pathogens<br />
(faecal indicator organisms and FIOs). Generally, we have a good understanding<br />
of the mitigation methods available to farmers (e.g. Vinten et al., 2005); recent UK<br />
projects have listed these methods, which can number over 50 (RPA, 2005). They<br />
range in complexity from something <strong>as</strong> simple <strong>as</strong> using a fertiliser recommendation<br />
system through to more complex (and expensive) approaches, such <strong>as</strong> installing a<br />
constructed wetland.<br />
Research shows that combinations of mitigation methods will be needed to reduce<br />
losses to acceptable limits (Shepherd and Chambers, 2006). The challenge is now<br />
to ‘encourage’ land managers to implement these mitigation methods. Me<strong>as</strong>ures (or<br />
‘policy options’) to encourage uptake range from voluntary to regulatory (Table 1).<br />
To inform the debate, an understanding of the cost-effectiveness of these policy<br />
options is also important. This paper puts forward a methodology for determining the<br />
cost-effectiveness of combinations of mitigation methods (which could be brought<br />
about by different policy options). This novel approach allows an <strong>as</strong>sessment of<br />
combinations of me<strong>as</strong>ures and their effectiveness for controlling losses of nitrate,<br />
phosphorus and FIOs. Here, we present some preliminary results.<br />
77
Table 1:<br />
A summary of the me<strong>as</strong>ures available for implementing changes in<br />
farm practices, with examples (b<strong>as</strong>ed on Dampney et al., 2002)<br />
Me<strong>as</strong>ure<br />
Examples<br />
1. Voluntary without external pressure Advice to follow good agricultural<br />
practice<br />
2. Voluntary with external pressure Compliance with Farm Assurance<br />
Schemes<br />
3. Voluntary but compensated Environmental Stewardship schemes<br />
4. Mandatory, not compensated Nitrate Vulnerable Zone (NVZ)<br />
regulations<br />
5. Mandatory, compensated Compulsory purch<strong>as</strong>e of land<br />
MATERIALS AND METHODS<br />
Impact of Mitigation Methods<br />
Previous ‘Cost-Curve’ projects have separately identified mitigation methods and their<br />
likely effectiveness in controlling nitrate (Scholefield, 2005), phosphorus (Haygarth,<br />
2003) and FIO (Haygarth, 2005) losses from agricultural land. From these projects,<br />
we identified a list of 44 methods with potential to decre<strong>as</strong>e losses of at le<strong>as</strong>t one of<br />
the three chosen pollutants (Table 2). To move towards a quantitative <strong>as</strong>sessment<br />
of the effectiveness of mitigation methods, two separate activities were undertaken.<br />
First, mitigation methods were defined in sufficient detail that users of the work would<br />
understand what w<strong>as</strong> meant, for example, by ‘establish a cover crop before spring<br />
sown crops’. The cost of each mitigation method w<strong>as</strong> then <strong>as</strong>sessed. Second, the<br />
efficacy of each mitigation method in reducing losses of nitrate, phosphorus and<br />
FIOs w<strong>as</strong> estimated. This w<strong>as</strong> done using quantitative data collected from model<br />
runs during the series of previous Cost-Curve projects (<strong>as</strong> described above), and<br />
w<strong>as</strong> supplemented by literature review data where methods had not previously been<br />
modelled. Method effects were expressed <strong>as</strong> absolute reductions in pollutant loss,<br />
and did not consider any interactions between methods. To prevent over-estimation<br />
of the effectiveness of multiple methods, the loss reductions were re-expressed<br />
<strong>as</strong> a percentage of the loss due to specific sources, namely external (fertilisers),<br />
internal (soil) and recycled (manure and excreta) sources. The net efficacy of multiple<br />
methods could then be calculated using a multiplicative model <strong>as</strong>:<br />
Net Efficiency: = 1 – (1–E 1<br />
) × (1–E 2<br />
) × (1–E n<br />
)<br />
where En is the proportional efficacy of an individual method. The source<br />
apportionment draws upon a conceptual Cost-Cube model (Haygarth, 2005;<br />
Chadwick et al., 2006). However, <strong>as</strong> the approach does not explicitly represent<br />
the different modes of pollutant mobilisation and transport, it is still possible for the<br />
effectiveness of method combinations to be over-estimated.<br />
Model Farms and B<strong>as</strong>eline Losses<br />
Assessments were b<strong>as</strong>ed on ‘typical’ farm systems. The model farm systems were<br />
defined to be representative of current practices and were characterised by an area<br />
78
of arable or gr<strong>as</strong>sland, a number of livestock, and <strong>as</strong>sociated inorganic fertiliser<br />
and managed organic manure inputs (Table 3). Pollutant losses from each model<br />
farm were calculated for combinations of soil texture (clay loam or sandy loam) and<br />
climate conditions (net soil drainage 170–620 mm) to represent the range of b<strong>as</strong>eline<br />
pollutant losses across England and Wales.<br />
Table 2:<br />
An example of mapping of mitigation methods (not an exhaustive<br />
list presented here) against potential policy options for invoking<br />
change. A ticked box indicates that this policy option h<strong>as</strong> the<br />
potential to implement this mitigation method. The extent to which<br />
the method is implemented w<strong>as</strong> not considered<br />
Reduce overall stocking rates on livestock<br />
farms<br />
Reduce dietary N and P intakes<br />
Adopt ph<strong>as</strong>e feeding of livestock<br />
Nutrient<br />
Management<br />
Plan<br />
Farm<br />
Assurance<br />
Scheme<br />
NVZ<br />
Action<br />
Programme<br />
Use a fertiliser recommendation system √ √ √<br />
Integrate fertiliser and manure nutrient<br />
supply<br />
Do not apply P fertilisers to high P index<br />
soils<br />
√<br />
√<br />
√<br />
√ √ √<br />
Do not apply fertiliser to high-risk are<strong>as</strong> √ √ √<br />
Avoid spreading fertiliser to fields at highrisk<br />
times<br />
Incre<strong>as</strong>e the capacity of farm manure<br />
stores<br />
Site manure heaps from watercourses and<br />
field drains<br />
√<br />
√<br />
√ √ √<br />
Do not apply manure to high-risk are<strong>as</strong> √ √<br />
Do not spread manure to fields at high-risk<br />
times<br />
Incorporate manure into the soil<br />
Transport manure to neighbouring farms<br />
Incinerate poultry litter<br />
√<br />
√<br />
√<br />
√<br />
√<br />
√<br />
√<br />
√<br />
79
Table 3:<br />
A summary of the representative farm types used to calculate costs<br />
and effectiveness of mitigation methods<br />
Farm system<br />
Animal<br />
count<br />
Excreta<br />
(t/year)<br />
Managed<br />
manure (%)<br />
Field area<br />
(ha)<br />
Fertiliser<br />
(kg N/ha)<br />
Gr<strong>as</strong>s (dairy) 270 5040 60 150 190<br />
Gr<strong>as</strong>s (suckler beef) 220 2288 60 100 60/100<br />
Breeding Pigs (indoor) 1330 2125 100 71 145<br />
Broilers 150000 2500 100 437 145<br />
Arable - - - 300 165<br />
Arable plus manure - 2700 100 300 145<br />
The b<strong>as</strong>eline pollutant losses were calculated using a suite of ‘tier-one’ diffuse<br />
pollution tools for N, P and FIOs, dealing with losses from soil, from fertiliser or<br />
from manure. These b<strong>as</strong>eline data, combined with <strong>as</strong>sessments of the cost and<br />
effectiveness of each mitigation method were used to calculate the likely cost benefit<br />
of combinations of mitigation methods that could be invoked by a policy option<br />
(described below).<br />
Policy Option Mix<br />
Different policy options that might be considered for use in encouraging uptake of<br />
combinations of mitigation methods can be tested. For each option mix, we are<br />
able to produce a mitigation method-policy option matrix and map out mitigation<br />
methods likely to be invoked by a policy option. Table 2 provides information on this,<br />
<strong>as</strong> an example.<br />
To calculate the effectiveness of a policy option in reducing pollutant losses, we then<br />
developed a tool to calculate a Cost-Curve for the list of methods that were potentially<br />
applicable to a farm under a particular policy option. Using the examples in Table 2,<br />
a Nutrient Management Plan could potentially impact on seven mitigation methods,<br />
NVZ regulations on 11 mitigation methods. Other policy options (not presented here)<br />
invoked fewer or more mitigation options, depending on the nature of the option.<br />
A Cost-Curve is defined <strong>as</strong> the relationship between emission abatement and marginal<br />
cost. The function is continuous and h<strong>as</strong> a positive gradient, i.e. the marginal cost<br />
always incre<strong>as</strong>es with incre<strong>as</strong>ing emission reduction, thereby satisfying the law of<br />
diminishing returns. Cost-curve optimisation is a numerically intensive calculation that<br />
scales exponentially with the number of potential methods. The optimal Cost-Curve<br />
can be determined only by simulating all possible orders of method implementation,<br />
<strong>as</strong> the marginal cost is dependent on the methods already implemented. For this<br />
work, we adopted a pragmatic approach in which the tool iteratively selects and<br />
implements the method with the le<strong>as</strong>t cost-benefit ratio at each cost step. At each<br />
step, each method from the pool of currently unimplemented methods is implemented<br />
separately and the cost-benefit of implementation is calculated. The method with<br />
the le<strong>as</strong>t ratio of additional cost and emission reduction is implemented. Mutually<br />
exclusive methods that have not yet been implemented will not be considered on<br />
subsequent steps.<br />
80
The Cost-Curve calculation tool optimises simultaneously on the percentage<br />
reduction in phosphorus, nitrate and FIO losses. If preferred, options allow for a<br />
weighting to be given to methods that are effective against a specific pollutant. This<br />
would enable optimisation against, for example, differential costs of clean up per<br />
unit of pollutant loss. Additionally, the tool can be used to optimise on only cost or<br />
benefit, and to limit either the maximum spend or number of methods implemented.<br />
The maximum spend limit can be used to restrict method implementation to advisory<br />
policy options that either save money or are relatively low cost.<br />
RESULTS AND DISCUSSION<br />
We show two examples of model farms: arable with manure and a dairy farm.<br />
Modelled b<strong>as</strong>eline losses are shown in Table 4. Preliminary results for the <strong>as</strong>sessment<br />
of cost-effectiveness of two policy options, <strong>as</strong> examples, are presented; a Nutrient<br />
Management Plan and a Farm Assurance Scheme. Table 2 shows which mitigation<br />
methods are invoked.<br />
Table 4:<br />
Modelled b<strong>as</strong>eline losses of nitrate-N and phosphorus (kg) and<br />
FIO (relative units) for two representative farm types and two soil<br />
textures. Annual average rainfall w<strong>as</strong> <strong>as</strong>sumed to be 850 mm<br />
Farm type Sandy loam Clay loam<br />
N P FIO N P FIO<br />
Arable (+ manure) Soil + dissolution 10898 2.1 0 10444 633 0<br />
Manure + excreta 1649 5.2 6 1212 133 38<br />
Mineral fertiliser 2267 3.5 0 3573 168 0<br />
Total 14814 10.8 6 15229 934 38<br />
Average across farm (kg/ha): 49
cost (£'000/farm) or reduction in loss (%)<br />
50<br />
45<br />
40<br />
35<br />
30<br />
25<br />
20<br />
15<br />
10<br />
5<br />
0<br />
-5<br />
Dairy<br />
Arable + manure<br />
cost NO3 P FIO cost NO3 P FIO<br />
Nutrient management plan<br />
F arm <strong>as</strong>surance scheme<br />
Figure 1: The estimated efficiency (% reduction against b<strong>as</strong>eline) and<br />
cost (£’000/farm) of two example policy options applied to two<br />
representative farm types<br />
The results from the cost-effectiveness <strong>as</strong>sessment (Figure 1) show several points,<br />
with more scope for decre<strong>as</strong>ing nitrate loss on the dairy farm than on the arable farm.<br />
The Nutrient Management Plan had no effect on FIOs; neither policy option affected<br />
FIOs on the arable farm. This is because control is influenced by storage practices and<br />
it w<strong>as</strong> <strong>as</strong>sumed that there w<strong>as</strong> no storage on the arable farm: manure w<strong>as</strong> imported<br />
and spread. Effectiveness in decre<strong>as</strong>ing P loss w<strong>as</strong> similar between farm types.<br />
The Farm Assurance Scheme w<strong>as</strong> more effective than the Nutrient Management<br />
Plan, particularly on the dairy farm. This is because the Farm Assurance Scheme<br />
included me<strong>as</strong>ures that controlled timing of manure applications and storage, in<br />
our example. The costs to the farm business of implementing the two example<br />
options differ between farm types, with a net saving (negative cost) on the arable<br />
farm, but a cost of c. £7,000 to the dairy farm. This comes down to interpretation of<br />
which me<strong>as</strong>ures are invoked. We have <strong>as</strong>sumed that both example policy options<br />
result in farms having to source alternative protein sources (‘dietary manipulation’)<br />
for the dairy herd, which bears a substantial cost. Without this, both policy options<br />
would be close to cost neutral on the dairy farms. Suggested mitigation methods<br />
would clearly benefit diffuse pollution losses, but have implications for the economic<br />
sustainability of individual farm businesses. A major benefit of the cost-effectiveness<br />
tool under development is that it allows a wide range of scenarios to be tested and<br />
compared.<br />
82
ACKNOWLEDGEMENTS<br />
We gratefully acknowledge support for this work from the Department for Environment,<br />
Food and Rural Affairs (Defra).<br />
REFERENCES<br />
Chadwick DR, Chambers BJ, Anthony S, Granger S, Haygarth PM, Harris D and<br />
Smith K (2006). A me<strong>as</strong>ure-centric approach to diffuse pollution modelling and costcurve<br />
analysis of mitigation me<strong>as</strong>ures. This volume.<br />
Dampney P, M<strong>as</strong>on P, Goodl<strong>as</strong>s G and Hillman J (2002). Methods and me<strong>as</strong>ures to<br />
minimise the diffuse pollution of water from agriculture – a critical appraisal. In: Defra<br />
project NT2507 report. London.<br />
Haygarth P (2003). Cost curve <strong>as</strong>sessment of phosphorus mitigation options relevant<br />
to UK agriculture. In: Report for Defra Project PE0203. URL http://www.defra.gov.<br />
uk/science/default.htm<br />
Haygarth P (2005). COST-DP: Cost-effective diffuse pollution mitigation. In: Report<br />
for Defra Project ES0121. URL http://www.defra.gov.uk/science/default.htm<br />
RPA (2005). Development of a methodology to determine the cost effectiveness<br />
of me<strong>as</strong>ures and combinations of me<strong>as</strong>ures for the Water Framework Directive.<br />
In: Report for the Collaborative Research Programme on River B<strong>as</strong>in Management<br />
Planning.<br />
Shepherd MA and Chambers BC (2006). Managing nitrogen on the farm: the devil is<br />
in the detail. Nutrient Cycling in Agro-ecosystems (in press).<br />
Scholefield D (2005). Cost curve of nitrate mitigation options. In: Report for Defra<br />
project NT2511. URL http://www.defra.gov.uk/science/default.htm<br />
Vinten AJA, Towers W, King JA, McCracken DI, Crawford C, Cole LJ, Duncan A, Sym<br />
G, Aitken M, Avdic K, Lilly A, Langan S and Jones M (2005). Appraisal of rural BMPs<br />
for controlling diffuse pollution and enhancing biodiversity. In: Report to SNIFFER,<br />
for contract WFD13, Edinburgh. 135pp URL http://www.sniffer.org.uk/results.<strong>as</strong>p<br />
83
ECONOMIC IMPLICATIONS OF MINIMISING DIFFUSE<br />
NITROGEN POLLUTION FROM LIVESTOCK MANURES<br />
BJ Chambers 1 , JR Williams 2 , E Sagoo 2 , KA Smith 3 and DR Chadwick 4<br />
1<br />
ADAS Gleadthorpe, Meden Vale, Mansfield, Notts., NG20 9PF, UK, E-mail: brian.<br />
chambers@ad<strong>as</strong>.co.uk; 2 ADAS Boxworth, Battlegate Road, Boxworth, Cambridge,<br />
CB3 8NN, UK; 3 ADAS Wolverhampton, Wergs Road, Woodthorne, Wolverhampton<br />
WV6 8TQ, UK; 4 IGER North Wyke, Okehampton, Devon, EX20 2SB, UK<br />
SUMMARY<br />
The economic implications of additional financial investment in extra slurry storage<br />
capacity and improved manure spreading equipment to reduce diffuse nitrogen<br />
pollution from livestock manure management w<strong>as</strong> <strong>as</strong>sessed for six ‘model’ livestock<br />
(two pig, three cattle and one broiler) farms. On the pig and dairy farms, the investment<br />
in additional slurry storage required to avoid the need to apply slurry in the autumn<br />
w<strong>as</strong> between £3,500 and £5,880/year (amortised over 20 years), compared with an<br />
incre<strong>as</strong>ed fertiliser N replacement value of the slurry (<strong>as</strong> a result of reduced leaching<br />
losses) of between £180 and £760/year. The cost of the bandspreading equipment<br />
w<strong>as</strong> c. £3,250/year (amortised over 10 years) compared with the incre<strong>as</strong>ed fertiliser<br />
N replacement of the slurry N (<strong>as</strong> a result of reduced ammonia losses) of between<br />
£230 and £330/year on the pig and dairy farms. On the broiler farm, reducing N<br />
leaching losses by changing the application timing from autumn to spring incre<strong>as</strong>ed<br />
the fertiliser N replacement value of the broiler litter by £3,860/year, compared<br />
with the cost of the improved spreading equipment at £2,860/year (amortised over<br />
10 years). Studies quantifying both nitrate leaching and ammonia volatilisation losses<br />
have clearly shown that an integrated approach to slurry N management is needed,<br />
so that management policies that aim to reduce nitrate leaching do not exacerbate<br />
other N loss pathways (so called ‘pollution swapping’).<br />
INTRODUCTION<br />
In the UK each year, approximately 90 million tonnes of livestock manures (47 million<br />
tonnes of slurry and 43 million tonnes of solid manure) supplying 450,000 tonnes of<br />
nitrogen (N) are applied to agricultural land (Williams et al., 2000). Efficient utilisation<br />
of manure nitrogen is essential to reduce diffuse air (e.g. ammonia) and water (e.g.<br />
nitrate) pollution, and to maximise crop N utilisation. The UK is committed to reducing<br />
ammonia emissions and nitrate leaching losses to comply with EU Directives. The<br />
current Nitrate Vulnerable Zone Action Programme (which covers 55%, 14% and<br />
3% of agricultural land in England, Scotland and Wales, respectively) restricts the<br />
application of high available N manures (i.e. pig/cattle slurries and poultry manures)<br />
on sandy and shallow soils in the autumn/early winter period.<br />
On many farms, changing manure application practices to reduce nitrate leaching<br />
losses will require significant financial investment in extra slurry storage capacity<br />
to avoid the need to apply slurry in the autumn. In addition, investment in slurry<br />
bandspreading equipment (e.g. trailing hose and trailing shoe machines; Plate 1) is<br />
likely to be required to apply slurry evenly to growing arable and gr<strong>as</strong>sland crops in<br />
spring/summer, without causing damage to soils and reducing crop quality. However,<br />
84
the cost of these financial investments will be partly offset by incre<strong>as</strong>ed manure<br />
fertiliser N replacement values (resulting from reduced nitrate and ammonia losses)<br />
and incre<strong>as</strong>ed spreading opportunities for slurry throughout the cropping se<strong>as</strong>on.<br />
Plate 1:<br />
Trailing hose slurry application to winter wheat (left) and trailing<br />
shoe slurry application on gr<strong>as</strong>sland (right)<br />
This paper quantifies the economic implications of changing manure management<br />
practices to minimise nitrate leaching and ammonia volatilisation losses on model<br />
pig, dairy and broiler farms on contr<strong>as</strong>ting soil types and under different climatic<br />
conditions.<br />
MATERIALS AND METHODS<br />
The impacts of changing manure application timings from autumn (August–October)<br />
to spring/summer (February–July) on nitrate leaching losses and ammonia emissions<br />
were quantified for six model livestock farms (Table 1). The amount of nitrogen applied<br />
to land w<strong>as</strong> estimated b<strong>as</strong>ed on standard livestock N production figures (Anon,<br />
2000). For the dairy farms, it w<strong>as</strong> <strong>as</strong>sumed that 60% of the estimated N production<br />
w<strong>as</strong> spread <strong>as</strong> slurry, with the remainder deposited during spring/summer grazing.<br />
For the pig and broiler farms, it w<strong>as</strong> <strong>as</strong>sumed that all of the estimated N production<br />
w<strong>as</strong> returned to land via manure applications.<br />
N Losses<br />
Data from experiments carried out on a range of soil types (Chambers et al., 2000;<br />
Williams et al., 2005a), where nitrate leaching losses were me<strong>as</strong>ured after autumn<br />
surface broadc<strong>as</strong>t applications of slurry or broiler litter, were used to estimate nitrate<br />
leaching losses <strong>as</strong> a percentage of the total N applied. Ammonia emissions were<br />
estimated using MANNER (Chambers et al., 1999) <strong>as</strong>suming a slurry dry matter<br />
content of 4% for pig slurry and 6% for cattle slurry. Slurry bandspreading w<strong>as</strong><br />
<strong>as</strong>sumed to reduce ammonia losses by 30% compared with surface broadc<strong>as</strong>ting<br />
(Chambers et al., 2001).<br />
Storage Capacity and Spreading Equipment<br />
The existing slurry storage capacity w<strong>as</strong> <strong>as</strong>sumed to be 3 months for the model dairy<br />
farms and 4 months for the model pig farms, which is typical of current commercial<br />
practice (Smith et al., 2000, 2001). On the dairy farms, it w<strong>as</strong> <strong>as</strong>sumed that slurry<br />
could be spread in spring from early February to late March and to silage aftermaths<br />
in the summer (i.e. an August to January no spread period). To avoid the need to<br />
85
spread cattle slurry in the autumn period, an extra 3-months slurry storage (2,100 m3)<br />
w<strong>as</strong> <strong>as</strong>sumed to be needed on the dairy farms. On the pig farms which were in arable<br />
production, cropping patterns were <strong>as</strong>sumed to limit slurry applications to a 3-month<br />
period between early February and late April (i.e. a May to January no spread period)<br />
<strong>as</strong> a result, it w<strong>as</strong> <strong>as</strong>sumed that the slurry storage capacity needed to incre<strong>as</strong>e from<br />
4 to 9 months (1,000 to 2,250 m 3 ).<br />
Table 1:<br />
Description of model farms<br />
Farm<br />
type and<br />
cropping<br />
(location)<br />
Breeding<br />
pigs – arable<br />
(Cambs)<br />
Breeding<br />
pigs – arable<br />
(E<strong>as</strong>t Yorks)<br />
Dairy – gr<strong>as</strong>s<br />
(North Yorks)<br />
Dairy – gr<strong>as</strong>s<br />
(Devon)<br />
Dairy – gr<strong>as</strong>s<br />
(Shropshire)<br />
Broilers<br />
– arable<br />
(Notts)<br />
Soil<br />
texture<br />
Average<br />
annual<br />
rainfall<br />
(mm)<br />
Animal<br />
numbers<br />
Clay 550 1,330<br />
Silty clay<br />
loam over<br />
chalk<br />
Sandy<br />
loam<br />
Sandy<br />
loam<br />
Sandy<br />
loam<br />
Loamy<br />
sand<br />
places<br />
750 1,330<br />
places<br />
700 270<br />
1,100 270<br />
650 270<br />
(150 dairy<br />
cows, 120<br />
followers)<br />
(150 dairy<br />
cows, 120<br />
followers)<br />
(150 dairy<br />
cows, 120<br />
followers)<br />
640 150,000<br />
places<br />
Quantity<br />
of manure<br />
spread<br />
(t)<br />
3,000<br />
(4% dry matter)<br />
3,000<br />
(4% dry matter)<br />
5,040<br />
(6% dry matter)<br />
5,040<br />
(6% dry matter)<br />
5,040<br />
(6% dry matter)<br />
Manure<br />
N<br />
spread<br />
(kg)<br />
12,000 9*<br />
12,000 19†<br />
15,120 11‡<br />
15,120 30‡<br />
15,120 17§<br />
2,475 74,250 13<br />
Nitrate<br />
leaching<br />
losses<br />
following<br />
autumn<br />
spreading<br />
(%total<br />
N applied)<br />
*4 site years between 1995/96 and 2000/01, †1 site year 2002/03, ‡4 site years<br />
1990/91 to 1993/94, §3 site years 1991/92 to 1993/94, 3 sites years 1990/91 to<br />
1992/93.<br />
The financial costs of incre<strong>as</strong>ing slurry storage capacity were calculated using<br />
typical industry figures of £35/m 3 , with the capital investment costs amortised over<br />
20 years at an interest rate of 5%, giving an annual repayment cost of £80 per £1,000<br />
borrowed. For the broiler litter, it w<strong>as</strong> <strong>as</strong>sumed that the solid manure w<strong>as</strong> stored in<br />
field heaps, so there would be no substantial extra capital investment required to<br />
store the manure from autumn through to spring.<br />
86
The financial costs of purch<strong>as</strong>ing improved spreading equipment (i.e. a tanker and<br />
trailing hose/shoe bandspreader for slurry applications, and a moving floor spreader<br />
with vertical rear beaters for broiler litter, to allow cattle/pig slurry and broiler litter to<br />
be applied evenly to growing crops in spring/summer with minimal crop damage)<br />
were taken from manufacturers’ list prices and amortised over 10 years, with an<br />
interest rate of 5% (annual repayment cost £130 per £1,000 borrowed).<br />
The fertiliser N replacement value of the manure applications w<strong>as</strong> <strong>as</strong>sumed to be<br />
40 p/kg N. The annual net costs (additional amortised capital cost – the incre<strong>as</strong>ed<br />
fertiliser N value) of the improved manure management practices were calculated so<br />
that the costs of reducing nitrate-N and ammonia-N losses could be quantified on<br />
a £/kg b<strong>as</strong>is.<br />
RESULTS AND DISCUSSION<br />
Pig Slurry<br />
After autumn pig slurry applications (Table 2) on the Cambridgeshire clay soil farm,<br />
estimated nitrate leaching losses were 450 kg N (5,000 kg slurry N from 5 months<br />
slurry production x 9% of total N applied leaching loss factor) and 950 kg N (5,000 kg<br />
slurry N from 5 months slurry production x 19% of total N applied leaching loss factor)<br />
on the E<strong>as</strong>t Yorkshire shallow soil over chalk farm (see Table 1 for model farm b<strong>as</strong>e<br />
data). The greater leaching losses from the E<strong>as</strong>t Yorkshire farm reflect the higher over<br />
winter rainfall and more nitrate ‘leaky’ nature of the shallow soil over chalk compared<br />
with the clay soil. Ammonia losses from the surface broadc<strong>as</strong>t applications were<br />
estimated at 1,920 kg (i.e. 12,000 kg slurry N x 16% of total N applied) on both<br />
farms, compared with 1,340 kg N after the trailing hose applications (30% reduction<br />
compared with surface broadc<strong>as</strong>ting).<br />
Table 2:<br />
Summary of N losses from model pig and cattle farms<br />
Farm<br />
(location)<br />
Breeding pigs<br />
– arable (Cambs.)<br />
Breeding pigs<br />
– arable (E<strong>as</strong>t<br />
Yorks)<br />
Dairy – gr<strong>as</strong>s<br />
(North Yorks.)<br />
Dairy – gr<strong>as</strong>s<br />
(Devon)<br />
Dairy – gr<strong>as</strong>s<br />
(Shropshire)<br />
Nitrate-<br />
N loss<br />
(kg/<br />
farm)<br />
Autumn<br />
Ammonia-N loss<br />
(kg/farm)<br />
Surface<br />
spread<br />
Bandspread<br />
slurry<br />
Cost/kg<br />
nitrate-N<br />
abated (£/kg/<br />
year)<br />
450 1,920 1,340 14.09 5.60<br />
950 1,920 1,340 6.46 5.60<br />
690 2,720 1,900 12.35 3.96<br />
1,890 2,720 1,900 4.25 3.96<br />
1,070 2,720 1,900 7.85 3.96<br />
Cost/kg<br />
ammonia-N<br />
abated<br />
£/kg/year)<br />
The capital costs of incre<strong>as</strong>ing the pig slurry storage capacity from 4 to 9 months<br />
were £43,750 and the capital costs of purch<strong>as</strong>ing a tanker and trailing hose machine<br />
87
£25,000. The investment in trailing hose application equipment w<strong>as</strong> <strong>as</strong>sumed<br />
necessary to allow the pig slurry to be applied evenly to growing crops without<br />
causing soil compaction and crop damage. The annual amortised repayment cost<br />
w<strong>as</strong> £3,500 for the extra slurry storage capacity (over 20 years) and £3,250 for the<br />
improved application equipment (over 10 years). Changing the slurry application<br />
timing from autumn to spring incre<strong>as</strong>ed the slurry fertiliser N replacement value (by<br />
reducing N leaching losses) of the pig slurry by £180 on the Cambridgeshire farm and<br />
£380/year on the E<strong>as</strong>t Yorkshire farm. Also, the fertiliser saving by reducing ammonia<br />
emissions through the use of bandspreading equipment w<strong>as</strong> equivalent to £230 per<br />
year on both farms. Hence, the net annual cost of changing the slurry application<br />
timing from autumn to spring w<strong>as</strong> £6,340 on the Cambridgeshire farm and £6,140 on<br />
the E<strong>as</strong>t Yorkshire farm. The costs of abating nitrate loss were equivalent to £14.09<br />
and £6.46/kg of nitrate-N saved on the Cambridgeshire and E<strong>as</strong>t Yorkshire farms,<br />
respectively. The cost of abating ammonia loss w<strong>as</strong> £5.60/kg of ammonia-N saved<br />
(Table 2).<br />
Cattle Slurry<br />
After autumn cattle slurry applications, estimated nitrate leaching losses were 1,890 kg<br />
N (i.e. 6,300 kg slurry N x 30% of total N applied) on the Devon farm, 1,070 kg N<br />
(6,300 kg slurry N x 17% of total N applied) on the Shropshire farm and 690 kg N<br />
(6,300 kg slurry N x 11% of total N applied) on the North Yorkshire farm (Table 2). The<br />
differences in nitrate losses between the model farms largely reflected differences in<br />
rainfall volumes (Table 1) and to a lesser extent se<strong>as</strong>onal differences in gr<strong>as</strong>s growth<br />
and drainage volumes. Ammonia emissions from the surface broadc<strong>as</strong>t applications<br />
were estimated at 2,720 kg (18% of N applied), compared with 1,900 kg from the<br />
bandspread applications (30% reduction compared with surface broadc<strong>as</strong>ting).<br />
At all three farms, the capital investment costs of incre<strong>as</strong>ing slurry storage from 3<br />
to 6 months (2,100m 3 to 4,200m 3 ) were £73,500 and the capital costs of purch<strong>as</strong>ing<br />
a tanker and trailing shoe machine were £25,000. The investment in trailing shoe<br />
application equipment will incre<strong>as</strong>e the number of days slurry can be spread without<br />
causing soil compaction and sward damage, and will reduce sward contamination.<br />
The annual amortised repayment cost w<strong>as</strong> £5,880 (over 20 years) for the incre<strong>as</strong>ed<br />
storage capacity and £3,250 (over 10 years) for the improved spreading equipment.<br />
The value of the nitrogen saved (through reduced N leaching losses) by changing the<br />
application timing from autumn to spring w<strong>as</strong> £760/year on the Devon Farm, £430/<br />
year on the Shropshire Farm and £280/year on the North Yorkshire farm. The saving<br />
in ammonia loss from bandspread slurry application on the three farms w<strong>as</strong> £330/<br />
year. The net costs of changing application timing practices from autumn surface<br />
broadc<strong>as</strong>t spreading to spring bandspreading were £8,040, £8,370 and £8,520/year<br />
on the Devon, Shropshire and North Yorkshire farms, respectively. The costs of<br />
abating nitrate loss were equivalent to £4.25, £7.85, £12.35/kg of nitrate-N saved on<br />
the Devon, Shropshire and North Yorkshire farms, respectively. The cost of abating<br />
ammonia loss w<strong>as</strong> £3.96/kg of ammonia-N saved on all three farms.<br />
88
INTEGRATED SLURRY N MANAGEMENT<br />
If Only Life W<strong>as</strong> So Simple…<br />
In our previous calculations, we <strong>as</strong>sumed that there were no interactions between<br />
the changes in manure management practices and nitrate leaching or ammonia<br />
volatilisation losses. However, there is emerging strong evidence that changing<br />
slurry application timings from autumn to spring/summer can alter the balance of<br />
N losses via ammonia volatilisation. For example, Williams et al. (2005a) showed in<br />
me<strong>as</strong>urements on the E<strong>as</strong>t Yorkshire model pig farm that the balance of N losses<br />
changed when pig slurry applications were moved from autumn to spring (Figure 1).<br />
After the March topdressed pig slurry application to a growing wheat crop (26% of<br />
total N applied), ammonia emissions were higher (P
Studies on a drained clay soil at Brimstone Farm in Oxfordshire (Williams et al.,<br />
2006) showed that when cattle slurry applications timings were moved from autumn<br />
to spring to reduce nitrate leaching losses, elevated ammonium-N concentrations<br />
of up to 3.9 mg/L NH 4<br />
-N (c. fivefold greater than the EC Freshwater Fish Directive<br />
limit of 0.78 mg/l NH 4<br />
-N) were me<strong>as</strong>ured in the spring drainage water flows. This<br />
w<strong>as</strong> because rainfall after the spring slurry application caused contaminated water<br />
to move rapidly from the ‘wet’ soil surface to pipe drains, via the network of soil<br />
macropores and mole drains in the heavy clay soil.<br />
Figure 2: Ammonia emissions after cattle slurry applications to gr<strong>as</strong>sland<br />
(Williams et al., 2005b)<br />
These data indicate that there is a need to recognise that slurry management practices<br />
that aim to reduce nitrate leaching losses by moving from autumn to spring/summer<br />
application timings, may exacerbate ammonia volatilisation losses under warmer<br />
and drier soil conditions, and incre<strong>as</strong>e the risks of other nutrient pollution of drainage<br />
waters from clay soils.<br />
Broiler Litter<br />
Assuming that all of the broiler litter w<strong>as</strong> previously applied in the autumn, nitrate<br />
leaching losses after surface broadc<strong>as</strong>t applications on the sandy soil Nottinghamshire<br />
farm were estimated at 9,650 kg N (equivalent to 13 % of total N applied). Changing<br />
the application timing from autumn to spring incre<strong>as</strong>ed the fertiliser N replacement<br />
value of the broiler litter by £3,860, <strong>as</strong> a result of reduced nitrate leaching losses.<br />
The capital cost of purch<strong>as</strong>ing a spreader that w<strong>as</strong> capable of applying broiler litter<br />
evenly and at agronomically required rates w<strong>as</strong> £22,000, giving an annual amortised<br />
repayment cost of £2,860 (over 10 years). Overall, the net benefit to the farm w<strong>as</strong><br />
£1,000/year. However, the practical problems of topdressing broiler litter to growing<br />
crops in spring (i.e. soil trafficability problems, non-compatibility of machine spread<br />
widths with tramline spacings and potential odour/fly nuisance) is likely to make<br />
such an application policy impractical on most farms. On suitable soil types, such<br />
<strong>as</strong> the sandy soils on the Nottinghamshire model farm, the rapid soil incorporation<br />
of broiler litter before the establishment of spring sown crops would reduce<br />
90
odour/fly nuisance and further incre<strong>as</strong>e the fertiliser N value of the broiler litter by<br />
minimising ammonia volatilisation losses. MANNER estimated that ploughing broiler<br />
litter into the soil within 24 hours of application would reduce ammonia emissions<br />
by c. 85% compared with leaving the manure on the soil surface. This incre<strong>as</strong>ed<br />
the potential fertiliser N replacement value of the broiler litter by a further £3,550/<br />
year. After autumn application, rapid soil incorporation would have little impact on<br />
the fertiliser N replacement value of the broiler litter because any of the saved N<br />
would subsequently be lost by overwinter nitrate leaching from the ‘leaky’ sandy soil<br />
(Chambers et al., 2001).<br />
CONCLUSIONS<br />
Considerable capital investment (between £3,500 and £5,880/year over 20 years)<br />
in extra slurry storage capacity w<strong>as</strong> required to change slurry application timings<br />
from autumn to spring on the model pig and dairy farms. The incre<strong>as</strong>ed fertiliser<br />
N replacement of the slurry <strong>as</strong> a result of the reduced nitrate leaching losses w<strong>as</strong><br />
modest at between £180 and £380/year on the pig farms, and £280 and £760/year on<br />
the dairy farms. The amortised (over 10 years) repayment cost of the bandspreading<br />
equipment w<strong>as</strong> c. £3,250/year on both the pig and dairy farms, compared with an<br />
annual benefit in incre<strong>as</strong>ed fertiliser N replacement value <strong>as</strong> a result of reduced<br />
ammonia losses of £230/year on the pig farms and £330/year on the dairy farms.<br />
The net costs of reducing nitrate leaching losses through the bandspreading of<br />
slurry in spring compared with autumn surface broadc<strong>as</strong>t applications ranged from<br />
£6.46 to £14.09/kg of nitrate-N abated on the pig farms, and £4.25 to £12.35/kg of<br />
nitrate-N abated on the dairy farms. The ammonia abatement costs were £5.60/kg<br />
of ammonia-N saved on the pig farms and £3.96/kg of ammonia-N saved on the<br />
dairy farms.<br />
On the broiler farm, reducing nitrate leaching losses by changing the manure<br />
application timing from autumn to spring incre<strong>as</strong>ed the fertiliser N value of the manure<br />
by £3,860/year. Moreover, the incre<strong>as</strong>ed fertiliser N value of spring applied broiler<br />
litter w<strong>as</strong> around £1,000 greater than the annual amortised repayment costs of a<br />
solid manure spreader capable of applying the broiler litter evenly to growing crops<br />
in spring, although this policy would not be a practical option in most c<strong>as</strong>es. Rapid<br />
soil incorporation of the spring applied broiler litter reduced ammonia volatilisation<br />
losses and incre<strong>as</strong>ed the fertiliser N replacement value by a further £3,550 compared<br />
with leaving the broiler litter on the soil surface.<br />
Recent research h<strong>as</strong> shown that changing slurry application timings from autumn to<br />
spring/summer is likely to affect other N loss pathways (so called ‘pollution swapping’).<br />
This highlights the need for an integrated approach to manure N management, so<br />
that management practices which aim to reduce nitrate leaching losses (i.e. moving<br />
from autumn application timings to spring/summer) do not exacerbate other N loss<br />
pathways, either through ammonia losses to air or ammonium-N and other nutrient<br />
losses in drainage waters from clay soils.<br />
ACKNOWLEDGEMENT<br />
Funding of this work by the UK Department for Environment, Food and Rural Affairs<br />
is gratefully acknowledged.<br />
91
REFERENCES<br />
Anon (2000). Fertiliser Recommendations for Agricultural and Horticultural Crops.<br />
Defra Reference Book 209 (Seventh Edition). The Stationery Office, Norwich.<br />
Chambers BJ Lord EI, Nicholson FA and Smith KA (1999). Predicting nitrogen<br />
availability and losses following application of organic manures to arable land:<br />
MANNER. Soil Use and Management 15, 137–143.<br />
Chambers BJ, Smith KA and Pain BF (2000). Strategies to encourage better use of<br />
nitrogen in animal manures. Soil Use and Management 16, 157–161.<br />
Chambers B, Nicholson N, Smith K, Pain B, Cumby T and Scotford I (2001). Managing<br />
Livestock Manures – Booklet 1. Making Better Use of Manures on Arable Land.<br />
ADAS, Gleadthorpe.<br />
Smith KA, Brewer AJ, Dauven A and Wilson DW (2000). A survey of the production<br />
and use of animal manures in the England and Wales I. Pig manure. Soil Use and<br />
Management 16, 124–132.<br />
Smith KA, Brewer AJ, Crabb J and Dauven A (2001). A survey of the production and<br />
use of animal manures in the England and Wales III. Cattle manures. Soil Use and<br />
Management 17, 77–87.<br />
Williams JR, Chambers BJ, Smith KA and Ellis S (2000). Farm manure land application<br />
strategies to conserve nitrogen within farming systems. In: Agriculture and W<strong>as</strong>te<br />
Management for a Sustainable Future (eds T Petchey, B D’Arcy and A Frost), pp167–<br />
179. The Scottish Agricultural College, Aberdeen.<br />
Williams JR, Sagoo E Chambers BJ and Bennett G (2005a). Minimising nitrogen losses<br />
from pig slurry applications to winter cereals. In: Proceedings of the International<br />
Workshop on Green Pork Production, pp. 99–100. INRA, France.<br />
Williams JR, Sagoo E, Chambers BJ, Laws J and Chadwick DR (2005b). Maximising<br />
slurry crop available nitrogen utilisation in gr<strong>as</strong>sland systems. In: Optimisation of<br />
Nutrient Cycling and Soil Quality for Sustainable Gr<strong>as</strong>slands (eds SC Jarvis, PJ Murray<br />
and JA Roker). Proceedings of a Satellite Workshop of the XXth International Gr<strong>as</strong>sland<br />
Congress, pp. 100. Wageningen Academic Publishers. ISBN 9076998728.<br />
Williams JR, Sagoo E, Chambers BJ, Cross RB, Short J and Hodgkinson RA (2006).<br />
Nitrogen losses following cattle slurry applications to a drained clay soil. Proceedings<br />
of the SAC/SEPA Conference: Managing Rural Diffuse Pollution, 5-6 April 2006,<br />
Edinburgh (this publication).<br />
92
A MEASURE-CENTRIC APPROACH TO DIFFUSE<br />
POLLUTION MODELLING AND COST-CURVE ANALYSIS<br />
OF MITIGATION MEASURES<br />
DR Chadwick 1 , BJ Chambers 2 , S Anthony 3 , S Granger 1 , PM Haygarth 1 , D Harris 3<br />
and K Smith 3<br />
1<br />
IGER, North Wyke Research Station, Okehampton, Devon, EX20 2SB, UK, E-mail:<br />
david.chadwick@bbsrc.ac.uk; 2 ADAS, Gleadthorpe, Meden Vale, Mansfield, Notts,<br />
NG20 9PF, UK; 3 ADAS, Wolverhampton, Woodthorne, Wolverhampton, WV6 8TQ,<br />
UK<br />
SUMMARY<br />
A new model framework h<strong>as</strong> been developed that explicitly represents the mode<br />
of action of individual mitigation me<strong>as</strong>ures for reducing diffuse water pollution. This<br />
me<strong>as</strong>ure centric framework is termed the ‘Cost-Cube’. The model represents the<br />
functional behaviour of pollutants and the <strong>as</strong>sociated processes and pathways<br />
that can be affected by remediation me<strong>as</strong>ures. It is b<strong>as</strong>ed on an export coefficient<br />
approach but extended to provide explicit fractions of the total pollutant loss by<br />
unique <strong>as</strong>pects of the source, mobilisation and transport dimensions. This framework<br />
w<strong>as</strong> used to explore mitigation options for ammonium, nitrite, biological oxygen<br />
demand, and pathogens in terms of their economics and applicability for a number<br />
of model farm systems. A cost benefit analysis w<strong>as</strong> used to prioritise me<strong>as</strong>ures that<br />
work within the bounds of current agricultural practice.<br />
INTRODUCTION<br />
Protection of water quality requires implementation of land management options that<br />
reduce the totality of contributors to diffuse pollution including transfers of nutrients,<br />
sediment, organic matter, agrochemicals and potentially pathogenic organisms. To<br />
do this effectively, we require an understanding of the key behavioural characteristics<br />
of diffuse pollutant groups and the potential for targeting of me<strong>as</strong>ures. We have<br />
developed a new conceptual modelling framework that represents the mode of<br />
action of mitigation me<strong>as</strong>ures for reducing diffuse pollution, and we have coupled<br />
this to a cost-curve analysis. In this paper, we present the parameterisation and<br />
application of this ‘me<strong>as</strong>ure-centric’ framework, <strong>as</strong> well <strong>as</strong> the ultimate deliverable, a<br />
cost-curve analysis of mitigation me<strong>as</strong>ures.<br />
MATERIALS AND METHODS<br />
Model Framework<br />
A new conceptual modelling framework w<strong>as</strong> developed to explicitly represent the<br />
mode of action of individual me<strong>as</strong>ures. This me<strong>as</strong>ure centric framework w<strong>as</strong> centred<br />
on the ‘Cost-Cube’, an enhanced export coefficient model with three dimensions<br />
of pollutant source, mobilisation and transport (see, for example, RPA, 2003). The<br />
Cost-Cube explicitly represents the proportions of pollutant loss due each type of<br />
source, process of mobilisation and path of transport (Figure 1). These are referred<br />
to <strong>as</strong> the <strong>as</strong>pects of each dimension. For example, the mobilisation dimension is<br />
separated into the processes of solubilisation, detachment and contingent losses<br />
93
(Haygarth and Jarvis, 1999). The volume of the cost-cube is proportional to the total<br />
pollutant loss. If each combination of dimension and <strong>as</strong>pect is equally important in<br />
contributing to the observed pollutant loss, then the Cost-Cube is made up of 27<br />
equally sized cubes.<br />
MOBILISATION<br />
Contingent<br />
S olubilis able<br />
Detachment<br />
Internal<br />
External<br />
Recycled<br />
SOURCE<br />
Surface<br />
Preferential<br />
Through<br />
TRANSPORT<br />
Figure 1: Dimensions and <strong>as</strong>pects of the Cost-Cube model<br />
A control me<strong>as</strong>ure that reduces pollutant losses can be visualised <strong>as</strong> targeting one or<br />
more of the cubes, reducing their volume and hence the magnitude of total pollutant<br />
loss, i.e. the sum of all the cube volumes. For example, a me<strong>as</strong>ure that affects animal<br />
diet to reduce the quantity of pollutant excreted will reduce the volume of all cubes<br />
on the recycled-source <strong>as</strong>pect dimension. A me<strong>as</strong>ure that involved careful spreading<br />
of animal manure to minimise losses by surface run-off will reduce the volume of<br />
all cubes on the recycled-source and surface-transport <strong>as</strong>pect dimensions. A farm<br />
system can be represented by one or more Cost-Cubes, making explicit the total<br />
pollutant loss and the relative importance of the pollutant pathways.<br />
Data in the literature were used to characterise control me<strong>as</strong>ures by their costs and<br />
percentage efficiencies. Each me<strong>as</strong>ure w<strong>as</strong> <strong>as</strong>signed a target area on the Cost-<br />
Cube, using the dimension and <strong>as</strong>pect co-ordinate system, explicitly representing<br />
their mode of action in the me<strong>as</strong>ure centric framework. This information w<strong>as</strong> then<br />
used by a mathematical sub-model to calculate the best order of implementation<br />
of the me<strong>as</strong>ures with the objective of achieving maximum pollution reduction for<br />
minimum cost. Such a calculation of the ‘cost-curve’ <strong>as</strong>sumes that me<strong>as</strong>ure effects<br />
are multiplicative.<br />
Parameterisation<br />
The Cost-Cube model can be parameterised using the output from mechanistic<br />
models or by summarising empirical data and expert opinion. In our approach,<br />
experts were <strong>as</strong>ked, for example, to estimate the proportion of the total pollutant loss<br />
due to detachment or solubilisation processes of mobilisation. Careful and iterative<br />
questioning, together with group discussions and review, allowed us to define expert<br />
expectations of the relative importance of each <strong>as</strong>pect of the pollutant source,<br />
94
mobilisation and transport dimensions of the Cost-Cube model. This can potentially<br />
become an involved process when investigating many combinations of environmental<br />
conditions. Therefore, a simple mathematical sub-model of the pollutant vectors (the<br />
mobilisation or transport mechanisms, such <strong>as</strong> over land flow and soil erosion) w<strong>as</strong><br />
also used to interpolate data from a reference environment condition to other site<br />
situations. For example, the quantity of pollutant lost in overland flow due to soil<br />
detachment w<strong>as</strong> scaled in proportion to the ratio of the modelled quantity of eroded<br />
soil at the reference and target locations.<br />
Cube Name:<br />
Ammonium<br />
Cube Des cription:<br />
Ammonium Loss at [Heavy : Arable : Dry : Drained]<br />
Cube E xport Coefficient: 1.00<br />
Active:<br />
TRUE<br />
Cost-Cube Dimensions / Aspects (R elative Proportions)<br />
S OUR CE Internal E xternal R ecycled<br />
0.10 0.45 0.45<br />
MOB ILIS ATION Internal E xternal R ecycled<br />
Detachment 0.05 0.00 0.00<br />
S olubilisation 0.95 0.10 0.10<br />
Contingent 0.00 0.90 0.90<br />
PATHWAY Detachment S olubilisation Contingent<br />
Surface 0.23 0.20 0.20<br />
Preferential 0.77 0.75 0.80<br />
Through 0.00 0.05 0.00<br />
Figure 2: Expert <strong>as</strong>sessment of the contribution of each Cost-Cube<br />
dimension and <strong>as</strong>pect to the total loss of ammonium under the<br />
reference environment condition indicated under Cube Description<br />
For this study, the reference environment condition w<strong>as</strong> defined <strong>as</strong> a drained clay<br />
loam soil, under arable cultivation, located in the e<strong>as</strong>t of England. The field w<strong>as</strong><br />
characterised <strong>as</strong> having a gentle slope (1 o ) and subjected to an average annual<br />
rainfall of 650 mm and potential evapotranspiration of 580 mm. The vector model<br />
calculated that there would be 12 mm of surface run-off (at the field scale), 69 mm of<br />
preferential flow and 122 mm of through flow annually (total drainage equals 204 mm).<br />
This w<strong>as</strong> <strong>as</strong>sociated with an average total sediment loss of 220 kg annually. The<br />
reference pollutant source w<strong>as</strong> defined by inputs of a spring application of 150 kg/<br />
ha of ammonium nitrate fertiliser and 50 t/ha of stored cattle slurry. The slurry w<strong>as</strong><br />
described <strong>as</strong> having a dry matter content of 6% and an available nitrogen content<br />
(after volatilisation losses) of 50 kg of nitrogen.<br />
Figure 2 shows the results of the expert parameterisation for this reference for<br />
ammonium loss. A similar parameterisation w<strong>as</strong> also carried out for BOD, pathogens<br />
and nitrite. For each pollutant, the principal sources were fertilisers (external <strong>as</strong>pect)<br />
and manure (recycled <strong>as</strong>pect), and the principal mechanisms of mobilisation were<br />
solubilisation and contingent or incidental losses. The dominant transport pathway<br />
w<strong>as</strong> preferential flow in the cracks and tile drainage.<br />
95
Application<br />
Representative farm systems were used for application of the Cost-Cube framework.<br />
For each farm system, the total livestock numbers, crop are<strong>as</strong> and manure production<br />
were defined (Table 1). These farm type definitions were b<strong>as</strong>ed on those used in a<br />
previous project (Chambers, 2002). The vector model w<strong>as</strong> then used to calculate total<br />
pollutant losses for different combinations of climate, soil drainage and soil texture<br />
acting upon each farm system. These combinations were chosen to represent the<br />
range of environment conditions in England and Wales, including sandy loam and<br />
clay loam soils, and low (650 mm) and high (1100 mm) annual rainfall locations.<br />
For each farm system, a list of applicable pollutant control me<strong>as</strong>ures w<strong>as</strong> drawn from<br />
a review of potential mitigation me<strong>as</strong>ures, and the annual cost of implementation<br />
calculated in proportion to land area, livestock numbers and quantity of managed<br />
manure. Whole farm costs for the dairy system were calculated <strong>as</strong> being <strong>as</strong> low<br />
<strong>as</strong> £500 per year for me<strong>as</strong>ures that reduced pollutant losses by activities that can<br />
be equated with good agricultural practice. For example, the avoidance of slurry<br />
spreading on hydrologically well-connected field margins, or avoiding grazing<br />
high-risk fields on wet days. However, the field evidence for the efficiency of these<br />
me<strong>as</strong>ures in reducing pollutant mobilisation and delivery is variable and confidence<br />
in their effect is low. In contr<strong>as</strong>t, there are other me<strong>as</strong>ures which if implemented<br />
are known to be guaranteed to reduce potential pollutant inputs but which are also<br />
very costly. For example, the reduction of dietary nitrogen intake or the removal of<br />
mineral fertiliser from the system costs £10,000 and £50,000 per year, respectively.<br />
For the arable system, the costs of mobilisation and delivery control me<strong>as</strong>ures were<br />
generally calculated to be higher due to the greater land area, and the greatest<br />
costs were <strong>as</strong>sociated with either the removal or change in type of mineral fertiliser<br />
applications.<br />
Table 1:<br />
Summary of the attributes allocated to each Representative Farm<br />
System in the modelling process<br />
Farm System<br />
Dairy (gr<strong>as</strong>s)<br />
Animal<br />
count<br />
270<br />
Excreta<br />
(t/year)<br />
5,040<br />
Managed<br />
manure (%)<br />
60<br />
Field area<br />
(ha)<br />
150<br />
Fertiliser<br />
(kg N/ha)<br />
190<br />
Breeding pigs (indoor)<br />
1,330<br />
2,125<br />
100<br />
70.5<br />
145<br />
Broilers<br />
150,000<br />
2,500<br />
100<br />
436.7<br />
145<br />
Arable<br />
-<br />
-<br />
-<br />
300<br />
165<br />
For the broiler system, with the exception of feed antibiotics, the greatest costs were<br />
taken to be <strong>as</strong>sociated with the changes in management of the large arable land<br />
area required for the spreading of the litter. However, it w<strong>as</strong> also considered that<br />
there w<strong>as</strong> the potential to save £42,700 per year by the proper accounting of the<br />
nutrient value of the litter and reducing the mineral fertiliser applications. Such a<br />
saving could potentially off-set some of the lesser me<strong>as</strong>ure costs, such <strong>as</strong> improved<br />
manure application timing, and thereby produce a net environmental and economic<br />
benefit. A similar situation w<strong>as</strong> taken to exist for the indoor breeding pig system. Due<br />
to manure being managed <strong>as</strong> slurry rather than solids, it w<strong>as</strong> considered that there<br />
96
w<strong>as</strong> a potentially valuable option involving the aeration of slurry to provide medium<br />
(good) efficiency for ammonium, nitrite and BOD and also low (poor) efficiency for<br />
pathogens. However, it should be noted that some of the slurry management options<br />
(such <strong>as</strong> slurry injection) that might be implemented to reduce g<strong>as</strong>eous ammonia<br />
losses have also been shown to have negative effects on the loss of all pollutants.<br />
This would need to be taken account in any cost-curve analyses that considered a<br />
broader range of pollutants.<br />
RESULTS<br />
The cost-curve sub-model w<strong>as</strong> used to identify the optimal suite of me<strong>as</strong>ures for each<br />
representative farm system. Table 2 provides a sample set of results for the control of<br />
ammonium losses from the dairy system. Table 2 shows the generic form of a costcurve,<br />
with incre<strong>as</strong>ing ratio of cost to benefit <strong>as</strong> more me<strong>as</strong>ures are implemented<br />
on the farm. In this example, money is initially saved by taking advantage of the<br />
nutrient content of manure to reduce fertiliser applications. Me<strong>as</strong>ures controlling the<br />
timing and placement of manure are next, with a modest but cheap reduction in<br />
pollutant loss. The most expensive me<strong>as</strong>ures, such <strong>as</strong> reducing stock count (and<br />
hence farm revenue), are implemented l<strong>as</strong>t. They apparently have minimal effect in<br />
reducing pollutant loss because the preceding me<strong>as</strong>ures have already significantly<br />
reduced losses.<br />
Table 3 provides a summary of the overall results of the cost-curve calculations<br />
and key me<strong>as</strong>ure-centric options for diffuse pollution mitigation. Table 3 highlights<br />
for each Representative Farm System the abatement me<strong>as</strong>ures that were most<br />
frequently implemented first (in the top five) in the ordered cost-curve. The me<strong>as</strong>ures<br />
implemented first were those with greatest ratio of benefit to cost, i.e. they were the<br />
most cost effective. They are characterised by relatively low cost and common sense<br />
solutions that work within the bounds of current agricultural practice. For example,<br />
the integration of manures with fertilisers when planning nutrient applications and<br />
avoiding spreading fertiliser at times of high risk. The me<strong>as</strong>ures that were le<strong>as</strong>t<br />
attractive (implemented l<strong>as</strong>t) were those that have a fundamental impact on the<br />
income and raison d’être of the farm system, for example, reduction of stocking<br />
rates or taking land out of production.<br />
97
Table 2:<br />
Modelled cost-curve for the control of ammonium pollution from the<br />
model dairy system (Model 1) averaged across each of the climate,<br />
drainage and soil texture Cost-Cube scenarios<br />
Cost-step Me<strong>as</strong>ure description Pollutant Annual Cost (£)<br />
loss (%)<br />
0 B<strong>as</strong>eline 100 0<br />
1 Integrate fertiliser with manure 77 -8,467<br />
2 Introduce clover to gr<strong>as</strong>sland system 72 -10,782<br />
3 Do not apply slurry to well connected are<strong>as</strong> 62 -10,499<br />
4 Avoid grazing high-risk fields when wet 58 -10,349<br />
5 Establish artificial wetland 44 -8,515<br />
6 Change fertiliser type 34 -6,622<br />
7 Allow drainage to deteriorate 30 -5,122<br />
8 Avoid slurry spreading at times of high risk 25 -1,816<br />
9 Reduce dietary nitrogen intake 17 9,014<br />
10 Do not apply fertiliser to well-connected are<strong>as</strong> 16 10,949<br />
11 Export 50% of slurry 14 16,593<br />
12 Aeration of slurry 12 22,994<br />
13 Install hedges and reduce field size 11 33,288<br />
14 Establish a riparian strip 10 38,054<br />
15 Reduce stock count 8 88,663<br />
16 Avoid fertiliser spreading at times of high risk 8 103,663<br />
17 Reduce field stock rates when wet 8 111,983<br />
18 Batch storage of slurry 8 132,093<br />
19 Use slowly available nitrogen fertiliser 8 187,098<br />
DISCUSSION<br />
The Cost-Cube framework is a highly flexible and valuable tool for ranking potential<br />
control me<strong>as</strong>ures in the development of catchment sensitive management plans.<br />
The explicit representation of the mode of action of me<strong>as</strong>ures, and the potential to<br />
use both empirical data and expert opinion, gives it potential value <strong>as</strong> a decision<br />
tool for reaching a consensus about pollution source and mitigation in stakeholder<br />
discussions. The use of this approach h<strong>as</strong> also highlighted the need for further field<br />
investigations to refine the efficiency values of the ‘top five’ me<strong>as</strong>ures, <strong>as</strong> these<br />
are considerably less precise than their financial costs and especially sensitive to<br />
location. Further details of the effects of artificial wetlands and management of the<br />
hydrological connectivity of drained cracking clay soils would be clear priorities in this<br />
regard. This modelling approach also h<strong>as</strong> the potential to be linked to a Geographic<br />
Information System (GIS) to provide national coverage and could also be used to<br />
optimise for mitigation of multiple pollutants simultaneously.<br />
Further development of such cost benefit analyses should also take account of the<br />
potential externalities of pollution control. For example, there would be additional<br />
benefits to reducing nitrogen and phosphorus fertiliser use in terms of reducing<br />
greenhouse g<strong>as</strong> emissions through a reduction in energy required to manufacture<br />
98
inorganic fertiliser. Or there would be the potential of a more bio-diverse landscape <strong>as</strong><br />
a result of reduced nutrient input and reduced animal stocking rate with an <strong>as</strong>sociated<br />
incre<strong>as</strong>e in visitor numbers making use of the cleaner environment for recreation. The<br />
costs of such additional benefits should be included in the final cost-benefit analyses<br />
used to select me<strong>as</strong>ures to reduce diffuse water pollution to agriculture.<br />
Table 3:<br />
List of abatement me<strong>as</strong>ures that were most frequently in the first<br />
five to be implemented in the calculation of each representative<br />
farm system cost-curve. These are drawn from across all the soil,<br />
drainage and climatic conditions used in the calculations for all<br />
pollutants<br />
Dairy system Arable system Broiler system Pig system<br />
Establish artificial<br />
wetland<br />
Do not apply<br />
slurry/manure to<br />
well-connected<br />
hydrological are<strong>as</strong><br />
Allow drainage to<br />
deteriorate<br />
Integrate fertiliser<br />
with manure<br />
Introduce clover to<br />
gr<strong>as</strong>sland system<br />
ACKNOWLEDGEMENTS<br />
Establish artificial<br />
wetland<br />
Allow drainage to<br />
deteriorate<br />
Change fertiliser type<br />
Cultivate land to<br />
reduce hydrological<br />
connectivity<br />
Do not apply fertiliser<br />
to well-connected<br />
hydrological are<strong>as</strong><br />
Batch store litter<br />
Do not apply<br />
slurry/manure to<br />
well-connected<br />
hydrological are<strong>as</strong><br />
Avoid manure<br />
spreading at times of<br />
high risk<br />
Export 50% of<br />
manures to other<br />
farms<br />
Integrate fertiliser<br />
with manure<br />
We acknowledge the financial support provided by Defra.<br />
REFERENCES<br />
Export 50% of<br />
manures to other<br />
farms<br />
Establish artificial<br />
wetland<br />
Do not apply<br />
slurry/manure to<br />
well-connected<br />
hydrological are<strong>as</strong><br />
Integrate fertiliser<br />
with manure<br />
Change fertiliser type<br />
Chambers BJ (2002). Environmental Impacts of Solid and Liquid Manure Systems.<br />
Final Report to Defra. (Project NT2010) 32 pp.<br />
http://www2.defra.gov.uk/research/project_data<br />
Haygarth PM and Jarvis SC (1999). Transfer of phosphorus from agricultural soils.<br />
Advances in Agronomy 66, 165–249.<br />
RPA (2003). Water Framework Direction – indicative costs of agricultural me<strong>as</strong>ures.<br />
Defra Project Report. Risk Policy Analysts Limited, Norfolk.<br />
99
ASSESSING THE SIGNIFICANCE OF DIFFUSE<br />
POLLUTION RISKS IN ORDER TO TARGET AND<br />
PRIORITISE BEST MANAGEMENT PRACTICES<br />
AH Sinclair 1 , A Frost 2 , A Vinten 3 , P Chapman 4 and J MacDonald 5<br />
1<br />
SAC Environmental, Craibstone, Aberdeen, AB21 9YA, UK, E-mail: alex.sinclair@<br />
sac.co.uk; 2 Soil and Water, Scotland, 4 Bayswell Road, Dunbar, EH42 1AB, UK; 3 The<br />
Macaulay Institute, Craigiebuckler, Aberdeen, AB15 8QH, UK; 4 SAC Farm Business<br />
Services, Thainstone Agricultural Centre, Inverurie, AB51 9WU, UK; 5 SEPA, Erskine<br />
Court, The C<strong>as</strong>tle Business Park, Stirling, FK9 4TR<br />
SUMMARY<br />
A targeted approach that focuses on sensitive catchments, such <strong>as</strong> Nitrate Vulnerable<br />
Zones and Bathing Water catchments, is described. Farm audits that consider diffuse<br />
pollution issues <strong>as</strong> a three-stage process, and a treatment train approach to BMP<br />
implementation at each stage in the process are recommended. A simple conceptual<br />
framework for evaluating pollution control me<strong>as</strong>ures is set out and an example of<br />
cost-effectiveness and cost benefit analysis of a buffer strip to reduce total P loading<br />
to Loch Leven is given. Setting up a datab<strong>as</strong>e giving information for each farm type,<br />
on source strength per pollutant, potential mitigation me<strong>as</strong>ures, cost-effectiveness,<br />
loadings mitigated and time scale for efficacy is recommended. A policy matrix, i.e.<br />
a summary of recommended me<strong>as</strong>ures, prioritised and categorised into proposed<br />
appropriate levels of regulation, for mapping of on-farm me<strong>as</strong>ures against policy<br />
instruments, voluntary me<strong>as</strong>ures and potential General Binding Rules (GBRs), etc.<br />
is also proposed.<br />
INTRODUCTION<br />
Agriculture is the predominant land use in Scotland, and it h<strong>as</strong> been identified <strong>as</strong><br />
presenting a significant threat to achieving good water status. Forestry is also a major<br />
land use, and it may also place certain water bodies at risk. The consultation paper<br />
‘Diffuse Water Pollution from Rural Land Use’ (Scottish Executive, 2005a) outlines<br />
the current strategy for the control of diffuse pollution. A tiered system of controls<br />
is proposed, developed along similar lines to the Water Environment (Controlled<br />
Activities) Regulations 2005 http://www.scotland.gov.uk/Consultations/Current/Q/<br />
rowId/-1#conRow0National. General Binding Rules (GBRs) provide national general<br />
authorisation for those farming activities posing a threat to water quality and will<br />
be b<strong>as</strong>ed on b<strong>as</strong>ic levels of good practice. While this is expected to bring about<br />
improvements, the paper indicates that there would still be problems <strong>as</strong>sociated with<br />
certain pollutants in some catchments. For these are<strong>as</strong> the Executive envisages that<br />
the national Rules would be supplemented by a set of targeted GBRs to apply to<br />
particular land use activities. At the same time, through Land Management Contracts<br />
involving more targeted supportive me<strong>as</strong>ures, the Executive is expected to make<br />
available incentives to promote good practice aimed at achieving good water quality<br />
in Scotland’s rivers, lochs and co<strong>as</strong>tal waters. In some c<strong>as</strong>es change is already<br />
taking place to bring about improvements in the protection of the water environment<br />
through good practice, developed and promoted via the PEPFAA Code (Scottish<br />
Executive, 2005b) and The 4 Point Plan (Scottish Executive, 2004), and by regulation<br />
100
within sensitive catchments. The aim of this paper is to review recent work <strong>as</strong>sessing<br />
the significance of diffuse pollution risks, and to propose a framework for carrying<br />
out farm-scale audits and evaluating and selecting pollution control me<strong>as</strong>ures and<br />
identifying opportunities for knowledge transfer.<br />
Assessing the Significance of Diffuse Pollution Risks<br />
A detailed characterisation <strong>as</strong>sessment of pressures and impacts on the water<br />
environment h<strong>as</strong> been carried out for both the Scotland and Solway-Tweed River<br />
B<strong>as</strong>in Districts (SEPA, 2005a). Diffuse pollution placed up to 45% of the water<br />
bodies in Scotland at risk of not meeting the Water Framework Directive (WFD)’s<br />
environmental objectives. Agriculture w<strong>as</strong> clearly shown to be the major pressure<br />
although not invariably the most severe. SEPA will use these results to prioritise<br />
both environmental monitoring and those water bodies where management action<br />
is required. Further characterisation to refine the risk <strong>as</strong>sessments is ongoing and<br />
will be published by SEPA in the Significant Water Management Issues Report, <strong>as</strong><br />
required by WFD, in mid-2007 (Morris et al., 2006).<br />
A screening tool for diffuse pollutants h<strong>as</strong> been developed (Anthony et al., 2005)<br />
to supplement the risk <strong>as</strong>sessment described above. This h<strong>as</strong> allowed sources of<br />
pollutants from agriculture, forestry, urban run-off, roads, septic tanks and sewage<br />
discharges to be estimated. The methods used were generally b<strong>as</strong>ed upon existing<br />
indicators of relative pollution risk that are appropriate for application at the regional<br />
and national scale, rather than detailed mechanistic modelling. The models also<br />
developed approaches that had previously been applied in the UK, including elements<br />
of the NIRAMS (Nitrogen Risk Assessment Model for Scotland) model of nitrate<br />
leaching and the PSYCHIC model (Phosphorus and Sediment Yield Characterisation<br />
in Catchments) (Withers et al., 2006). Phosphorus losses resulted in the greatest land<br />
area designated at risk and were primarily <strong>as</strong>sociated with agriculture. The report<br />
concluded ‘the screening tool outputs can be used to target additional monitoring<br />
in are<strong>as</strong> at high risk’ and ‘ultimately the development of targeted and effective<br />
catchment management plans to meet the needs of the WFD’.<br />
With the initial diffuse pollution characterisation and impacts analysis now complete,<br />
and the monitoring programmes about to be implemented, attention must now turn<br />
to the setting of environmental objectives and the targeting and prioritising of a<br />
programme of best management practices (BMPs) at a farm scale to minimise the<br />
significance of diffuse pollution.<br />
Targeting and Prioritising BMPs at a Farm Scale<br />
Determining the siting and suitability of BMPs requires a structured approach:<br />
1. Most importantly the diffuse pollution risks must be prioritised in light of a diffuse<br />
pollution audit, because appropriate BMPs will first and foremost be determined<br />
by the problem and will be very different, for example, for eutrophied lochs than<br />
for bathing water catchments.<br />
2. BMPs appropriate to the risks identified must be selected.<br />
3. Other factors must be taken into account, such <strong>as</strong> cost-effectiveness, habitat<br />
benefits and the likely level of BMP participation across a catchment.<br />
101
In the absence of data on the source strengths of pollutant loads prioritisation will<br />
undoubtedly be subjective to some degree. However, the methodology of impact<br />
prediction developed for Environmental Impact Assessment (EIA) provides a relatively<br />
objective framework to support the decision-making process. This method aims<br />
to <strong>as</strong>sess the significance of impacts on the environment b<strong>as</strong>ed on most notably<br />
the sensitivity of the environmental resource, and the perceived magnitude of the<br />
impacts on that resource. The process avoids any sort of numerical scoring, and<br />
still requires a good deal of re<strong>as</strong>oned professional judgement, but can be used to<br />
determine broad significance ‘thresholds’ which allow prioritisation of mitigation<br />
me<strong>as</strong>ures (Table 1).<br />
Table 1:<br />
Significance b<strong>as</strong>ed on sensitivity of receptor and magnitude of<br />
impact<br />
Magnitude<br />
Sensitivity<br />
Low Medium High<br />
High Moderate Substantial Substantial<br />
Medium Slight Moderate Substantial<br />
Low Slight Slight Moderate<br />
SEPA recently commissioned the preparation of three linked documents in order<br />
to provide a systematic methodology for identifying farm scale diffuse pollution<br />
and for implementing strategies to alleviate problems (SEPA, 2006). The first part,<br />
‘Farm scale diffuse pollution audits’, sets out a methodology for carrying out diffuse<br />
pollution audits on farms and includes standard audit forms to aid this process.<br />
The second part, ‘Siting and suitability of BMPs’ sets out guidance on selection of<br />
suitable mitigation me<strong>as</strong>ures for problems identified in the audit. The third part, the<br />
‘BMP Manual’ contains descriptions of a wide range of possible BMPs to address<br />
diffuse pollution issues organised in a way to facilitate selection. The guidance is<br />
meant to help those charged with addressing agricultural diffuse pollution issues<br />
in practice. It will prove useful to catchment management planners in priority or<br />
problem catchments, to regulators, and to advisors and consultants to farmers <strong>as</strong><br />
they try to comply with a support regime that will incre<strong>as</strong>ingly stress environmental<br />
protection in compliance with government policy. Launching the guidance on the<br />
web will allow field advisers to pilot and amend where necessary, before publishing<br />
the hardcopy and CD.<br />
Sensitivity<br />
For the purposes of <strong>as</strong>sessing diffuse pollution impacts, the sensitivity of the<br />
environmental resource and the likely magnitude of the impact must be considered<br />
for each pollutant in turn. Sensitivity may be determined at a catchment scale or<br />
by some factor specific to the farm (e.g. the presence of a neighbouring designated<br />
site or the soils present on the farm). Before undertaking any work in the field, an<br />
<strong>as</strong>sessment should be made of the catchment containing the farms in question.<br />
Certain catchments will be more sensitive to certain pollutants and it is important<br />
that an appreciation of such sensitivity is built into the subsequent field work. Some<br />
catchments will be more prone to certain types of diffuse pollution and this should<br />
be borne in mind when surveying. A targeted approach that focuses on ‘priority<br />
catchments’ is proposed such that the accumulative benefit of adopting BMPs can<br />
be gained and effectiveness me<strong>as</strong>ured. Examples are given below:<br />
102
Nitrate Vulnerable Zones (NVZs)<br />
In Scotland, 14% of the land area is designated <strong>as</strong> NVZs. These are located in<br />
Aberdeenshire, Moray, Banff and Buchan; Strathmore and Fife; Lothians and the<br />
Borders; and Lower Nithsdale. The European Nitrates Directive 91/676/EEC requires<br />
legally binding rules to be put in place for NVZs to reduce nitrate loss from agricultural<br />
land when nitrate levels exceed, or are likely to exceed, the levels set in the Directive.<br />
These rules are known <strong>as</strong> Action Programmes. Action Programme me<strong>as</strong>ures in NVZs<br />
in Scotland require that a fertiliser and manure plan to <strong>as</strong>sess N fertiliser requirement<br />
for each crop and field is prepared and implemented; N must not be applied in excess<br />
of crop need; organic manure applications must not exceed specified N limits; and<br />
closed periods when slurry and poultry manure shall not be applied to any land<br />
that h<strong>as</strong> a sandy or shallow soil (Scottish Executive, 2003). SAC estimated in the<br />
Regulatory Impact Assessment that these me<strong>as</strong>ures could reduce nitrate leaching in<br />
the NVZs by up to 3,580 tonnes N/annum (Oglethorpe et al., 2002).<br />
The Nitrates Directive requires the Action Programme to be reviewed periodically.<br />
Ahead of the next review (2006), the European Commission h<strong>as</strong> challenged the UK’s<br />
implementation of the Nitrates Directive. The Commission h<strong>as</strong> identified several<br />
<strong>as</strong>pects of the existing Action Programme that it wishes the UK to address. The<br />
major issues affect livestock farms, and relate to the farm-b<strong>as</strong>ed limit on livestock<br />
excretal returns; and the extension of the closed period for spreading slurry and<br />
poultry manure with <strong>as</strong>sociated requirement for incre<strong>as</strong>ed storage. The Commission<br />
h<strong>as</strong> also identified the need to be sure what the upper N fertiliser limits are and there<br />
needs to be some maximum. The Scottish Executive is preparing a consultation<br />
paper, expected in February 2006, proposing changes to the 2003 NVZ Action<br />
Programme Regulations. Recent changes in economics including CAP reform have<br />
already introduced changes to agricultural practice that on balance are expected to<br />
reduce nitrate leaching independently of the provisions of the Action Programme. The<br />
expected incre<strong>as</strong>e in conversion of arable land to extensively-managed, permanent<br />
green cover; and the reductions in economic optimum N fertiliser requirement due to<br />
higher N fertiliser costs and continuing low commodity price will also contribute.<br />
Designated Bathing Waters<br />
Faecal coliforms and faecal Streptococci from agriculture contribute too many of the<br />
60 designated bathing waters in Scotland failing the EC Bathing Water standards,<br />
especially in the South West of the country (Ayrshire, Dumfries and Galloway).<br />
Merrilees et al. (2004) and Aitken et al. (2004) reported on a SEERAD-funded project<br />
to deliver capital works me<strong>as</strong>ures and farm-specific BMPs to reduce the potential risk<br />
of faecal indicator organism (FIO) contamination from livestock farms to rivers. Fortyeight<br />
farms were surveyed in four sensitive river catchments draining into bathing<br />
waters in the south, west and north co<strong>as</strong>t of Scotland. FIO bacteria from farmland<br />
potentially impacted all the rivers. W<strong>as</strong>te storage facilities, farming practices, field<br />
conditions, grazing management and risks of FIO contamination to watercourses<br />
were <strong>as</strong>sessed on each farm and BMPs were designed, costed, implemented and<br />
monitored. With only nine farms, Brighouse Bay w<strong>as</strong> an ideal place to establish and<br />
monitor BMPs and <strong>as</strong>sess any improvement in water quality. The main aim w<strong>as</strong><br />
to determine to what extent improved farm practices and BMPs could contribute<br />
to improved water quality in the catchment (Dickson et al., 2005; Merrilees et al.,<br />
2006).<br />
103
Magnitude of Impacts<br />
The magnitude of each diffuse pollution impact is less likely to be determined by<br />
overall catchment characteristics and more by individual farming practice and<br />
dependant on the problems and other features specific to the farm that will be<br />
highlighted by a farm scale diffuse pollution audit.<br />
Significance<br />
Once sensitivities and magnitudes have been <strong>as</strong>sessed, the matrix approach shown<br />
in Table 1 allows an appraisal of the overall significance of different pollution risks,<br />
e.g. nitrate.<br />
A farm with predominantly sandy or shallow soils within an NVZ (HIGH sensitivity),<br />
where more than 50% of land is ploughed and cropped in autumn (HIGH magnitude),<br />
would be expected to have a SUBSTANTIAL risk of nitrate diffuse pollution into<br />
groundwater.<br />
A mixed beef and spring cropping farm (LOW magnitude), with predominantly heavy<br />
soils outwith an NVZ (LOW sensitivity), would be expected to have a SLIGHT risk of<br />
nitrate diffuse pollution and would therefore be a lower priority for nitrate-targeted<br />
BMPs.<br />
By carrying out this type of appraisal for each diffuse pollutant, the pollutants can be<br />
prioritised and BMP selection can proceed.<br />
Farm Audits<br />
An audit of potential sources of diffuse pollution on the farm is carried out. This is<br />
done partly by interviewing the farmer and collecting data from him and partly by<br />
walking the farm and farm steading and observing any problems. These may include<br />
problems related to fertiliser and manure usage, problems related to pesticide usage<br />
and problems related to soil management including soil erosion. The aim of the<br />
audit is to identify all potential problems that can then be prioritised. A useful way<br />
of considering diffuse pollution issues is to regard it <strong>as</strong> a three-stage process.<br />
Without each stage being present, diffuse pollution does not occur. A treatment<br />
train approach to BMP implementation may address the problem at each stage in<br />
the process.<br />
First, there must be a source of the pollutant. This might be excess nitrogen in<br />
soil or the nutrients in slurry spread on the soil surface. A source in itself does not<br />
constitute pollution however.<br />
Second, there must be a pathway. Excess nitrogen in agricultural soil is not<br />
a pollutant although it may be one in the soil of adjacent natural or semi-natural<br />
habitats. It only becomes a pollutant if there is a mechanism or pathway, determined<br />
by landscape characteristics such <strong>as</strong> slope, soil type and vegetation, for the excess<br />
nutrient to move from the soil, where it may be a desirable component of soil fertility,<br />
to a receptor. The pathway might be leaching of nitrates to a groundwater receptor,<br />
transfer of nitrates in drain flow to a surface water receptor or denitrification and<br />
transfer of oxides of nitrogen to the atmosphere acting <strong>as</strong> a receptor.<br />
104
Third, there must be a receptor. This is some component of the environment where<br />
the substance being considered h<strong>as</strong> undesirable consequences and is a pollutant.<br />
Phosphorus in agricultural soil is not usually a pollutant. It is an essential plant<br />
nutrient and a component of soil fertility. Phosphorus in loch water may be a<br />
pollutant <strong>as</strong> it may cause eutrophication. Phosphorus in the soil in an area of land<br />
containing interesting <strong>as</strong>semblages of wild plants may also be a pollutant <strong>as</strong> it may<br />
tend to reduce the biodiversity of the habitat. Diffuse pollution therefore consists<br />
of the transfer of substances from a source via a pathway to a receptor where that<br />
substance h<strong>as</strong> undesirable consequences.<br />
Critical are<strong>as</strong><br />
On some farms, most of the transfer of certain pollutants arises from a relatively<br />
small proportion of the total farm area. For example, soil erosion can transfer silt and<br />
adsorbed nutrients and pesticides from land to water. On farms where in-field soil<br />
erosion occurs, it is typically present only in limited are<strong>as</strong>, usually moderate or steep<br />
slopes with susceptible soils that are in arable cropping. Control me<strong>as</strong>ures may be<br />
targeted at such are<strong>as</strong> leaving the rest of the farm unaffected.<br />
Certain even more limited are<strong>as</strong> are sometimes termed ‘hot spots’. These may<br />
include such are<strong>as</strong> <strong>as</strong> stock feed rings, are<strong>as</strong> where stock habitually shelter and<br />
are<strong>as</strong> where sprayers are filled. The pollution arising from such hot spots may be out<br />
of proportion to their small area.<br />
Cost-effectiveness and cost benefit analysis of BMPs<br />
Where Environmental Quality Standards (EQS) for a water body are agreed to have<br />
a sound environmental b<strong>as</strong>is, and where several alternative me<strong>as</strong>ures are to be<br />
considered the preferred method of evaluation is cost-effectiveness analysis (CEA).<br />
This attempts to evaluate the le<strong>as</strong>t cost way of achieving a desired standard. Cost<br />
Benefit Analysis (CBA) is appropriate for evaluating investment projects where<br />
substantial non-market benefits or costs occur. In the SEERAD-funded project on<br />
‘Evaluation of BMPs for diffuse pollution control’ (Vinten et al., 2006), the efficacy of<br />
specific BMPs with respect to two main pollutants, P and FIO, have been studied.<br />
Details of this work will be reported elsewhere (Vinten et al., 2006), but Table 2 gives<br />
an example of the analysis framework used.<br />
Loch Leven is a lowland Loch prone to eutrophication by soluble and particulate<br />
P derived from field run-off and drainage water. This results in economic loss for<br />
downstream users and from recreational users. Much of the non-farm input of P h<strong>as</strong><br />
been controlled and attention is now focused on control of inputs from farmland. In<br />
1997, a buffer strip w<strong>as</strong> installed on the Green’s Burn to limit soil erosion losses to the<br />
stream. A simple conceptual framework for evaluating pollution control me<strong>as</strong>ures is<br />
set out below:<br />
A. Identify Environmental Quality Standards for receiving waters.<br />
B. Estimate the pollutant loading and concentration from the farm before pollution<br />
control me<strong>as</strong>ures are installed.<br />
C. Estimate reduction in pollution loading and concentration after installation of<br />
pollution control me<strong>as</strong>ures.<br />
105
D. Use relative area of farm and whole catchment to <strong>as</strong>sess contribution of single<br />
farm to and control me<strong>as</strong>ures to compliance with EQS.<br />
E. Use information on costs of me<strong>as</strong>ures and scaled up environmental benefits to<br />
do simple Cost-Effectiveness and Cost Benefit Analysis.<br />
The results of this analysis show that the cost-effectiveness of £32/kg TP of the<br />
buffer strip for P removal is quite low for arable, compared with other work (e.g.<br />
Hutchinson et al., 2005 have figures of £2.70 for arable buffers, and £75/kg TP for<br />
gr<strong>as</strong>sland buffers in Northern Ireland). This may reflect the high risk nature of the<br />
soils to erosion and topography in the Green’s Burn catchment. Recent work looking<br />
at a soil bund to contain eroded soil from a field in this catchment showed a much<br />
greater cost-efficiency. On a cost benefit analysis b<strong>as</strong>is there is still a clear positive<br />
benefit to Loch Leven of the buffer strip. The Northern Ireland values are b<strong>as</strong>ed on a<br />
national scale evaluation.<br />
Buffer strip width and management<br />
At the simplest level, buffer strips are effective against diffuse pollutants by disrupting<br />
the pathway between the source (agricultural land) and the receptor (watercourses),<br />
and in the c<strong>as</strong>e of pesticides this is the principal way in which they work. The<br />
vegetation in buffer strips can also physically trap pollutants such <strong>as</strong> soil particles<br />
(and phosphate) and absorb nitrates through their roots. The effectiveness of all of<br />
these mechanisms is likely to be enhanced by incre<strong>as</strong>ing the width of the buffer strip,<br />
and so the general guidance should be to make buffer strips <strong>as</strong> wide <strong>as</strong> possible. In<br />
practice however, the width of buffer strips is likely to be a compromise determined<br />
by a number of other factors. If the vegetation in the buffer strip is being established<br />
by sowing seed, then the width of the seed drill is likely to be an important factor.<br />
If a 3-metre drill is used to sow gr<strong>as</strong>s, then a 6-or 12-metre buffer strip is likely to<br />
be preferable to a 5- or 10-metre strip. The guidance in the PEPFAA Code (Scottish<br />
Executive, 2005b), NVZ regulations (Scottish Executive, 2003) and LERAPs will often<br />
be a starting point in determining buffer strip widths.<br />
Field topography is a major consideration. Watercourses at the foot of steep slopes<br />
that are prone to erosion or run-off should have wider buffer strips than watercourses<br />
in flat fields. A particular problem that is often encountered when establishing buffer<br />
strips is where a steep slope h<strong>as</strong> a short, flat run-out at the bottom, between the<br />
slope and the burn. If this flat area is converted into a buffer strip, and particularly<br />
if it is fenced, then it can create problems for the farmer having to turn machinery<br />
on the steep slope. In these situations the farmer must decide whether to reduce<br />
the buffer strip or incre<strong>as</strong>e it to take in the whole slope. Such decisions are likely<br />
to depend on the perceived value of the land on the slope, but set-<strong>as</strong>ide may be<br />
an acceptable option for such slopes. Buffer strips are unlikely to be effective in<br />
controlling suspended solids from eroding soils where the topography concentrates<br />
run-off. In-field erosion control me<strong>as</strong>ures should be applied in these situations.<br />
The effectiveness of buffer strips will depend on the way the strip is managed <strong>as</strong><br />
well <strong>as</strong> its width. Vigorous growth of gr<strong>as</strong>s or tall-herb vegetation is likely to be the<br />
most effective vegetation. Although such vegetation will often develop by natural<br />
regeneration on bare ground, quicker establishment and buffer strip effectiveness<br />
may be brought about by sowing a suitable seed mix (and may be required under<br />
106
certain agri-environment options). Fuller details of the methods used for siting fenced<br />
are<strong>as</strong> and buffer strips are described and illustrated in the Farming and Watercourse<br />
Management Handbook (2000).<br />
Table 2:<br />
Use of Green’s Burn Buffer strip to reduce total P loading to Loch<br />
Leven<br />
Environmental quality<br />
objective<br />
Required pollutant<br />
mitigation<br />
Eutrophic restored to mesotrophic Loch<br />
Reduction of annual TP loading to Loch<br />
Leven from 0.5 to 0.2 g/m2<br />
Notes<br />
B<strong>as</strong>ed on OECD<br />
(1982)<br />
(=4.20 tonnes TP pa over 13.9 km2 loch<br />
area)<br />
BMP contribution Green’s Burn buffer strip reduces TP load Vinten et al. (2005)<br />
by estimated 0.38 tonnes TP pa<br />
BMP cost £12k pa (fencing and management) £5/m for fencing<br />
and £100/ha for RSS<br />
species rich gr<strong>as</strong>sland<br />
Cost-effectiveness =£12k/380kg = £32/kg TP<br />
Value of Loch Leven<br />
restoration<br />
Benefit:cost ratio<br />
FUTURE DEVELOPMENTS<br />
User value: £243k pa<br />
Non-user value: £290k pa<br />
Total: £533pa<br />
=(£533k/£12k)*(0.38t/4.2t)=4.0 (Good)<br />
Datab<strong>as</strong>e of Farm Scale Sources of Diffuse Pollution<br />
Frost and McTernan<br />
(1997)<br />
SEPA holds a significant amount of data on water quality, but data on farm scale<br />
sources of pollution are lacking. A datab<strong>as</strong>e giving information for each farm type,<br />
on source strength per pollutant, potential mitigation me<strong>as</strong>ures, cost-effectiveness,<br />
loadings mitigated and time scale for efficacy is proposed, building on <strong>as</strong>pects of<br />
the screening tool (Anthony et al., 2005). The datab<strong>as</strong>e would draw on the literature,<br />
but also on audits from the six farm types in SEPA’s survey (Frost et al., 2000), the<br />
SAC BMP farms in SEERAD-funded project SAC/348/03 (Table 3), and relevant<br />
catchments where farm scale data are available. These catchments include Tarland<br />
(MI), Glensaugh (MI), Ythan (MI); Lunan (MI/SAC), Piltanton (SAC/MI), Leven (SAC/MI),<br />
Cessnock (SAC/MI/CREH), Nairn (SAC/CREH), Brighouse (SAC/MI/CREH), Ettrick<br />
(SAC/CREH), Sandyhills, Bush (SAC/MI). The datab<strong>as</strong>e would dovetail with SEPA’s<br />
‘BMP Manual’ and could be put on a website. The output would form the focus for<br />
ongoing improvement of estimates, <strong>as</strong> information from future projects, particularly<br />
the results of the SEERAD work packages (WP3.4 Me<strong>as</strong>urement of water quality;<br />
WP 3.5 Management of water quality) and Defra Catchment Sensitive Farming, etc.<br />
becomes available.<br />
Policy Matrix<br />
A policy matrix, i.e. a summary of recommended me<strong>as</strong>ures, prioritised and categorised<br />
into proposed appropriate levels of regulation, for mapping of on-farm me<strong>as</strong>ures<br />
against policy instruments, voluntary me<strong>as</strong>ures and potential GBRs etc., is required.<br />
107
ADAS h<strong>as</strong> developed a matrix for Defra to map on-farm me<strong>as</strong>ures against policy<br />
instruments and potential policy instruments (Shepherd et al., this volume). This<br />
quickly provides an <strong>as</strong>sessment of the likely effectiveness of a policy instrument in<br />
invoking particular me<strong>as</strong>ures, and identifying gaps, i.e. me<strong>as</strong>ures that have not been<br />
picked up by current policy instruments. We propose this approach be extended to<br />
the above range of categories.<br />
Knowledge Transfer<br />
Although considerable research h<strong>as</strong> been undertaken on sustainable farming systems<br />
and BMPs for good environmental management, there h<strong>as</strong> been a dearth of practical<br />
c<strong>as</strong>e studies illustrating good practice and how land managers can benefit from CAP<br />
Reform me<strong>as</strong>ures supporting good practice. Monitor farms in catchments where<br />
farm scale data are available could provide the focus for farm-b<strong>as</strong>ed BMP events.<br />
The target audience should involve land managers, policy makers, contractors and<br />
supply industries, e.g. fertiliser/pesticide suppliers and partner organisations, <strong>as</strong><br />
well <strong>as</strong> the public. There are already good examples within Scotland of successful<br />
partnership projects, e.g. The Tarland Burn (Cooper et al., 2006).<br />
108
Table 3:<br />
Summary of catchments, farms and BMPs in current SAC project<br />
(SAC/348/03)<br />
Area Catchments Farms and<br />
enterprise<br />
1. Ayrshire<br />
Pollutants:<br />
FIOs, P, NH 4<br />
-N, SS<br />
Issue:<br />
Bathing Waters<br />
2. Perth and Kinross<br />
Pollutants:<br />
P, SS<br />
Issue:<br />
Eutrophication<br />
3: Bush<br />
FIOs, NH 4<br />
-N, SS<br />
4. Stranraer<br />
Issue:<br />
FIOs, NH 4<br />
-N, SS<br />
nitrate in Gw and<br />
surface water BOD<br />
ACKNOWLEDGEMENTS<br />
‘BMPs’<br />
Cessnock A: Dairying Dirty water separation<br />
Roofing<br />
Pond<br />
Culvert<br />
Off stream drinking<br />
RAMS<br />
B: Dairying Pond<br />
Upstream RSS buffer<br />
C: Dairying Fencing<br />
Timing of slurry<br />
Management<br />
Grazing management<br />
Loch Leven D: Mixed arable Buffer strip<br />
Bund for run-off<br />
Capture<br />
Horseshoe wetland<br />
Lunan Lochs E: Mixed arable P budgeting<br />
Pond<br />
Ochre P removal<br />
F: Arable and beef Buffer strip<br />
Glencorse Burn G: Beef outwintering Nil<br />
G: arable and gr<strong>as</strong>s Buffer strip<br />
Piltanton Burn H: Beef outwintering Effluent treatment<br />
from woodchip<br />
SAC and MI receive financial support from Scottish Executive Environment and Rural<br />
Affairs Department.<br />
REFERENCES<br />
Aitken M, Merrilees D, Jones A and Duncan A (2004). Livestock farming in the<br />
bathing water river catchments. Risk identification and mitigation. In: Proceedings<br />
of the SAC/SEPA Water Framework Directive and Agriculture Conference, 27-33,<br />
Edinburgh.<br />
Anthony S, Betson M, Lord E, Tagg A, Abbot C, Struve J, Lilly A, Dunn S and Towers<br />
W (2005). Screening Tool to Identify and Characterise Diffuse Pollution Pressures.<br />
URL http://www.sniffer.org<br />
109
Dickson JW, Edwards T, Jeffrey WA, Merrilees D and Kay, D (2005). Catchment scale<br />
appraisal of best management practices (BMPs) for the improvement of bathing<br />
water - Brighouse Bay 2005. Report for SEPA, Reference 230/4187. URL http://www.<br />
scotland.gov.uk/Topics/Environment/Water/15561/bathingwatpro<br />
Frost A and McTernan J (1997). Cost Benefit Analysis of proposed erosion control<br />
me<strong>as</strong>ures at Loch Leven. In: A Petchey, B D’Arcy and A Frost (eds), Diffuse Pollution<br />
and Agriculture II. SAC/SEPA Conference, Edinburgh, 9–11 April, 134-144.<br />
Hutchinson WG, Smith RV, Gl<strong>as</strong>s C and Annett W (2005). Cost:benefit and cost:<br />
effectiveness analysis of mechanisms for reducing phosphorus inputs to inland<br />
waters in Northern Ireland. Report to Environment and Heritage Service.<br />
Frost A, Stewart S, Kerr D and MacDonald J (2000). The impacts of agricultural<br />
environmental management: c<strong>as</strong>e studies from theory to practice. URL http://www.<br />
sepa.org.uk/publications/technical/imp_env_man/index.htm<br />
Merrilees D, Aitken M, Jones A and Vinten A (2004). Research and Design of Pilot<br />
Schemes to Minimise Livestock Pollution to the Water Environment in Scotland.<br />
Report for the Scottish Executive Central Research Unit<br />
OECD (1982). Eutrophication of Waters. Monitoring, <strong>as</strong>sessment and control.<br />
Organisation for Economic Co-operation and Development report, Paris.<br />
Scottish Executive (2003). Guidelines for farmers in Nitrate Vulnerable Zones.<br />
Scottish Executive Publication, Edinburgh.<br />
Scottish Executive (2004). The 4 Point Plan. Scottish Executive Publication,<br />
Edinburgh.<br />
Scottish Executive (2005a). Scottish Executive Environment Group. Diffuse Water<br />
Pollution from Rural Land Use. Paper 2005/35. Scottish Executive Publication,<br />
Edinburgh.<br />
Scottish Executive (2005b). Prevention of Environmental Pollution from Agricultural<br />
Activity (PEPFAA) Code. Scottish Executive Publication, Edinburgh.<br />
SEPA (2006). Provision of best management practice guidance farm scale diffuse<br />
pollution. SEPA report, reference 230/4191 (awaiting publication).<br />
Vinten AJA, Towers W, King JA, McCracken DI, Crawford C, Cole LJ, Duncan A, Sym<br />
G, Aitken M, Avdic K, Lilly A, Langan S and Jones M (2005). Appraisal of rural BMP’s<br />
for controlling diffuse pollution and enhancing biodiversity. SNIFFER Report, Project<br />
WFD13.<br />
Vinten et al. (2006). Evaluation of BMPs for diffuse pollution control. Project reference<br />
SAC/348/03. Report to SEERAD (in preparation).<br />
110
RETENTION OF POLLUTANTS BY THE SINK<br />
STRUCTURES IN CATCHMENTS – STUDIES TO REDUCE<br />
DIFFUSE POLLUTION IN CHINA’S RURAL AREAS<br />
C Yin, X Wang and B Shan<br />
State Key Laboratory of Environmental Aquatic Chemistry, Research Center for Ecoenvironmental<br />
Sciences, P. O. Box 2871, Beijing 100085, China, E-mail: cqyin@mail.<br />
rcees.ac.cn<br />
SUMMARY<br />
Eutrophication of lakes and reservoirs is a serious problem in China. Diffuse sources<br />
from agricultural lands account for a large portion of the load. Besides reducing the<br />
pollution from the sources, the retention strategy during the transport process is<br />
important and it plays an important role in Best Management Practice in China. The<br />
retention strategy consists of using different sink landscape structures in watershed<br />
scales, such <strong>as</strong> multipond systems, small stone dams, swales, vegetative belts, dry<br />
ponds, waterside buffer zones and others. During continuous run-off events, the<br />
concentration reductions of total suspended solids (TSS), total phosphorus (TP),<br />
total dissolved phosphorus (TDP) and dissolved reactive phosphorus (DRP) by the<br />
system ranged from 40% to 70%. During discontinuous run-off events, removal rates<br />
of pollutants by the whole system were higher <strong>as</strong> there w<strong>as</strong> no or little surface water<br />
and pollutants exported from the watershed; removal rates of pollutants all exceeded<br />
99%. The statistical analysis results of run-off events indicated that a dry pond w<strong>as</strong><br />
the steadiest structure for controlling diffuse pollutants export. A multipond system is<br />
a wetland system composed of many tiny ponds connected by ditches and the ponds<br />
are scattered among the villages and crop fields. We discovered many mechanisms,<br />
such <strong>as</strong> decre<strong>as</strong>ing the flow velocity with volume change, settling particulate matters<br />
using sedimentation, removing dissolved pollutants using adsorption and recycling<br />
nutrients back to the crop fields. These structures can effectively reduce diffuse<br />
pollution and enhance nutrient cycling in rural watersheds with wet and dry weather.<br />
These structures are made of natural materials and are very environmentally friendly.<br />
They are cheap to construct and usually do not need energy for operation.<br />
INTRODUCTION<br />
Eutrophication in regional water bodies is being attributed to incre<strong>as</strong>ed nutrients<br />
inputs (Artola, 1995; Sharpley, 1998). Diffuse sources of sediment and nutrients,<br />
primarily from agricultural lands, have been identified <strong>as</strong> the major cause of water<br />
quality degradation (Carpenter, 1998; Arheimer, 2000; Dzikiewicz, 2000; Sharpley,<br />
2000). Village area, farmland and breed industries in agricultural watersheds may be<br />
the cause of main sensitive sources for nutrients loss. When unsuitable management<br />
me<strong>as</strong>ures of these lands are employed, contamination of water resources may result.<br />
Thus, elevated concentrations of nutrients from rural are<strong>as</strong> pose a potential hazard of<br />
eutrophication and a consequent cost for water treatment (Sanderson, 2001).<br />
Yuqiao Reservoir is the major source of drinking water to Tianjin City. Preliminary<br />
research h<strong>as</strong> identified diffuse polluted run-off from agriculture <strong>as</strong> the largest<br />
contributor of nitrogen and phosphorus to the reservoir, which accounts for about<br />
111
60% phosphorus and 50% nitrogen of the total load (Wang, 1999). Approximately<br />
1300 tons per day of litter can be generated. Where<strong>as</strong>, the use efficiency of these<br />
w<strong>as</strong>tes to farming is lower than 60%. During rainfall events, surface run-off is often<br />
seriously polluted through w<strong>as</strong>hing out these nutritional matters. Results from<br />
sampling and pollutants surveillance of polluted run-off showed a serious pollution<br />
with a TSS content of 6.6–14.8 g/L, TN of 91.7–252.3 mg/L, TP of 13.0–34.6 mg/L,<br />
COD of 1128– 9124 mg/L, respectively.<br />
Agricultural diffuse pollution is a landscape problem that requires an integrated<br />
approach involving implementation of both on-field and off-field control me<strong>as</strong>ures<br />
(Tim, 1995). Many studies have been conducted on the control of nutrients flow from<br />
agricultural lands by landscape structures (Pomogyi, 1993; Uusi-Kämppä, 2000;<br />
Kuusemets, 2002). But most of these studies are about control effect on nutrient<br />
transport processes by a single type of structure, relatively few have documented<br />
combination control effect of multiple buffer/detention structures. Furthermore,<br />
in most previous studies, the focus w<strong>as</strong> on the final effect of a treatment system<br />
and treated the transport process of nutrients <strong>as</strong> a black or grey box. The objects<br />
of this study were: (1) to explicate the detailed transport processes of diffuse P-<br />
pollutants crossing a typical complex agricultural landscape in North China; and (2)<br />
to compare control behaviors of different buffer/detention structures and to <strong>as</strong>sess<br />
their integrated effects under different hydrological conditions.<br />
MATERIALS AND METHODS<br />
Study Area and Monitoring Installation<br />
Taohu<strong>as</strong>i watershed is in the north bank of Yuqiao Reservoir with a surface area<br />
of 249 ha. The relief is strongly differentiated – there are many ridges, hills, and<br />
depressions accompanying cliffs, channels, and ephemeral stream valleys. Land<br />
use in this watershed is predominantly hilly land and cropland (Figure 1). Longterm<br />
average precipitation is 749 mm, of which 80% falls from June to September.<br />
Streams distributed in the watershed are almost all ephemeral streams. Most of the<br />
rainfall events are storms. Surface run-off is the main mechanism by which nutrients<br />
are exported from the watershed. During two study years, precipitations were lower<br />
than the long-term average and we integrally monitored eight rainfall-run-off events.<br />
Continuous flow generates only during a heavy rainfall event, of which water flow<br />
can transport from the upstream to the mouth of the watershed. Discontinuous flow<br />
usually generates during a gentle rainfall, of which water flow is intersected with<br />
little or no outflow at the watershed mouth. Monitoring sites were composed of 28<br />
sampling sites for surface flow (S1 to S28) and five for tributary (T1 to T5) flow from<br />
various land uses along the stream channel. All analyses of pollutants were done<br />
using standard methods (APHA, 1985).<br />
112
Figure 1: Spatial distribution of land use and monitoring sites of buffer/<br />
detention landscape structures. Abbreviations: SDs, stone dams;<br />
RGD, roadside gr<strong>as</strong>sed ditch; GFS, gr<strong>as</strong>sed filter strip; DPs, dry<br />
ponds; RBZ, riparian buffer zone<br />
Calculation of the sediment and P-pollutants removal rate<br />
The m<strong>as</strong>s removal rate of sediment and P-pollutants of single buffer/detention<br />
structure or the whole system they constituted can be calculated from flow-weighted<br />
mean concentration and run-off volume of waterflow when it enters and leaves the<br />
system or structure. The formula can be established <strong>as</strong> follows:<br />
MPI = ∑QPIiCPIi<br />
MPO = ∑QPOiCPOi<br />
MPT = ∑QPTiCPTi<br />
R = [1-M PO / (M PI + M PT )]x100%<br />
in which QPIi, QPOi and QPTi are inflow, outflow and tributary flow volume of the<br />
whole system or single structure (m 3 ); CPIi, CPOi and CPTi are mean pollutants<br />
concentration in inflow, outflow and tributary flow of the whole system or single<br />
structure (g/L or mg/L); MPIi, MPOi and MPTi are total pollutants m<strong>as</strong>s in inflow,<br />
outflow and tributary flow of the whole system or single structure (kg); i is buffer/<br />
detention structure number, from 1 to 5; R is the removal rate of the whole system<br />
or single structure.<br />
113
RESULTS AND DISCUSSION<br />
Landscape Structures and Flow Velocity Variation<br />
Diversified artificial and natural buffer/detention landscape structures, included stone<br />
dams (SDs), roadside gr<strong>as</strong>sed ditch (RGD), gr<strong>as</strong>sed filter strip (GFS), dry ponds (DPs)<br />
and riparian buffer zone (RBZ), were found distributed along the ephemeral stream<br />
channel upslope to downslope in the experimental watershed. These structures had<br />
many different characteristics (Table 1). All the landscape structures constituted the<br />
whole buffer/detention structure system to control the transport process of diffuse<br />
polluted run-off.<br />
Table 1:<br />
Characteristics of the buffer/detention structures along the<br />
ephemeral stream channel<br />
Type*<br />
114<br />
Constituting<br />
Parts<br />
Elevation<br />
(m)<br />
Height<br />
or<br />
depth<br />
(m)<br />
Length†<br />
(m)<br />
Width<br />
(m)<br />
Area<br />
(m 2 )<br />
Adjacent<br />
land use<br />
SDs Dam 1 48.3 1.2 19.0 16.0 304.0 Hilly land<br />
Dam 2 47.2 0.9 39.0 14.0 546.0 Hilly land,<br />
village<br />
Dam 3 46.0 1.1 59.0 21.0 1.24 × 10³ Hilly land,<br />
village<br />
Dam 4 40.6 0.8 86.0 11.0 946.0 Village,<br />
orchard<br />
RGD – 26.2–27.1 0.4 260.0 2.0 520.0 Road,<br />
cropland<br />
GFS – 24.3–25.4 – 182.0 7.0–7.5 1.27 × 10³ Cropland<br />
DPs Pond 1 24.1 0.9–1.0 6.3 – 31.5 Cropland<br />
Pond 2 22.6 1.2 23.5 – 212.0 Cropland<br />
RBZ – 16.8–17.3 – 302.0 – 2.87 × 10⁵ Cropland,<br />
reservoir<br />
*SDs, stone dams; RGD, roadside gr<strong>as</strong>sed ditch; GFS, gr<strong>as</strong>sed filter strip; DPs, dry<br />
ponds; RBZ, riparian buffer zone.<br />
†Length refers to distance from inlet to outlet of the structure.<br />
The change of flow velocity in the water pathway plays an important role in detention<br />
time and export load of pollutants. From the view of the whole system, the flow<br />
velocity presented a fluctuant pattern with many instances of incre<strong>as</strong>e and decre<strong>as</strong>e<br />
(Figure 2). During a continuous run-off event, the mean flow velocity w<strong>as</strong> 36.9 cm/s at<br />
the inlet of the system and decre<strong>as</strong>ed to 13.6 cm/s at the outlet. Due to the junction<br />
of large tributary flow from the village area (resulting from the low infiltration rate of<br />
the ground), there w<strong>as</strong> a sharp elevation of flow velocity from 10.1 to 26.2 cm/s. But<br />
soon it decre<strong>as</strong>ed to 12.0 cm/s when the flow encountered a stone dam. Because of<br />
transporting in the sloping stream channel, the flow velocity w<strong>as</strong> gradually incre<strong>as</strong>ed<br />
and reached 32.3 cm/s at the inlet of roadside gr<strong>as</strong>sed ditch. Due to the enhancement<br />
of surface roughness by vegetation, the flow velocity gradually decre<strong>as</strong>ed. But it<br />
incre<strong>as</strong>ed again at the inlet of the gr<strong>as</strong>sed filter strip before entering the tributary
flow. Due to the flourishing vegetation growing in the strip, flow velocity decre<strong>as</strong>ed<br />
sharply from 28.5 to 10.9 cm/s. In the ponds zone, the flow velocity at the outlet w<strong>as</strong><br />
very low because of decre<strong>as</strong>ed of kinetic energy resulting from a huge water-storage<br />
volume of ponds. The velocity incre<strong>as</strong>ed between the two ponds for the sloping<br />
stream channel. The riparian buffer zone also presented better capacity of slowing<br />
flow velocity through vegetation and flat relief. The variability of flow velocity under a<br />
discontinuous run-off event w<strong>as</strong> similar to that of a continuous event. But the change<br />
w<strong>as</strong> relative gentle for the intermittent transport of water and relative small run-off<br />
volume. The multiple buffer/detention structure system provided a good opportunity<br />
for sediment and particulate nutrients to settle and transform due to the prolonged<br />
detention time.<br />
Figure 2: The spatial variation of surface flow velocity in the flow pathway<br />
during the continuous and discontinuous run-off event. The d<strong>as</strong>hed<br />
line means run-off transporting in the stream channel between two<br />
buffer/detention structures<br />
Sediment and P-pollutants Concentration Variation in the System<br />
During transporting in the flow pathway, the sediment and P-pollutants concentration<br />
were affected greatly by the multiple buffer/detention structures (Figure 3). In this<br />
research, the typical variation characteristic of pollutants concentration in the flow path<br />
during both continuous and discontinuous run-off events w<strong>as</strong> that the concentration<br />
elevated <strong>as</strong> input of tributary flow from various agricultural sources (especially village<br />
area) and gradually decre<strong>as</strong>ed <strong>as</strong> run-off p<strong>as</strong>sing through each buffer/detention<br />
structure. During a continuous run-off event, the concentrations of TSS, TP, TDP,<br />
DRP in inflow of the whole system were 2.70 g/L, 0.31 mg/L, 0.07 mg/L, 0.05 mg/L,<br />
respectively. But when mixed with tributary flow from the village, the concentrations<br />
of TSS, TP, TDP, DRP were elevated to 3.68 g.L-1, 3.69 mg/L, 0.42 mg/L, 0.38 mg/L,<br />
respectively. After p<strong>as</strong>sing through the four stone dams, particulate materials (TSS,<br />
TP) were retained markedly for the formation of better settling conditions by dams.<br />
The proportion of dissolved P-pollutants (TDP, DRP) retained w<strong>as</strong> small. This possibly<br />
115
w<strong>as</strong> contributed to the low vegetation coverage on the structure surface resulting<br />
in little uptake quantity of dissolved forms of P. When the polluted run-off reached<br />
and crossed through the zone of the roadside gr<strong>as</strong>sed ditch, the concentrations<br />
of TSS decre<strong>as</strong>ed from 1.12 to 0.62 g/L. But for P pollutants, the concentrations<br />
presented a pattern of fluctuation <strong>as</strong> waterflow transported through the ditch. This<br />
result suggested that the gr<strong>as</strong>sed ditch w<strong>as</strong> under a highly disturbed condition. Lack<br />
of effective management me<strong>as</strong>ures and destroy events between times and some<br />
tr<strong>as</strong>h cumulation in the bottom of the ditch maybe the answer to this. Comparatively,<br />
the concentrations of sediment and P-pollutants decre<strong>as</strong>ed sharply <strong>as</strong> run-off w<strong>as</strong><br />
transported in a gr<strong>as</strong>sed filter strip. The concentrations of TSS, TP, TDP, DRP in<br />
inflow and outflow were 0.92 g/L, 2.14 mg/L, 1.32 mg/L, 1.23 mg/L and 0.52 g/<br />
L, 1.01 mg/L, 0.39 mg/L and 0.32 mg/L, respectively. The result suggested that a<br />
gr<strong>as</strong>sed filter strip is effective for removal of various P forms. This removal effect also<br />
presented during polluted run-off transporting through dry ponds and riparian buffer<br />
zone. The concentration of pollutants w<strong>as</strong> reduced further and reached 0.71 g/L<br />
TSS, 0.29 mg/L TP, 0.08 mg/L TDP and 0.07 mg/L of DRP in outflow of the whole<br />
system, respectively.<br />
During a discontinuous run-off event, transport processes of water and pollutants<br />
were intermittent (Figure 3). Thus, little or no water and pollutants are exported from<br />
the watershed. The reduction of pollutants concentration w<strong>as</strong> more rapid due to<br />
discontinuous transport processes which could cause low kinetic energy of run-off<br />
to carry out pollutants and longer contact time between soil matrix and pollutants<br />
incre<strong>as</strong>ing sorption and infiltration.<br />
Figure 3: The spatial variation of pollutants concentrations along the flow<br />
pathway (declining with elevation from 48.3m to 16.8m upslope and<br />
downslope) during continuous run-off event and discontinuous<br />
runoof event<br />
116
Table 2:<br />
The removal rates of sediment and P-pollutants by the multiple<br />
structures system during different types of run-off events<br />
System input<br />
System<br />
output<br />
Removal<br />
rate (%)<br />
SRH* SRV SRO SRC Total<br />
Continuous run-off events<br />
TSS (kg) 2784.3 821.1 16.2 89.3 3710.9 1235.2 66.7<br />
TP (kg) 0.127 0.812 0.062 0.101 1.102 0.433 60.7<br />
TDP (kg) 0.047 0.300 0.023 0.037 0.407 0.210 48.4<br />
DRP (kg) 0.037 0.235 0.018 0.029 0.319 0.181 43.3<br />
Discontinuous run-off events<br />
TSS (kg) 2249.2 2582.6 59.3 232.2 5123.3 20.6 99.6<br />
TP (kg) 0.218 1.908 0.097 0.259 2.482 0.014 99.4<br />
TDP (kg) 0.081 0.706 0.036 0.096 0.918 0.005 99.5<br />
DRP (kg) 0.063 0.551 0.028 0.075 0.717 0.004 99.4<br />
*SRH, surface run-off from hilly land; SRV, surface run-off from village; SRO, surface<br />
run-off from orchard; SRC, surface run-off from cropland.<br />
SEDIMENT AND P-POLLUTANTS REMOVAL CONTRAST<br />
Removal Efficiency of the Multiple Structures System<br />
The loads of sediment and P-pollutants exported from the outlet of the watershed<br />
were reduced to a great degree after gradual removal by each buffer/detention<br />
structure upslope to downslope. But the removal effectiveness w<strong>as</strong> different due<br />
to the different hydrological characteristics of continuous and discontinuous runoff.<br />
For example, during continuous run-off events, the total input loads of TSS,<br />
TP, TDP, DRP by surface run-off were 3710.9 kg, 1.102 kg and 0.407 kg, 0.319 kg,<br />
respectively. Their exports from the system were 1235.2 kg, 0.433 kg, 0.210 kg<br />
and 0.181 kg, respectively (Table 2). The removal rates were 66.7%, 60.7%, 48.4%<br />
and 43.3%, respectively. Comparatively, during discontinuous run-off events, the<br />
total input loads of TSS, TP, TDP, DRP by surface run-off were 5123.3 kg, 2.482 kg,<br />
0.918 kg and 0.717 kg, respectively, with total export loads only of 20.6 kg, 0.014 kg,<br />
0.005 kg, 0.004 kg, respectively. Their removal rates all exceeded 99%. These high<br />
removal rates of pollutants mainly resulted from the intermittent transport process of<br />
polluted run-off.<br />
Removal Efficiency of Single Structure<br />
Due to differences in physical characteristics, spatial location in the watershed, main<br />
removal mechanisms and degree of disturbance by humans among these structures,<br />
removal efficiency of each single structure w<strong>as</strong> different too. During continuous runoff<br />
events, due to the huge storage capacity and long detention time of dry ponds,<br />
they had the highest removal rate of TSS, TP, TDP and DRP, of which were 34.6%,<br />
34.3%, 20.5% and 17.3%, respectively. For dissolved forms of P-pollutants (TDP,<br />
DRP), a gr<strong>as</strong>sed filter strip had higher removal rates (Table 3). This mainly contributed<br />
to the higher infiltration rate of water resulting from dense roots of vegetation and<br />
117
iological uptake in a gr<strong>as</strong>sed area. Because of slowing run-off velocity and forming<br />
detention conditions, stone dams have a higher removal rate of TSS and TP. During<br />
discontinuous run-off events, there w<strong>as</strong> often little or no outflow from these buffer/<br />
detention structures and the removal rates of pollutants were improved markedly. For<br />
dry ponds, the removal rate of pollutants could reach 100% because of zero outflow.<br />
For a gr<strong>as</strong>sed filter strip and riparian buffer zone, the removal rates of pollutants were<br />
all over 80% and were higher than that of stone dams and a roadside gr<strong>as</strong>sed ditch,<br />
of which were about 40–70%.<br />
The statistical analysis results of rainfall-run-off events (n = 8) indicated that removal<br />
effectiveness of various pollutants by dry ponds w<strong>as</strong> the steadiest, of which the<br />
average coefficient of variation (CV) of removal rate w<strong>as</strong> 29.5%. Comparatively, the<br />
average CV of a roadside gr<strong>as</strong>sed ditch w<strong>as</strong> the highest (49.0%). This result suggested<br />
that the purification function of a roadside gr<strong>as</strong>sed ditch w<strong>as</strong> more instable because<br />
of disadvantageous influences from human disturbances.<br />
Table 3:<br />
The removal rate (%) of sediment and P-pollutants in surface run-off<br />
by different buffer/detention structures during different types of runoff<br />
events<br />
SDs* RGD GFS DPs RBZ SDs RGD GFS DPs RBZ<br />
Continuous run-off events<br />
Discontinuous run-off events<br />
TSS<br />
(kg) 32.1 9.6 12.0 34.6 7.8 68.5 54.7 85.5 100.0 81.0<br />
TP (kg) 23.7 6.5 15.4 34.3 9.2 63.4 52.4 83.7 100.0 84.1<br />
TDP<br />
(kg) 12.1 8.8 13.6 20.5 11.4 52.1 50.4 81.8 100.0 84.2<br />
DRP<br />
(kg) 10.3 7.1 13.3 17.3 9.6 49.7 48.2 83.5 100.0 83.3<br />
*SDs, stone dams; RGD, roadside gr<strong>as</strong>sed ditch; GFS, gr<strong>as</strong>sed filter strip; DPs, dry<br />
ponds; RBZ, riparian buffer zone.<br />
CONCLUSIONS<br />
Diversified artificial and natural buffer/detention landscape structures played an<br />
important role in transport processes of diffuse P-pollutants mainly from rural are<strong>as</strong>.<br />
Significant amounts of sediment and P-pollutants were removed from run-off by<br />
the multiple structures system. During continuous run-off events, the removal rates<br />
of TSS, TP, TDP, DRP by the system were about 66.7%, 60.7%, 48.4%, 43.3%,<br />
respectively. During discontinuous run-off events, removal rates of pollutants by the<br />
system were higher due to little or no surface water and pollutants exported from the<br />
watershed, of which all exceeded 99%. The statistical analysis results of rainfall-runoff<br />
events (n = 8) indicated that dry ponds were the steadiest structure for controlling<br />
diffuse P-pollutants export. When controlling diffuse polluted run-off from agricultural<br />
lands, local buffer/detention landscape structures can be used and managed <strong>as</strong> an<br />
effective and low cost me<strong>as</strong>ure to improve water quality downstream.<br />
118
REFERENCES<br />
American Public Health Association/American Water Works Association/Water<br />
Environment Federation (1985). Standard Methods for the Examination of Water and<br />
W<strong>as</strong>tewater (18th edn). W<strong>as</strong>hington DC, USA.<br />
Arheimer B and Lidén R (2000). Nitrogen and phosphorus concentrations from<br />
agricultural catchments-influence of spatial and temporal variables. Journal of<br />
Hydrology 227, 140–159.<br />
Artola CG, Pareja BL and Garcia PG (1995). Impact on hydrology and nutrient<br />
movements of developments in river b<strong>as</strong>ins draining into reservoirs. Water Research<br />
29, 601–609.<br />
Carpenter SR, Caraco NE, Correll DL et al. (1998). Nonpoint pollution of surface<br />
waters with phosphorus and nitrogen. Ecological Applications 8, 559–568.<br />
Cooper JR, Gilliam JW, Daniels RB et al. (1987). Riparian are<strong>as</strong> <strong>as</strong> filters for agricultural<br />
sediment. Soil Sci Soc Am J 51, 416–420.<br />
Dickey EC and Vanderholm DH (1981). Vegetative filter treatment of livestock feedlot<br />
run-off. Journal of Environmental Quality 10, 279–284.<br />
Dorioz JM, C<strong>as</strong>sell EA, Orand A et al. (1998). Phosphorus storage, transport and<br />
export dynamics in the Foron River watershed. Hydrological Processes 12, 285–<br />
309.<br />
Dzikiewicz M (2000). Activities in nonpoint pollution control in rural are<strong>as</strong> of Poland.<br />
Ecological Engineering 14, 429–434.<br />
Hillbricht-Ilkowska A (1993). The dynamics and retention of phosphorus in lentic and<br />
lotic patches of two river-lake systems. Hydrobiologia 251, 257–268.<br />
Kuusemets V and Mander Ü (2002). Nutrient flows and management of a small<br />
watershed. Landscape Ecology 17, 59–68.<br />
Pomogyi P, 1993. Nutrient retention by the Kis-Balaton Water Protect System.<br />
Hydrobiologia 251, 309–320.<br />
Sanderson MA, Jones RM, McFarland SJ et al. (2001). Nutrient movement and<br />
removal in a switchgr<strong>as</strong>s biom<strong>as</strong>s-filter strip system treated with dairy manure.<br />
Journal of Environmental Quality 30, 210–216.<br />
Sauer TJ, Daniel TC, Moore PA et al. (1999). Poultry litter and grazing animal w<strong>as</strong>te<br />
effects on run-off water quality. Journal of Environmental Quality 28, 860–865.<br />
Sharpley AN, Foy B and Withers P (2000). Practical and innovative me<strong>as</strong>ures for<br />
the control of agricultural phosphorus losses to water: an overview. Journal of<br />
Environmental Quality 29, 1–9.<br />
Sharpley AN, Gburek WL and Heathwaite AL (1998). Agricultural phosphorus and<br />
water quality: sources, transport and management. Agricultural and Food Science in<br />
Finland 7, 297–314.<br />
119
Tim US, Jolly R and Liao HH (1995). Impact of landscape feature and feature<br />
placement on agricultural nonpoint source pollution control. Journal of Water<br />
Resources Planning and Management 121, 463–470.<br />
Uusi-Kämppä J, Br<strong>as</strong>kerud B and Jansson H et al. (2000). Buffer zone and constructed<br />
wetlands <strong>as</strong> filters for agricultural phosphorus. Journal of Environmental Quality 29,<br />
151–158.<br />
Wang G and Guo BQ (1999). Analysis of water quality of Yuqiao Reservior and<br />
counterme<strong>as</strong>ures. Urban Environment & Urban Ecology 12, 27–28.<br />
120
CATCHMENT CHARACTERISATION AND TARGETING OF<br />
BEST MANAGEMENT PRACTICES USING PSYCHIC<br />
PJA Withers 1 , EI Lord 2 , J Strömqvist 2 and PS Davison 2<br />
1<br />
Catchment Management Group, ADAS UK Ltd, Gleadthorpe, Meden Vale, Mansfield,<br />
Nottinghamshire NG20 9PF, UK, E.mail: paul.withers@ad<strong>as</strong>.co.uk; 2 Environmental<br />
Systems, ADAS UK Ltd, Wolverhampton, Woodthorne, Wergs Road, Wolverhampton,<br />
WV6 8TQ, UK<br />
SUMMARY<br />
PSYCHIC is a recently-developed prototype decision support system for identifying<br />
the spatial distribution of sediment and phosphorus (P) export risk. As part of<br />
Defra’s Catchment Sensitive Farming initiative, PSYCHIC w<strong>as</strong> applied to four priority<br />
catchments with varied landscape type and land management activities. Total<br />
catchment export of sediment estimated by PSYCHIC varied from 0.03–0.32 t/ha/<br />
year. Predicted total P export varied from 0.59–1.34 kg/ha/year of which between<br />
15% and 73% w<strong>as</strong> predicted to originate in run-off from agricultural land. Spatial<br />
distribution analysis indicated that the largest agricultural contributions were<br />
<strong>as</strong>sociated with catchment ‘hotspots’ with combinations of high rainfall, steep<br />
slopes, erodible soils, frequent manure applications and presence of underdrainage<br />
systems. The results suggest that if used in combination with local knowledge and<br />
an appreciation of the main water quality issues in the catchment, PSYCHIC h<strong>as</strong> the<br />
potential to play a useful role in river b<strong>as</strong>in management planning. Implications for<br />
the targeting of mitigation me<strong>as</strong>ures in the four catchments are discussed.<br />
INTRODUCTION<br />
The EU Water Framework Directive (WFD) requires the preparation of river b<strong>as</strong>in<br />
management plans to implement a programme of me<strong>as</strong>ures to achieve good water<br />
quality b<strong>as</strong>ed on a range of ecological, and <strong>as</strong>sociated chemical, indicators. These<br />
me<strong>as</strong>ures will need to control both point source and diffuse pollutants, including<br />
suspended sediment (SS) and phosphorus (P) export from agricultural land.<br />
Phosphorus is the nutrient of most concern in freshwaters, and there is generally a<br />
close <strong>as</strong>sociation between sediment and P in land run-off. Conceptually, the transport<br />
of sediment and P in land run-off and drainage can be considered to occur in two<br />
fundamental steps: mobilisation and delivery. Soil particles, and the P attached to<br />
them, must firstly be mobilised by processes of dispersion and detachment, before<br />
they can be delivered in rapid surface and sub-surface (drainflow) hydrological<br />
pathways to the waterbody. Additional dissolved P may also be mobilised when<br />
rain follows soon after the application of fertilizers and manures to the land surface<br />
(‘incidental’ P transfers).<br />
There is considerable variation in the vulnerability of land to sediment and P transfer<br />
depending on landscape factors including rainfall patterns, soil type, slope, stream<br />
density and road/track networks. This underlying pattern of vulnerability can be<br />
heavily modified by land use management including land use, N and P inputs,<br />
livestock density, cultivation practices, crop management, manure management and<br />
presence of underdrainage systems. In order to utilise resources effectively, me<strong>as</strong>ures<br />
121
to control SS and P loads from agricultural land must therefore be targeted within<br />
catchments to those are<strong>as</strong> where combinations of landscape and land management<br />
generate the highest pollution risk. To facilitate the cost-effective targeting of a<br />
range of land management options to mitigate SS and P export in catchments, a<br />
prototype decision support tool called PSYCHIC (Phosphorus and Sediment Yield<br />
Characterization In Catchments) h<strong>as</strong> been developed within two catchments in<br />
England and Wales (Hampshire Avon and Wye) with siltation and eutrophications<br />
problems (Withers and Sharpley, 2006). This paper describes the further application<br />
and testing of the PSYCHIC prototype (Tier 1 screening tool) to four catchments with<br />
varied landscapes and land management. Its potential for use <strong>as</strong> part of river b<strong>as</strong>in<br />
management planning is discussed.<br />
MODELLING APPROACH USED IN PSYCHIC<br />
PSYCHIC is used to quantify the export of sediment, particulate P and dissolved P in<br />
surface and sub-surface run-off from agricultural land and <strong>as</strong>sess their contribution<br />
relative to other ‘point’ sources of P in the catchment. PSYCHIC involves a processb<strong>as</strong>ed<br />
modelling approach that is sensitive to those land management practices<br />
which have a large influence on the mobilisation and delivery of sediment and P.<br />
The model takes account of climate, landscape and land management factors and<br />
utilises current knowledge on the processes of sediment and P export. Predictions<br />
of the spatial and temporal distribution of flow, and SS and P loads, are provided on<br />
a monthly time step and at both 1 km 2 and field scales within a GIS environment. The<br />
decision support tool integrates model predictions of catchment are<strong>as</strong> with a high<br />
risk of export or ‘hotspots’ (Tier 1 screening tool) with field scale risk <strong>as</strong>sessment of<br />
contributing are<strong>as</strong> on farms (Tier 2) to help identify appropriate best management<br />
practices (BMPs) to improve nutrient and land management. PSYCHIC then<br />
<strong>as</strong>sesses the impact of the selected BMPs on sediment and P export at the field<br />
and catchment scale. Further description of the PSYCHIC model structure and its<br />
parameters is given by Davison et al. (2006).<br />
APPLICATION OF THE TIER 1 SCREENING TOOL TO PILOT CATCHMENTS<br />
The Tier 1 screening tool within PSYCHIC w<strong>as</strong> applied to the four pilot catchments<br />
(Hampshire Avon near Salisbury, Teme in Shropshire/Worcestershire, Wensum in<br />
Norfolk and B<strong>as</strong>senthwaite Lake in Cumbria) selected <strong>as</strong> part of the governments<br />
Catchment Sensitive Farming Initiative (Defra, 2004). These are all priority<br />
catchments suffering from sediment and/or P pollution and catchment officers<br />
have been designated to encourage farmers to adopt Good Agricultural Practice<br />
and additional targeted me<strong>as</strong>ures chosen from a range of options under Defra’s<br />
countryside stewardship schemes. PSYCHIC is used to inform which me<strong>as</strong>ures<br />
would be most cost-effective to tackle local water quality issues and where they<br />
need to be targeted within the catchment area. PSYCHIC input data (derived from<br />
the MAGPIE system, Lord and Anthony, 2000) and results were mapped, and risk<br />
factors and resulting mapped estimates of sediment and P transfer presented to<br />
catchment stakeholders.<br />
The catchments differ widely in their climate, topography, land use and farming<br />
practices (Table 1). The Hampshire Avon is a chalkland catchment with mixed farming,<br />
variable relief and very low river drainage density; the Wensum catchment is largely<br />
122
arable but with low rainfall, low relief and mainly sandy soils; the Teme catchment is<br />
dominated by clay loam and silty soils with a high proportion of gr<strong>as</strong>sland farming;<br />
whilst the B<strong>as</strong>senthwaite catchment is almost wholly in gr<strong>as</strong>s with shallow clay loam<br />
soils on steep slopes and in a high rainfall area.<br />
Table 1:<br />
Selected catchment characteristics, estimated P inputs, total P<br />
exports and the amounts of P mobilised and delivered in each of the<br />
four study catchments<br />
Avon Wensum Teme B<strong>as</strong>senthwaite<br />
Area (km 2 ) 1714 685 1623 626<br />
Average annual rainfall (mm) 844 669 833 1886<br />
Land use<br />
Agricultural land (% of total)* 76 79 79 83<br />
% arable 48 81 12 2<br />
% managed gr<strong>as</strong>s 32 12 70 44<br />
% rough grazing 20 7 18 54<br />
P inputs‡<br />
Total P input (kg/ha/year) 13 15 15 6<br />
Fertiliser (% of total P) 34 32 24 20<br />
Manure (% of total P)†<br />
Cattle<br />
45 12 38 63<br />
Sheep 2 1 15 14<br />
Pig 6 22 3
Total P inputs in fertilisers and manures were very similar in the Avon, Wensum and<br />
Teme catchments (13–15 kg/ha/year), but dropped to 6 kg/ha/year in B<strong>as</strong>senthwaite<br />
due to the high proportion of rough grazing. In all catchments, > 70% of the total<br />
P inputs to land were derived from spread manure and excreta deposited during<br />
grazing. The manure derived largely from pig and poultry enterprises in the Wensum<br />
catchment, and from cattle in the other catchments.<br />
The predicted estimates of total sediment and P export at the outlet of each catchment<br />
varied from 0.03–0.32 t/ha/year and from 0.59–1.34 kg/ha/year, respectively<br />
(Table 1). Of the total P export, 13–73% w<strong>as</strong> predicted to be derived from diffuse<br />
agricultural sources. The very high diffuse P contributions (c. 70%) in the Teme and<br />
B<strong>as</strong>senthwaite catchments were <strong>as</strong>sociated with larger amounts of P attached to<br />
eroding soil particles and mobilised from fresh applications of manures (incidental<br />
P). Hence sediment exports were at le<strong>as</strong>t two- to three-fold greater in these two<br />
catchments than in the Avon and Wensum catchments. Farmyards contributed most<br />
P in the Teme catchment. In the Wensum and B<strong>as</strong>senthwaite catchments, most P<br />
is delivered by land underdrainge systems, whilst in the Avon and Teme there is a<br />
significant surface run-off component (Table 1). Knowledge of the relative proportions<br />
of surface and sub-surface export helps identify where sediment and P mitigation<br />
options will be most cost-effectively targeted.<br />
Figure 1: Spatial distribution of sediment export in the Hampshire Avon<br />
catchment<br />
Total catchment export represents only the average of a range in 1 km 2 export<br />
values and can be misleading without an analysis of the spatial distribution of export<br />
rates across the catchment. A spatial distribution analysis also provides a means of<br />
targeting me<strong>as</strong>ures to are<strong>as</strong> where the risk of sediment and P loss risk is greatest.<br />
For example, in the Avon catchment the total export of sediment is very low (30 kg/<br />
ha/year) due to low stream density (Table 1). However, an analysis of the pattern<br />
124
of sediment export shows there are ‘hotspots’ within the catchment which have<br />
much higher sediment export rates up to 0.5 t/ha/year (Figure 1). For example, one<br />
area in the western part of the catchment shows high concentrations of suspended<br />
sediment in headwaters, and significant diatom activity in spring, <strong>as</strong>sociated with<br />
dairy farming including forage maize on underdrained heavy clay soils. Mitigation<br />
options here will need to focus on careful application of manures to avoid incidental<br />
P ransfers, avoidance of poaching damage to gr<strong>as</strong>sland swards and improved<br />
husbandry of the maize crop to prevent sediment mobilisation after harvest (such <strong>as</strong><br />
growing early harvesting varieties, establishment of winter cover crops and rotating<br />
the crop around the farm on less risky fields).<br />
In the headwaters of the Wensum catchment, problems of siltation are <strong>as</strong>sociated<br />
with surface run-off from the light-textured and relatively erodible soils. Me<strong>as</strong>ures<br />
here therefore need to be focussed on minimising surface run-off and erosion risk.<br />
Heavy clay soils, of which a significant proportion would be expected to be drained,<br />
occur in the centre of the catchment and estimated P export from this area w<strong>as</strong><br />
therefore higher. Mitigation would require reduction in P inputs (for example by<br />
reducing livestock manure inputs and by more careful adjustment of fertiliser inputs<br />
for P derived from manures), and avoiding applications of P fertiliser or manures<br />
during the winter. Although PSYCHIC indicated that a high proportion of the P input<br />
w<strong>as</strong> <strong>as</strong> pig and poultry manures, subsequent discussion indicated that a great deal<br />
of the poultry manure w<strong>as</strong> incinerated at a local power station, and it w<strong>as</strong> thought<br />
that pig numbers had fallen. Such local information is therefore necessary in the<br />
formulation of the risk <strong>as</strong>sessment <strong>as</strong> well <strong>as</strong> the estimated impact of any proposed<br />
mitigation strategy.<br />
Figure 2: Mobilisation of P by surface pathways in the Teme catchment<br />
125
Within the Teme catchment, largest sediment and P transfer w<strong>as</strong> predicted to be<br />
via surface pathways in the central area, where soils have a substantial silt content<br />
and the proportion of arable land is incre<strong>as</strong>ing relative to the uplands (Figure 2).<br />
The stream is important <strong>as</strong> a fishery, and again siltation is of major concern. Here<br />
me<strong>as</strong>ures which impinge on both gr<strong>as</strong>sland and arable management including<br />
erosion control me<strong>as</strong>ures such <strong>as</strong> early sowing will be relevant.<br />
In the gr<strong>as</strong>s dominated B<strong>as</strong>senthwaite catchment, most diffuse P export occurs in<br />
the western part of the catchment, with hotspots <strong>as</strong>sociated with more intensive<br />
management (P inputs) on underdrained soils. Lack of opportunity to incorporate P<br />
inputs on the steeper slopes and under the high rainfall in the area means incidental P<br />
transfers are high (Table 1) and need to be controlled by careful fertiliser and manure<br />
management.<br />
DISCUSSION<br />
The PSYCHIC decision support tool is only a prototype at this stage and requires<br />
further modification and refinement <strong>as</strong> our knowledge of sediment and P mobilisation<br />
and delivery in catchments improves. However, its application is already proving very<br />
useful in helping to (a) rapidly <strong>as</strong>sess the relative contribution of diffuse P sources<br />
relative to point P sources; (b) characterize the land use and farming activities in<br />
catchments in a consistent and spatially distributed manner and (c) quantify the<br />
<strong>as</strong>sociated risks of sediment and P transfer in surface run-off and sub-surface runoff<br />
across catchments. The separate delineation in P mobilisation between fertilizers/<br />
manures, the soil and farmyards, and in P delivery between surface and sub-surface<br />
pathways, provides a means of identifying what me<strong>as</strong>ures might be most appropriate<br />
and where they need to be targeted. Application of the Tier 2 PSYCHIC model within<br />
the hotspots identified by Tier 1 is now required to further predict the impact of<br />
more specific me<strong>as</strong>ures identified through river walks, wet weather surveys and farm<br />
visits by the respective catchment officers. We have found that the presentations,<br />
and especially the maps, promote stakeholder discussion and are appreciated <strong>as</strong><br />
a contribution to the development of mitigation strategies. As with the example of<br />
incineration of poultry manure, local factors frequently come to light which require<br />
further consideration. It is planned to apply PSYCHIC to other catchments and to<br />
adapt the approach to maximise its usefulness to stakeholders.<br />
ACKNOWLEDGEMENTS<br />
PSYCHIC w<strong>as</strong> developed by a research consortium including ADAS UK Ltd, National<br />
Soil Resources Institute, Centre for Ecology and Hydrology, Exeter University, Reading<br />
University and Lanc<strong>as</strong>ter University with funding from Defra, the Environment Agency<br />
and English Nature.<br />
126
REFERENCES<br />
Davison PS, Withers PJA, Lord EI, Betson MJ and Strömqvist J (2006). PSYCHIC<br />
– A process-b<strong>as</strong>ed model of phosphorus and sediment mobilisation and delivery<br />
within agricultural catchments in England and Wales. Part 1 – Model description and<br />
parameterisation. Journal of Hydrology (in press).<br />
Defra (2004). Developing Me<strong>as</strong>ures to Promote Catchment-Sensitive Farming. A<br />
joint Defra-HM Tre<strong>as</strong>ury Consultation. URL.<br />
http://www.defra.gov.uk/environment/water/dwpa/index.htm<br />
Lord EI and Anthony SG (2000). MAGPIE: A modelling framework for evaluating<br />
nitrate exports at national and catchment scales. Soil Use and Management 16,<br />
167–174.<br />
Withers PJA and Sharpley (2006). Catchment characterisation and targeting of best<br />
management practices to control sediment and phosphorus transfer from different<br />
sources. Journal of Hydrology (in press).<br />
127
A RISK ASSESSMENT AND MITIGATION STRATEGY<br />
TO MINIMISE LIVESTOCK POLLUTION TO SURFACE<br />
WATERS<br />
DW Merrilees 1 , JW Dickson 2 , WA Jeffrey 2 and D Kay 3<br />
1<br />
SAC Environmental, Auchincruive, Ayr KA6 5HW, UK, E-mail: Dave.Merrilees@<br />
sac.co.uk; 2 SAC Environmental, Bush Estate, Penicuik, Midlothian EH26 0PH, UK;<br />
3<br />
CREH, C/o University of Wales, Lampeter, Ceredigion, SA48 7ED, UK<br />
SUMMARY<br />
The aim of the project w<strong>as</strong> to determine to what extent best management practices<br />
(BMPs) could contribute to improved water quality in Brighouse Bay, a Designated<br />
Bathing Water in the South-west of Scotland. A range of BMPs w<strong>as</strong> installed, mostly<br />
field rather than steading b<strong>as</strong>ed, which prevented animal access to watercourses<br />
or water margins and treated yard run-off by retention ponds. Comparison with<br />
an unremediated ‘control’ catchment indicates a relative improvement in faecal<br />
indicator organism (FIO) flux to the bathing waters during the bathing se<strong>as</strong>on. This<br />
improvement is observed under high flow conditions, critical in terms of bathing<br />
water compliance. The most significant reduction in high flow FIO concentration<br />
w<strong>as</strong> in watercourses where stock access w<strong>as</strong> prevented from > 30% of the stream<br />
length and water margins.<br />
INTRODUCTION<br />
The report of the SEERAD Agriculture and Environment Working Group concluded<br />
that the main priority environmental issue for Scottish agriculture for the next 5–<br />
10 years w<strong>as</strong> diffuse pollution to water (Scottish Executive, 2002). Large volumes<br />
of livestock manures and dirty water are generated on livestock farms and these<br />
materials can contain great numbers of FIO including many potential pathogens<br />
(Scottish Executive Prevention of Environmental Pollution from Agricultural Activity<br />
(PEPFAA) Code, 2005).<br />
In 2004, Merrilees et al. reported on a SEERAD-funded project to deliver capital<br />
works me<strong>as</strong>ures and farm-specific advice to reduce FIO pollution from 48 farms in<br />
four sensitive bathing waters catchments across Scotland. The total works included<br />
drainage (1,600 m), fencing (44,000 m), gates (290), guttering/ downpipes (900 m),<br />
waterpipes (25,000 m), troughs (130), cow tracks (4,900 m), concrete aprons/<br />
floors (1,100 m 2 ), water breaks (500 m), steading roofs (12), plus ancillary pumps,<br />
sumps, tanks and concrete works. A number of constraints have been recognised<br />
and lessons learned about the undertaking of this sort of work in the farm context.<br />
A number of <strong>as</strong>pects about ongoing maintenance have been identified also.<br />
Reducing faecal pollution risks from farms requires a knowledge of the pollution<br />
pathways, promotion of good farming practices, capital works for manure and slurry<br />
reduction, containment, storage or treatment and integrated delivery of advice and<br />
financial support to ‘at risk’ farms <strong>as</strong> outlined in the ‘Forward Strategy for Scottish<br />
Agriculture’.<br />
Brighouse Bay is a Designated Bathing Water and a Site of Special Scientific Interest<br />
(SSSI) in the South-west of Scotland, near Kirkcudbright. This bathing water h<strong>as</strong><br />
128
exhibited compliance problems in recent years in achieving the mandatory and<br />
recommended microbiological standards specified in Directive 76/160/EEC (CEC,<br />
2004, COM581). Water quality data does suggest the strong possibility of farm animal<br />
derived pollution affecting this compliance location and driving non-compliance.<br />
METHODS<br />
With only nine farms, Brighouse Bay w<strong>as</strong> an ideal place to establish and monitor<br />
BMPs and <strong>as</strong>sess any improvement in water quality through comparison with a<br />
control catchment. The main aim w<strong>as</strong> to determine to what extent improved farm<br />
practices and BMPs could contribute to improved water quality in the catchment. By<br />
introducing a range of relevant BMPs, a further objective w<strong>as</strong> to <strong>as</strong>sess their relative<br />
merits in terms of pollutant removal.<br />
The objective of environmental monitoring in the Brighouse Bay investigation w<strong>as</strong><br />
to me<strong>as</strong>ure, and if possible quantify, the effects of the steading and field-b<strong>as</strong>ed<br />
me<strong>as</strong>ures on the quality of water impacting on bathing water compliance in the bay.<br />
The project had the following specific objectives:<br />
• To collect evidence of water quality change.<br />
• To <strong>as</strong>sess the effectiveness of me<strong>as</strong>ures.<br />
• To <strong>as</strong>sess the cost effectiveness of me<strong>as</strong>ures.<br />
• To acquire knowledge of the relative importance of me<strong>as</strong>ures.<br />
• To establish a protocol for conducting a catchment appraisal of BMPs.<br />
Farm pollution audits (Scottish Executive 4 Point Plan, 2002) have been carried out<br />
at each of the nine farms wholly within the catchment. The following factors were<br />
considered:<br />
• W<strong>as</strong>te systems currently in place for slurry, farm yard manure and dirty water,<br />
their capacity, operation and condition.<br />
• An audit of the w<strong>as</strong>te produced and the suitable land available for spreading<br />
b<strong>as</strong>ed on the risk of run-off after a w<strong>as</strong>te application.<br />
• An audit of the spread able days according to monthly rainfall, dry and frost<br />
days.<br />
• Farmyard drainage audit and plan.<br />
• Calculations to demonstrate the actual capacity of the existing w<strong>as</strong>te systems.<br />
Other farm data prepared includes:<br />
• Farm Nutrient Budget and Fertiliser Plan.<br />
• Water Margin Management Audit.<br />
129
Environmental Monitoring<br />
The primary water quality parameters examined were the faecal indicator compliance<br />
parameters of total coliform organisms, faecal coliform organisms and intestinal<br />
enterococci. In addition, the following physico-chemical parameters were me<strong>as</strong>ured:<br />
nitrate, nitrite, ammoniacal nitrogen and orthophosphate.<br />
The pre-remediation monitoring team of SAC, CREH and the Macaulay Institute<br />
w<strong>as</strong> deployed in October 2003. The timing of this deployment w<strong>as</strong> to acquire water<br />
quality data <strong>as</strong> close <strong>as</strong> possible to the ‘summer’ catchment condition. However,<br />
the period of pre-remediation monitoring w<strong>as</strong> out with the bathing se<strong>as</strong>on of June<br />
to September. Complementary investigations suggested that there may be a strong<br />
se<strong>as</strong>onality in the high flow concentration of faecal indicators in streams draining<br />
are<strong>as</strong> of livestock farming, with the highest concentrations evident in the summer<br />
period when stock were present in the catchment fields.<br />
Figure 1: Subcatchment and monitoring stations<br />
Given the timing of the pre-remediation sampling two options were possible. First,<br />
the monitoring could be undertaken in the same se<strong>as</strong>on (i.e. October to November<br />
2004) which should minimise the effects of se<strong>as</strong>onality in the temporal comparison<br />
in water quality pre- and post-remediation. This option w<strong>as</strong>, perhaps, the most<br />
‘conservative’ but it would result in no data having been acquired during the bathing<br />
se<strong>as</strong>on itself during either pre- or post-remediation ph<strong>as</strong>es with the inherent risk that<br />
it would fail to pick up the impacts of farming and other activities on the catchment<br />
which only occurred in the period of the bathing se<strong>as</strong>on. Second, the monitoring<br />
130
could be completed within the bathing se<strong>as</strong>on which might make direct comparison<br />
between the pre- and post-remediation data sets difficult but would provide data on<br />
bathing se<strong>as</strong>on FIO flux to underpin future policies within this catchment (Crowther<br />
et al., 2003). The latter option w<strong>as</strong> agreed by the project steering group and w<strong>as</strong><br />
implemented.<br />
Rationale for Selecting BMPs<br />
After the audit of the farms within the catchment, plans were devised to install <strong>as</strong><br />
wide a range of BMP me<strong>as</strong>ures <strong>as</strong> possible. The area had many opportunities for<br />
improvements to reduce the risk of diffuse FIO flow to the main watercourse or its<br />
tributaries. However, there were relatively few different ways of implementation <strong>as</strong><br />
most of the me<strong>as</strong>ures involved the installation of fencing and the supply of alternative<br />
water supplies. Prioritisation had to be applied to ensure that the most appropriate<br />
me<strong>as</strong>ures were tested and to keep within project budget. Priorities reflect equal<br />
weight to (i) bathing water compliance, (ii) introducing a range of BMPs including<br />
ponds and wetlands. These priorities were drawn up with reference to the following<br />
selection criteria:<br />
• Whether there w<strong>as</strong> a direct FIO pathway into the bay.<br />
• Intensity of the likely FIO loading.<br />
• Possibility of FIO reduction/treatment between the source and the bay.<br />
• Known ‘hot spots’ from CREH monitoring in autumn 2003.<br />
Me<strong>as</strong>ures Adopted<br />
B<strong>as</strong>ed on the Pollution Audit, pollution impacts were prioritised on a Scale 1 (very<br />
high) to 4 (low) and the following me<strong>as</strong>ures adopted in mitigation:<br />
1. Removal of stock from direct access to the watercourse.<br />
2. Creation of buffer strips between the grazed land and the immediate riparian<br />
area.<br />
3. Removal of stock from the natural wetlands adjacent to watercourses.<br />
4. Creation of retention ponds for treatment of contaminated water.<br />
5. Removal of shallow cattle crossings which are usually also watering points.<br />
6. Removal of short lengths of ditch by installing pipes.<br />
7. Provision of alternative water supplies where stock access to watercourses w<strong>as</strong><br />
prevented.<br />
RESULTS AND DISCUSSION<br />
BMP Me<strong>as</strong>ures<br />
SAC w<strong>as</strong> always aware of the fact that farmers had to be willing partners for this<br />
project to be successful. If me<strong>as</strong>ures proposed were inappropriate to the farm, or<br />
had been seen <strong>as</strong> a feature that imposed constraints on farming activities, farmers<br />
would have been unlikely to accept such me<strong>as</strong>ures.<br />
131
BMP me<strong>as</strong>ure 1 (exclusion of stock from watercourses) w<strong>as</strong> readily understood and<br />
appreciated from the <strong>as</strong>pect of reducing the risk of diffuse pollution so long <strong>as</strong> an<br />
alternative reliable water supply w<strong>as</strong> able to be installed.<br />
BMP me<strong>as</strong>ure 2 (buffer strips) were also acceptable in most circumstances, but with<br />
varying tolerance of the amount of land take involved. The theory is understood, but<br />
not always will the ideal width of buffer strip be allowed on all farms.<br />
BMP me<strong>as</strong>ure 3 (stock removal from wetlands) will not be applicable on all farms,<br />
but within the catchment area where other BMPs were installed three wetland are<strong>as</strong><br />
were identified for exclusion from stock access. There are other wetlands in other<br />
parts of the catchment that are still open to stock. Farmers are aware that grazing<br />
value is low, but are also concerned that these are<strong>as</strong> will have to be managed in a<br />
different way to become a wildlife habitat and to prevent the growth of unsightly or<br />
inv<strong>as</strong>ive vegetation.<br />
Me<strong>as</strong>ure 4 (farm ponds) w<strong>as</strong> by far the most difficult me<strong>as</strong>ure that SAC promoted<br />
within the catchment. Farmers are environmentally aware but some could not see<br />
the need for farm ponds to treat lightly contaminated water. Farmers want alternative<br />
systems to treat ‘dirty water’, but under current regulations ponds would not be<br />
permitted to treat such water. The amount of land (and number of ponds) required<br />
to treat such water to an acceptable discharge quality could be very large. However,<br />
advantage can be taken of existing wetlands by isolating them from livestock.<br />
BMP me<strong>as</strong>ure 5 (removal of shallow crossings over watercourses) will involve either<br />
land take or involve a considerable amount of engineering to deepen the watercourse<br />
and avoid the land take.<br />
Me<strong>as</strong>ure 6 (removal of short lengths of ditch by piping) will have been carried out<br />
on farms for different re<strong>as</strong>ons, such <strong>as</strong> making parts of fields more accessible for<br />
silage making. Farmers will generally be willing to adopt this me<strong>as</strong>ure <strong>as</strong> an aid to<br />
production. However, this activity should not be used extensively <strong>as</strong> it contravenes<br />
SEPA’s position on avoiding new culverts.<br />
Fundamental to BMP me<strong>as</strong>ure 7 is to provide water from a natural source. This makes<br />
the supply sustainable and should, in theory, result in no change in the amount of<br />
water being taken from the watercourses. Apart from minor maintenance it h<strong>as</strong><br />
a nil ongoing cost, unlike a metered water supply. An important consideration in<br />
designing such a BMP is the level of abstraction given the regulations flowing from<br />
the Water Environment and Water Services (Scotland) Act 2003.<br />
WATER QUALITY ANALYSIS<br />
Low Flows<br />
Mean concentrations of faecal indicator compliance parameters under dry weather<br />
conditions, are generally low. There is a slight elevation in their concentrations during<br />
low flows in the summer bathing se<strong>as</strong>on. However, the low flow fluxes represent a<br />
very small proportion of the total flux in the bathing se<strong>as</strong>on and seem not to impact<br />
on compliance with Directive 76/160/EEC (Wyer et al., 1997)<br />
132
High Flows<br />
Under high flow conditions, faecal indicator concentrations exhibit a strong se<strong>as</strong>onal<br />
pattern with much higher levels in the summer period. In the unmodified ‘control’<br />
catchment, the incre<strong>as</strong>e in mean bathing water compliance parameters between the<br />
pre- ‘autumn/winter’ and the post- ‘summer’ sampling periods were <strong>as</strong> follows:<br />
a. total coliform 10.6 -fold incre<strong>as</strong>e<br />
b. Escherichia coli 6.8-fold incre<strong>as</strong>e<br />
c. Intestinal enterocci 3.5-fold incre<strong>as</strong>e.<br />
Commonly, over 95% of the faecal indicator flux in the bathing se<strong>as</strong>on occurs during<br />
storm periods, thus, the elevation in concentration in high flows is very significant.<br />
Analysis<br />
This observed se<strong>as</strong>onality made direct comparison of the high flow water quality data<br />
acquired pre- and post-remediation meaningless. However, the control catchment<br />
facilitated comparisons between the pre-remediation difference between ‘test’<br />
and ‘control’ catchments (a) and the post-remediation difference (b). The value (b)<br />
minus (a) gives the magnitude of water quality improvement in the post-remediation<br />
period.<br />
Two me<strong>as</strong>ures of subcatchment remediation intensity were calculated:<br />
i. the additional percentage of the stream bank length fenced and,<br />
ii. the additional percentage of subcatchment land area from which the stream w<strong>as</strong><br />
‘protected’, by the new fencing.<br />
While this inferred relationship will always be ‘confounded’ by subcatchment factors<br />
such <strong>as</strong>, (a) the exact positioning of the fencing in relation to the sampling point<br />
and (b) locations of hardstandings and their ‘connectivity’ within the subcatchment,<br />
there does seem to be a clear improvement in the catchments where a significant<br />
proportion of the stream bank h<strong>as</strong> been fenced.<br />
133
(a) With reference to the incre<strong>as</strong>e in bank length fenced<br />
(b)<br />
With reference to the reduction in land are<strong>as</strong> with access to watercourses<br />
Figure 2: Scatterplots of the percentage shift in flux per unit area compared<br />
with site 501 for presumptive coilforms in the post-remediation<br />
period compared with the pre-remediation period<br />
134
Examination of Figure 2 (a) and (b) suggests that over 30% of new stream bank<br />
length fencing is required before an effect can be seen. However, it is important to<br />
note that:<br />
i. there is considerable variability in this hypothesised ‘effect’ between the<br />
remediated catchments; and<br />
ii. this observation is b<strong>as</strong>ed on only four relevant data points and must be considered<br />
tentative.<br />
Effectiveness of BMP Me<strong>as</strong>ures<br />
The Brighouse Bay study w<strong>as</strong> conducted in a small catchment where interventions,<br />
such <strong>as</strong> stream bank fencing, could be implemented to cover a significant percentage<br />
of the available stream bank length. The study therefore offers an exemplar of the<br />
effects of remedial me<strong>as</strong>ures in this type of livestock farming area in South-west<br />
Scotland.<br />
The faecal indicator and nutrient results provide complementary evidence of<br />
beneficial remediation effects. In particular, a me<strong>as</strong>urable improvement in FIO flux<br />
to the bathing waters is suggested when compared with the control catchment,<br />
although compliance with EU bathing water standards after storm events is still<br />
not guaranteed. Some validation of The Scottish Executive/SEPA’s bathing water<br />
signage project w<strong>as</strong> provided on the 19th August 2004, when a ‘poor’ bathing water<br />
quality signal w<strong>as</strong> confirmed by spot sea water samples that proved to have FIO<br />
levels in excess of mandatory standards.<br />
Early indications suggest that a beneficial effect can be seen in the Brighouse Bay<br />
subcatchments (i.e. noticeable FIO reductions) when approximately 30% more of<br />
the catchment stream bank lengths are fenced, which also results in a ‘protection’<br />
from approximately 30% more of the catchment fields draining to a subcatchment<br />
outlet.<br />
The creation of farm ponds h<strong>as</strong> yet to be shown <strong>as</strong> an effective BMP me<strong>as</strong>ure.<br />
However, the beneficial effects of ponds and wetlands is demonstrated by one small<br />
subcatchment (monitored at site 103) in the Brighouse Bay study. This exhibited<br />
uniformly low pre- and post-remediation FIO concentrations at the catchment outlet.<br />
The full beneficial effect of newly isolated wetlands and ponds is likely to be seen<br />
only after plants in the water margins become established and the floor of the pond<br />
partially seals, possibly taking 2 to 3 years to take full effect.<br />
Owing to the project timescale and the necessity to initiate monitoring ahead of<br />
carrying out the farm audits and determining the BMPs, rigorous evaluation of the<br />
individual me<strong>as</strong>ures applied h<strong>as</strong> not been possible. Se<strong>as</strong>onal factors and land<br />
use changes in some fields (e.g. from autumn grazing to summer silage) are major<br />
confounders in the pre- and post-remediation comparisons at the sub-catchment<br />
level. To obtain full value from the project, monitoring in successive bathing se<strong>as</strong>ons<br />
over a suggested period of 5 years is advised to confirm the improvements seen<br />
thus far.<br />
135
ACKNOWLEDGEMENTS<br />
SAC acknowledges funding of this project by SEERAD and the inputs from the various<br />
members of the Steering Group, comprising the Scottish Executive, SEPA, SAC,<br />
CREH, MRCS and NFUS. We wish to acknowledge the willing participation of the<br />
landowners who were involved in this project. Their inclusion w<strong>as</strong> purely a reflection<br />
of their location within the catchment and not due to any real or perceived diffuse<br />
pollution problem. We acknowledge their helpful comments and all the background<br />
farm information they provided.<br />
REFERENCES<br />
Commission of the European Communities (CEC) (2004). Proposal of the European<br />
Parliament and of the Council Concerning the Quality of Bathing Waters COM (2004)<br />
581 final 2002/0254 (COD) 12884/04, 26 November 2004.<br />
Crowther J, Wyer MD, Bradford M, Kay D, Francis CA (2003). Modelling faecal<br />
indicator concentrations in large rural catchments using land use and topographic<br />
data. Journal of Applied Microbiology 94, 962–973.<br />
Merrilees D, Aitken M, Jones A and Vinten A (2004). Research and design of pilot<br />
schemes to minimise livestock pollution to the water environment in Scotland.<br />
In: Report for the Scottish Executive Central Research Unit.<br />
URL http://www.scotland.gov.uk/Topics/Environment/Water/15561/<br />
pollutionmainreport<br />
Scottish Executive (2002). Agricultural & Environmental Working Group. Review of<br />
Recent UK and European Research Regarding Reduction, Regulation and Control<br />
of the Environmental Impacts of Agriculture, Part 1. Scottish Executive Publication,<br />
Edinburgh.<br />
Scottish Executive (2002). Custodians of Change Report of the Agriculture and<br />
Environment Working Group. Scottish Executive Publication, Edinburgh.<br />
Scottish Executive (2004). The 4 Point Plan. Scottish Executive Publication,<br />
Edinburgh.<br />
Scottish Executive (2005). Prevention of Environmental Pollution from Agricultural<br />
Activity (PEPFAA) Code. Scottish Executive Publication, Edinburgh, pp 23-44.<br />
Wyer MD, Kay D, Crowther J, O’Neill JG, Jackson G and Fewtrell L (1997). The effects<br />
of catchment (i.e. non-outfall) sources of faecal indicators on compliance of marine<br />
recreational waters with Directive 76/160/EEC. Water Science and Technology 35,<br />
151–156.<br />
136
ENVIRONMENT SENSITIVE FARMING – PRACTICAL<br />
ADVICE FOR LAND MANAGERS<br />
AD Carter 1 , S Groves 1 , R Bailey 1 and J MacLeod 2<br />
1<br />
ADAS UK Ltd, Gleadthorpe, Meden Vale, Mansfield, NG20 9P, UK, E-mail: andree.<br />
carter@ad<strong>as</strong>.co.uk; 2 MacLeod Research Ltd, PO Box 6309, Portree, Isle of Skye,<br />
IV51 9ZD, UK<br />
SUMMARY<br />
Environment Sensitive Farming (ESF) delivers free advice in England on w<strong>as</strong>te<br />
management and reducing diffuse pollution to air, soil and water. The advice is targeted<br />
to priority are<strong>as</strong>/topics agreed with local stakeholders in each of the eight government<br />
regions. Delivery methods include conferences, workshops, farmer groups, one-toone<br />
advice and farm walks that are promoted through regional press and the web<br />
site (www.environmentsensitivefarming.co.uk). Evaluation of the campaign is key<br />
to tailoring the type of delivery and ensuring that changes in farming practices do<br />
actually happen. After 1 year, initial results demonstrate that the campaign strategy<br />
is effective in getting recipients to change their attitudes and behaviours particularly<br />
towards w<strong>as</strong>te and to some extent diffuse pollution management. The total number<br />
of ESF event attendees h<strong>as</strong> been low relative to the total number of farmers and<br />
advisers and a major challenge in 2006 will be to communicate with greater numbers<br />
and influence those who do not normally attend advice events.<br />
INTRODUCTION<br />
One of the key elements to the successful implementation of the Water Framework<br />
Directive will be the early establishment of effective diffuse pollution control me<strong>as</strong>ures<br />
in agriculture. It w<strong>as</strong> recognised in the Defra consultation on ‘Developing Me<strong>as</strong>ures<br />
to Promote Catchment-Sensitive Farming’ 1 that if a Programme of Me<strong>as</strong>ures (POMs)<br />
is to successfully achieve good ecological and chemical status by 2015, then a<br />
joint programme of point and diffuse pollution control would be necessary. Defra<br />
recognises that to achieve these targets an effective mechanism for diffuse pollution<br />
control is needed well in advance of the formal River B<strong>as</strong>in Management Plans and<br />
<strong>as</strong>sociated POMs in 2009.<br />
Agricultural w<strong>as</strong>te is currently excluded 2 from England, Wales and Northern<br />
Ireland’s w<strong>as</strong>te management controls 3 which were introduced in May 1994 (W<strong>as</strong>te<br />
Management Licensing Regulations 1994 4 ) and apply to all other sectors of industry<br />
and types of w<strong>as</strong>te. This exclusion contravenes the W<strong>as</strong>te Framework Directive and<br />
the Landfill Directive 5 . At present, section 75(7)(c) of the Environmental Protection<br />
Act 1990 excludes some w<strong>as</strong>tes including those from agricultural premises. Most<br />
agricultural w<strong>as</strong>te is currently disposed of on-farm by open burning, by burial or<br />
by disposal in ‘farm dumps or tips’ and these methods can cause pollution of the<br />
environment and harm to human health.<br />
1 Defra (2004). Developing Me<strong>as</strong>ures to Promote Catchment-Sensitive Farming. A joint Defra-HM Tre<strong>as</strong>ury Consultation.<br />
2 Section 75(7)(c) of the Environmental Protection Act 1990 excludes w<strong>as</strong>te from mines and quarries and agricultural premises.<br />
3 In Scotland w<strong>as</strong>te management controls have applied to agricultural w<strong>as</strong>te since 22 January 2005 [The W<strong>as</strong>te (Scotland) Regulations 2005 (SSI 2005<br />
Number 22)].<br />
4 SI 1994 No. 1056 <strong>as</strong> amended.<br />
5 On 9 December 2004, Defra issued a consultation on the draft W<strong>as</strong>te Management (England and Wales) Regulations which propose to repeal this<br />
exclusion, the consultation closed for comment on 18 March 2005. The Regulations will come into force in early 2006.<br />
137
The Environment Sensitive Farming (ESF) advice contract, launched in February<br />
2005, aims to encourage voluntary change in the behaviour and practices of land<br />
managers prior to the introduction of the POMs and to inform the new agricultural<br />
w<strong>as</strong>te management requirements. The advice campaign is outcome focussed and<br />
it is expected that farmers, land managers and their advisors will better understand<br />
the impact of farming practices on the environment, identify which practices are<br />
detrimental, which are beneficial and change their attitude and practices in order to<br />
reduce pollution and enhance the environment.<br />
At present there are a number of national and regional advice initiatives in addition<br />
to specific local projects in England, the incentive for their uptake by land managers<br />
being driven by grant schemes and legislation, e.g. Environmental Stewardship (ES)<br />
and Cross Compliance. A key challenge to the success of the ESF campaign is<br />
to ensure that the target audience is motivated to implement voluntary changes in<br />
w<strong>as</strong>te and diffuse pollution management. This is being achieved demonstrating how<br />
existing legislation or schemes can be integrated with the requirements of improved<br />
management practices, thus ensuring compliance and financial benefits whilst at the<br />
same time managing w<strong>as</strong>te and diffuse pollution. Figure 1 illustrates how the various<br />
directives, schemes and initiatives inform the content of the ESF advice campaign.<br />
Figure 1: The integration of directives, schemes and initiatives which inform<br />
the Environment Sensitive Farming project<br />
Many previous advice projects have not focussed on the success of their impact<br />
and identified whether actual changes in attitudes, behaviours or practices have<br />
taken place in response to the advice given. A significant component of the ESF<br />
project independently evaluates the success of the delivery methods and the impact<br />
delivery events have.<br />
METHODOLOGY<br />
ESF is a Defra-funded, Rural Development Service (RDS) managed, programme of<br />
free advice targeted at farmers, contractors, advisors (agricultural and environmental)<br />
and distributors. The 3-year programme commenced in December 2004 and is<br />
138
delivered at the regional level by ADAS, The Arable Group (TAG) and The Dairy Group<br />
with support from the NFU, CLA and LEAF and working closely with the relevant RDS<br />
Regional Farm Advice Co-ordinator (RFAC). Advice is given to land managers and key<br />
influencers on nutrient, manure, soil, pesticide and w<strong>as</strong>te management. Conferences,<br />
workshops/seminars, farmer discussion/self-help groups, farm walks, individual farm<br />
visits are all used <strong>as</strong> advice delivery methods. ActiveSolutions, a specialist public<br />
relations company with extensive experience with the agricultural industry, h<strong>as</strong><br />
developed a comprehensive publicity and promotional programme directed at farmers<br />
and advisors on environmental issues. The approach includes the use of national<br />
and regionally published topical articles in the farming and local press in addition to<br />
targeted advertising of events and through postal invitations to individuals to attend<br />
local events. The ESF website (www.environmentsensitivefarming.co.uk) promotes<br />
the project, provides an events calendar and bookings facility, includes technical<br />
information, relevant legislation, PowerPoint presentations and links to collaborators<br />
and other relevant sites. All information is available for downloading and use without<br />
copyright restrictions. Events are planned in accordance with regional prioritisation<br />
plans that are approved annually with the RDS project manager and developed with<br />
the RFACs and in consultation with organisations such <strong>as</strong> the Environment Agency,<br />
the NFU and English Nature. The intention is to improve the targeting and prioritising<br />
of resources and advice and to use existing networks such <strong>as</strong> LEAF demonstration<br />
farms, and NFU and CLA, together with their facilities.<br />
MacLeod Research Ltd h<strong>as</strong>, independently evaluated events and their success to<br />
date. In the 8-month period, February 2005 to September 2005, 45 ESF events were<br />
held. Evaluation forms, completed at events, from a total of 348 land managers,<br />
294 advisors and 105 other agricultural influencers have been processed. B<strong>as</strong>eline<br />
surveys (attitudes and practice prior to attending events) from a total of 286 land<br />
managers and 220 advisors attending these events have been processed. Followup<br />
surveys (to identify whether changes in practices have actually happened 3 to<br />
5 months after each event took place) were conducted by telephone with 139 land<br />
managers and 136 advisors/ influencers. This paper provides a snapshot from the<br />
early months of the three-year programme and provides some useful messages from<br />
the farmers and advisers influenced to date. The findings are b<strong>as</strong>ed on the 747 event<br />
evaluation surveys, 506 b<strong>as</strong>eline surveys and 275 follow-up surveys processed for<br />
this period.<br />
RESULTS<br />
Understanding and Attitudes to Diffuse Pollution<br />
Two out of three advisors and influencers completing b<strong>as</strong>e-line surveys between<br />
February and September 2005 said that they did not fully understand the term<br />
‘diffuse pollution’. Eighty per cent of the land managers and 82% of the advisors<br />
and influencers interviewed 3 and 5 months after the ESF events held in February<br />
to April 2005 said that their understanding of diffuse pollution had improved <strong>as</strong> a<br />
result of attending the event. 47% of land managers and one in three advisors/<br />
influencers said that their limited understanding of ‘diffuse pollution’ had improved<br />
<strong>as</strong> a result of attending an ESF event. A further 33% of land managers and half of the<br />
advisors/ influencers attending said that although they had a good understanding of<br />
‘diffuse pollution’ before the ESF event, their understanding of ‘diffuse pollution’ had<br />
139
improved further <strong>as</strong> a result of attending the ESF event.<br />
The ESF Campaign h<strong>as</strong> influenced the attitudes of 59% of land managers and 40%<br />
of the advisors and influencers interviewed 3 and 5 months after the ESF events<br />
held in February to April 2005 towards diffuse pollution. Forty-four per cent of land<br />
managers and one in three advisors and influencers said that <strong>as</strong> a result of attending<br />
the ESF event, they now have a greater sense of personal responsibility towards<br />
tackling diffuse pollution at farm level and a further 15% of land managers and 7%<br />
of advisors and influencers said that they have been persuaded that agriculture does<br />
cause some pollution problems. One in ten of the attending land managers still do<br />
not accept that agriculture is a major cause of diffuse pollution.<br />
Intentions to Change<br />
Two-thirds (67%) of the land managers attending ESF events held in February to<br />
April 2005 were planning to instigate me<strong>as</strong>ures to tackle diffuse pollution or make<br />
further improvements and changes to their farm practices <strong>as</strong> a result of attending the<br />
ESF event. Fifty-eight per cent of land managers said that <strong>as</strong> a result of attending<br />
the ESF event they were planning to make further changes and/or improvements to<br />
their farm practices with regard to tackling diffuse pollution. A further 9% of land<br />
managers are planning to start tackling diffuse pollution <strong>as</strong> a result of attending an<br />
ESF event. Twenty-five per cent of the land managers attending ESF events held in<br />
February to April 2005 felt that they had had been re<strong>as</strong>sured by the event that they<br />
were already fully addressing all of the diffuse pollution issues and have no need to<br />
make further changes.<br />
Motivators and Barriers to Change<br />
Sixty-seven per cent (94) of land managers attending an ESF event, indicated<br />
that concern for the environment, a greater understanding of diffuse pollution and<br />
legislation were the most frequently mentioned motivators behind the intention to<br />
change. Sixty per cent thought that financial considerations would motivate their<br />
change but only 22% thought peer pressure would change their practice. Analysis of<br />
weighted data shows that concern for the environment is by far the most important<br />
motivating factor for intention to change farming practice in order to tackle diffuse<br />
pollution (seven times more so than for peer pressure). The four most common barriers<br />
to change perceived by both land managers and advisors/influencers attending the<br />
ESF events in February to April 2005 were cost, insufficient time or labour, likely<br />
impact on profitability and too many other things to do. One in three advisors also<br />
saw lack of knowledge to be a barrier to change and 44% of advisors believed that<br />
land managers’ lack of conviction about the problem or the effectiveness of any<br />
actions taken could be a barrier to change. However, 38% of land managers <strong>as</strong>ked<br />
this question said that they could not think of any barriers to implementing changes<br />
regarding the management of diffuse pollution on farm.<br />
Other Organisations and Initiatives Influencing Change of Farming<br />
Practice<br />
ESF h<strong>as</strong> an important signposting role to other advice initiatives and farm advisors<br />
in particular, acknowledge the influence of the Single Payment Scheme (SPS), ES<br />
schemes and the Environment Agency in persuading land managers to change their<br />
140
practices. One in four (27%) land managers attending the ESF events in February to<br />
April 2005 said that no other organisation or initiative apart from ESF had played a<br />
part in persuading them to change farming practice regarding diffuse pollution.<br />
Advisors’ Competence and Confidence in Delivering Advice on Diffuse<br />
Pollution<br />
Prior to attending the ESF events one in four of the advisors (25%) said that they<br />
had insufficient understanding of the causes of ‘diffuse pollution’ and one in four<br />
(27%) of the advisors said that they had insufficient understanding of the effects of<br />
‘diffuse pollution’ on farms. Survey results indicated that prior to attending the ESF<br />
events held between February and September 2005, a considerable proportion of<br />
advisors (60% or more) were not ‘very confident’ in providing advice in a number<br />
of are<strong>as</strong> relating to diffuse pollution management. Even more (70–80%) were not<br />
‘very confident’ to give advice on biobeds, composting, w<strong>as</strong>te minimisation and safe<br />
disposal of w<strong>as</strong>te chemicals (Table 1).<br />
Table 1:<br />
Advisors’ confidence in providing advice in order to reduce pollution<br />
Advice area<br />
% Very<br />
confident<br />
% Quite<br />
confident<br />
Nutrient planning 33 45 18<br />
Manure management 32 50 15<br />
Dirty water management 17 47 17<br />
Water margin management 29 54 18<br />
Buffer strips 22 48 11<br />
Biobeds 7 27 60<br />
Safe disposal of w<strong>as</strong>te chemicals 24 41 30<br />
Composting 8 34 53<br />
W<strong>as</strong>te minimisation 10 49 40<br />
Soil compaction / poaching 31 53 12<br />
Soil erosion 30 51 13<br />
B<strong>as</strong>eline no 220 (‘no responses’ not included).<br />
Management Changes<br />
% Not<br />
confident<br />
The majority of land managers were taking some me<strong>as</strong>ures to manage soil damage<br />
and erosion prior to attending the ESF events but were further motivated to take<br />
further action towards soil management, e.g. using options in ELS to prevent soil<br />
erosion and to provide buffer strip margins next to ditches, water courses and<br />
roads. Almost half of the land managers attending the ESF events on nutrients were<br />
already producing a nutrient management plan but post event were now producing<br />
or intending to produce a nutrient management plan. All but 3% of advisors are now<br />
advising or planning to advise their clients to produce a nutrient management plan.<br />
Advisors appear to be the most confident about advising their clients on nutrient<br />
management and the majority said they were recommending most of the specific<br />
actions prior to attending the ESF event where appropriate. Seventy-five per cent<br />
of land managers attending the ESF events believe that farmers <strong>as</strong> a whole need<br />
141
to do more to reduce pesticide impact on the environment. Since attending the<br />
ESF events, a high proportion of land managers plan to look for opportunities to<br />
limit the impact of pesticides through ELS and also at disposing of spray containers<br />
through w<strong>as</strong>te disposal contractors. Advisors were, at the time of surveying, largely<br />
unconfident about giving advice on the new w<strong>as</strong>te management regulations. The<br />
land managers’ approach to managing w<strong>as</strong>te, prior to the ESF events, appears to be<br />
focused on limiting the amount of w<strong>as</strong>te coming on to farm. Some land managers had<br />
considered how their w<strong>as</strong>te can be managed however the majority of land managers<br />
were disposing of pl<strong>as</strong>tic w<strong>as</strong>tes by burning or incineration rather than considering<br />
recycling or more environmentally friendly ways of disposal. Very few land managers<br />
(prior to the ESF events) had changed enterprise management or considered using a<br />
w<strong>as</strong>te contractor to minimise the impact of farm w<strong>as</strong>te on the environment. Virtually<br />
none of the land managers prior to the ESF events had considered shared schemes<br />
or ventures with their neighbours/local community.<br />
DISCUSSION<br />
The survey for early 2005 indicates that most land managers and advisors view the<br />
advice campaign positively and recognise that farming can be a major contributor to<br />
the diffuse pollution problem. In addition, many admitted that prior to attending an<br />
ESF event they did not recognise that some of their practices caused problems or<br />
they were completely unaware of water quality problems in their catchment. Some<br />
attendees also went so far <strong>as</strong> to say that ESF had prompted them to actually change<br />
their farming practices while others were planning to. The survey findings indicate<br />
that actions by land managers and their advisors to minimise the impact of nutrient<br />
losses and pesticide residues have already been undertaken prior to attending the<br />
ESF events. However, it is not clear whether this is because the audience is selfselective<br />
towards those land managers and advisors who are already proactive<br />
in these are<strong>as</strong> or because other environmental initiatives and land stewardship<br />
schemes have already targeted diffuse pollution issues relating to pesticide and<br />
nutrient management. Advisor confidence to deliver advice on all of the topics w<strong>as</strong><br />
lower than anticipated and the campaign needs to continue to prioritise targeting<br />
delivery to these key influencers.<br />
To date, the ESF campaign h<strong>as</strong> made the most significant impact on changes to<br />
attitudes and behaviours in the area of w<strong>as</strong>te management. Land managers and<br />
advisors prior to attending ESF events have held a p<strong>as</strong>sive attitude towards w<strong>as</strong>te<br />
management and events have specifically impacted on their attitudes and intended<br />
behaviour towards recycling and joint community ventures and schemes. Many of<br />
the other changes, whether adapted prior to or after attendance at the ESF campaign<br />
events are being driven by the SPS and ES schemes such <strong>as</strong> ELS. While many land<br />
managers and advisors were already actively involved in or looking towards ELS prior<br />
to attending the ESF events, the ESF campaign h<strong>as</strong> highlighted specific opportunities<br />
for tackling diffuse pollution within the ELS scheme. Both land managers and<br />
advisors giving feedback from the initial meetings held between February and April<br />
2005 show a strong preference for practical b<strong>as</strong>ed and on-farm events with formal<br />
seminars and interactive discussion groups being the le<strong>as</strong>t preferred format.<br />
142
In 2006, the campaign will integrate with existing sector initiatives such <strong>as</strong> industry led<br />
soil management workshops for outdoor pig and the potato sectors. Actual changes<br />
in practice will continue to be monitored by further follow up communication with<br />
attendees. We will also be considering how this advice contract can support and<br />
compliment the England Catchment Sensitive Farming Delivery Initiative in priority<br />
catchments.<br />
ACKNOWLEDGEMENTS<br />
The authors acknowledge the support of the Defra ESF advice panel and the<br />
significant inputs to the advice campaign from the RDS project manager, Sarah<br />
Escott and the RDS Regional Farm Advice Co-ordinators.<br />
143
MANAGING DIFFUSE POLLUTION FROM A FORESTRY<br />
PERSPECTIVE<br />
HM McKay 1 and TR Nisbet 2<br />
1<br />
Corporate and Forestry Support, Forestry Commission, 231 Corstorphine Road,<br />
Edinburgh, EH12 7AT, UK, E-mail: helen.mckay@forestry.gsi.gov.uk; 2 Forest Research,<br />
Alice Holt Lodge, Farnham, Surrey, GU10 4LH, UK<br />
SUMMARY<br />
Forest design and forest operations have the potential to both improve and degrade<br />
the water environment. The characterisation of rivers and lochs in Scotland in<br />
preparation for the implementation of the Water Framework Directive indicates<br />
that forestry activities are thought to be a contributory factor in about 16% of river<br />
and 40% of loch water bodies at risk from diffuse pollution. The Forest and Water<br />
Guidelines provide practical advice to be followed when planning and carrying out<br />
forest operations in order to minimise the risk of diffuse pollution from acidification,<br />
siltation, nutrient enrichment, high colour, iron, and manganese concentrations,<br />
pesticides, and fuel oils. Research h<strong>as</strong> shown the Guidelines to be effective at<br />
controlling these threats. Attention is incre<strong>as</strong>ingly shifting from viewing forestry <strong>as</strong><br />
a problem to exploring how it can be used to protect and improve water bodies. In<br />
particular, opportunities exist for forestry to help tackle diffuse pollution from more<br />
intensive land uses, especially agriculture.<br />
INTRODUCTION<br />
The UK Forestry Standard, first published in 1998 (Forestry Commission, 1998),<br />
outlines the Government approach to sustainable forestry. It sets out the criteria<br />
covering key <strong>as</strong>pects of sustainable forestry in the UK and identifies indicators at a<br />
national level and then the requirements that must be demonstrated at the level of<br />
the forest management unit.<br />
Three of the 18 criteria concern hydrology: water quality, water yield and water<br />
discharge patterns. The <strong>as</strong>sociated requirements are that water quality is protected<br />
or improved, water yields are maintained above any critical level and water discharge<br />
patterns are disturbed only when unavoidable and options have been explored.<br />
As examples of evidence of indicators at a forest management unit, the Standard<br />
suggests that local liaison takes place when appropriate and agreements for water<br />
are respected; an acceptable standard of forest design is applied to water margins;<br />
opportunities are taken to improve riparian zones in the course of forest operations;<br />
all operations are planned and carried out to minimise disturbance to watercourses<br />
and to avoid pollution and siltation; and that emergency pollution control me<strong>as</strong>ures<br />
are in place when high-risk operations are carried out. The Standard w<strong>as</strong> revised in<br />
2004 (Forestry Commission, 2004) but the criteria and indicators are unchanged.<br />
RIVERS AND LOCHS THOUGHT TO BE AT RISK<br />
The preliminary characterisation and impact analyses of Scottish River B<strong>as</strong>in Districts,<br />
published in 2005, identifies rivers and lochs considered to be at risk (Category 1a)<br />
and probably at risk (Category 1b) from diffuse pollution due to forestry activities. The<br />
144
datab<strong>as</strong>e constructed for the characterisation exercise lists in Category 1a four rivers<br />
and eight lochs where forestry is the primary pressure. Overall, forestry is considered<br />
to be a risk factor in 110 rivers and 28 lochs, equivalent to 16% of the total number<br />
of river and 40% of loch water bodies at risk from diffuse pollution in Scotland.<br />
Table 1:<br />
Characterisation of rivers and lochs in Scotland <strong>as</strong>sessed at risk of<br />
diffuse pollution due to forestry<br />
Category 1a<br />
Category 1b<br />
Number Length (km) Number Length (km)<br />
Primary River 4 63.497 18 181.026<br />
Loch 8 – 4 –<br />
Secondary River 24 189.054 64 622.409<br />
Loch 8 – 8 –<br />
MINIMISING THE RISK FROM FORESTRY<br />
How does the Forestry Commission prevent these potential risks of diffuse pollution<br />
becoming a reality? The Forests and Water Guidelines, which were first published<br />
in 1988 (Forestry Commission, 1988), form the key supporting document for the<br />
UK Forestry Standard and include the equivalent of Best Practice Guidance. These<br />
went through a substantial revision with the 4th edition, which w<strong>as</strong> published in 2003<br />
(Forestry Commission, 2003). The revision w<strong>as</strong> done in collaboration with both SEPA<br />
and EA.<br />
The Guidelines deal with the following <strong>as</strong>pects of diffuse pollution: acidification;<br />
siltation; nutrient enrichment; high colour, iron and manganese concentrations;<br />
pesticides; and fuel oils. All must be borne in mind by forest practitioners but<br />
some must also be tackled earlier at the planning stage and addressed at the<br />
catchment scale. These include: acidification, <strong>as</strong>sociated with both new planting and<br />
restocking; nutrient enrichment; and <strong>as</strong> a pollution control me<strong>as</strong>ure, the design and<br />
management of riparian buffer are<strong>as</strong>. The most important issues are acidification,<br />
nutrient enrichment and siltation.<br />
Acidification<br />
Acidification of fresh waters occurs where the inputs of sulphur and nitrogen<br />
pollutants exceed the buffering (neutralising) capacity of the soils and the underlying<br />
rocks through which water p<strong>as</strong>ses before entering streams, rivers and standing<br />
water. The buffering capacity of these receiving waters is also an important factor.<br />
The most acidified are<strong>as</strong> in the UK are in the uplands where catchments with b<strong>as</strong>epoor,<br />
slow weathering soils and rocks coincide with high pollutant inputs in the form<br />
of large volumes of moderately acidic rainfall. Although most pollutant inputs are now<br />
declining due to emission control, surface water acidification remains a particular<br />
problem in parts of central and south-west Scotland.<br />
The quantity of sulphur and nitrogen pollutants deposited at a given site is strongly<br />
influenced by the nature of the vegetation layer. Forest canopies can significantly<br />
incre<strong>as</strong>e the capture of some of these pollutants in the atmosphere. This incre<strong>as</strong>ed<br />
capture, often termed scavenging, is a function of the stand structure which creates<br />
145
turbulent air mixing. The effect therefore becomes more important <strong>as</strong> trees grow and<br />
the height of the stand incre<strong>as</strong>es. The enhanced capture of mist, which can contain<br />
large concentrations of sulphur and nitrogen, is greatest at high altitude because of<br />
the incre<strong>as</strong>ed duration of cloud cover and high wind speeds.<br />
Forest growth is usually limited by nitrogen availability, and drainage water from<br />
forests and woodlands generally h<strong>as</strong> very low nitrate concentrations. Consequently<br />
nitrogen deposition would not normally be expected to p<strong>as</strong>s through undisturbed<br />
forest ecosystems and result in acidification of water. However, nitrate leakage<br />
from older forest stands h<strong>as</strong> been identified in are<strong>as</strong> of high nitrogen deposition,<br />
e.g. in south Scotland. There is concern that forest soils are becoming incre<strong>as</strong>ingly<br />
saturated with nitrogen and that this could lead to a marked rise in nitrate losses and<br />
thus acidification.<br />
Significant nitrate leakage is also known to result from harvesting operations. This<br />
is due to incre<strong>as</strong>ed rates of mineralisation and nitrification in the soil in the absence<br />
of uptake by the trees. This pulse may l<strong>as</strong>t for 2–5 years, depending upon the rate<br />
of re-vegetation. While an incre<strong>as</strong>e in nitrate concentrations in soil and stream<br />
waters poses only a very small risk of exceeding environmental quality standards, of<br />
more concern is the short-term incre<strong>as</strong>e in hydrogen ion concentration which may<br />
contribute to acidification and incre<strong>as</strong>e aluminium solubility.<br />
The incre<strong>as</strong>ed capture of acidic pollutants by forests could delay the recovery of<br />
acidified waters or even lead to further acidification in the most sensitive are<strong>as</strong>.<br />
Large-scale conifer afforestation represents the greatest threat while the replanting<br />
of existing forests can also be a cause for concern. In order to protect the freshwater<br />
environment, the Guidelines require the Forestry Commission to take the scavenging<br />
effect into account when considering new planting or restocking plans. Both the<br />
Forestry Commission and applicants must identify which are<strong>as</strong> are most at risk.<br />
An indication of a site’s sensitivity is obtained by the maximum pollutant load that a<br />
given ecosystem can tolerate without suffering adverse change – the critical load. For<br />
fresh waters, critical loads can be calculated which, provided they are not exceeded,<br />
should ensure the maintenance of water chemistry suitable for the protection of<br />
populations of fish and other freshwater biota. Defra have calculated critical loads<br />
for fresh waters for 10-km 2 grid square samples incorporating the role of N <strong>as</strong> well<br />
<strong>as</strong> S. Having compared these with total pollutant inputs of S and N, maps have<br />
been derived that indicate where critical loads for total acidity for fresh waters are<br />
exceeded.<br />
The Forestry Commission h<strong>as</strong> built in three additional safety margins to the Guidelines.<br />
We have used the deposition data from 1995–97 (ECRC, 2001) even though pollutant<br />
depositions have reduced significantly since then and are expected to continue to do<br />
so up to 2010 and beyond. The impact of new planting and restocking plans must be<br />
considered not only in exceedance squares but also in all adjacent squares. L<strong>as</strong>tly in<br />
view of the requirement to protect cSACs), site-specific data, if available, are used to<br />
refine the <strong>as</strong>sessments of acidification risks for designated river catchments.<br />
The indicative nature of the 10-km scale critical load exceedance map means that a<br />
more detailed catchment-b<strong>as</strong>ed <strong>as</strong>sessment might be required for determining the<br />
146
actual susceptibility of individual waters to a forest scavenging effect within both<br />
exceeded and adjacent critical load squares.<br />
Planting<br />
For new planting, the Forestry Commission, taking advice <strong>as</strong> necessary from the<br />
appropriate water regulatory authority, will determine the need for the more detailed<br />
<strong>as</strong>sessment depending on the size of the planting scheme, species mix, altitude, the<br />
proportion of forestry already in the catchment, soils, geology, and the sensitivity of<br />
local water uses. Broadleaved woodland poses less of an acidification threat due<br />
to the smaller scavenging effect, but the impact of larger planting schemes merits<br />
consideration.<br />
In some c<strong>as</strong>es, <strong>as</strong>sessment will be possible on the b<strong>as</strong>is of existing information.<br />
Where sufficient information is not already available, <strong>as</strong>sessment is likely to involve the<br />
collection of one or more water samples at high flow (preferably in January, February,<br />
or March, when conditions tend to be most acidic) from the main watercourse<br />
receiving drainage from the area proposed for new woodland. The results from the<br />
chemical analyses will be used to calculate the receiving water’s critical load. This<br />
will then be compared with the 1995–97 total pollutant deposition of S and N for the<br />
appropriate critical load grid square. Where the deposition exceeds the critical<br />
load, approval of a planting grant is unlikely until there are further reductions in<br />
pollutant emissions.<br />
Restocking<br />
Harvesting temporarily eliminates pollutant scavenging until restocked crops approach<br />
canopy closure at around 15 years of age. By this time, agreed emission reductions<br />
are predicted to protect many catchments from the risk of further acidification. The<br />
combination of these factors means that in the future forest replanting will be less<br />
likely to contribute to the exceedance of freshwater critical loads compared to the<br />
first rotation. Nevertheless there are some circumstances where restocking plans<br />
require greater scrutiny, particularly higher altitude stands (> 300 m) at which level<br />
the scavenging of pollutant cloud deposition is known to incre<strong>as</strong>e markedly. Where<br />
conifer forest occupies a large proportion of the catchment above this altitude,<br />
consideration should be given to selective deforestation, subject to a detailed<br />
catchment-b<strong>as</strong>ed <strong>as</strong>sessment <strong>as</strong> part of an Environmental Impact Assessment<br />
under environmental impact regulations applying in the different countries. Also in the<br />
c<strong>as</strong>e of catchments designated <strong>as</strong> cSACs in critical loads exceedance and adjacent<br />
squares, a detailed catchment-b<strong>as</strong>ed <strong>as</strong>sessment is required for forest replanting<br />
under the Habitats Directive regardless of altitude.<br />
The short-term rele<strong>as</strong>e of nitrate that can follow the large-scale harvesting of some<br />
forest sites may pose an additional acidification threat within acid-sensitive are<strong>as</strong> and<br />
there may be a need to carry out a site impact <strong>as</strong>sessment depending on catchment<br />
size, the timing of felling operations, species mix, local soils and geology, and the<br />
presence of fish. Sites found to be at risk will require the size of felling area to<br />
be reduced and the adoption of management practices designed to minimise<br />
nitrate losses.<br />
147
Although nitrate leaching can be reduced by whole-tree harvesting, a much larger,<br />
longer-term threat of soil and water acidification is presented by the greater removal<br />
of b<strong>as</strong>e cations in harvested produce. Consequently, whole-tree harvesting is not<br />
recommended in critical load exceedance or adjacent squares, except on steep<br />
sites where whole trees have to be extracted to roadside.<br />
Biological recovery of streams showing chemical improvement in response to emission<br />
reductions may benefit from the opening-out of stream sides. Where practicable,<br />
these are<strong>as</strong> should be targeted for earlier clearance of stands c<strong>as</strong>ting heavy shade<br />
and cleared zones linked to aid upstream migration of fish and invertebrates.<br />
Nutrient enrichment<br />
There is concern that the nutrient, and hence the ecological, status of fresh waters,<br />
particularly standing waters, may be significantly changed following the aerial<br />
application of phosphate fertilisers in their catchments. Fertilisers may be accidentally<br />
sprayed or blown into watercourses, or may be transported indirectly via subsequent<br />
leaching or run-off. Waters vary in their sensitivity to nutrient enrichment from forestry,<br />
with nutrient-poor (oligotrophic) waters most at risk of nutrient pollution.<br />
Aerial phosphate fertiliser must be carefully planned to ensure that phosphate losses<br />
from consecutive applications in a given catchment do not exceed environmental<br />
quality standards in receiving lakes or reservoirs. Applications exceeding a total<br />
area of 50 ha in any 3-year period may pose a problem; the effect will depend on the<br />
soil properties, timing of application, size of the catchment and the characteristics of<br />
the water body. Early consultation with the water regulatory authority will establish<br />
whether a more detailed site <strong>as</strong>sessment is required. Assessments need to include<br />
phosphate rele<strong>as</strong>es from large-scale felling operations, which can be significant on<br />
some soil types.<br />
Fertiliser usage is declining in forestry in line with the reduction in new planting and<br />
a shift to more fertile soils. A move to more hand applications and better targeting<br />
of aerial treatments through the use of granulated fertiliser and improved helicopter<br />
guidance systems, are also reducing the risk of nutrient pollution.<br />
The generally higher nutrient status of lowland soils means that lowland woodlands<br />
rarely require fertiliser applications. Thus woodland planting on ex-agricultural land<br />
may help to reduce leaching losses and tackle nutrient pollution within sensitive<br />
are<strong>as</strong> such <strong>as</strong> Nitrate Vulnerable Zones (NVZs). Opportunities exist for maximising<br />
this benefit through the targeted planting of riparian and downslope buffer are<strong>as</strong>.<br />
Forest type is an important factor, with conifer forests less able to reduce nutrient<br />
concentrations in drainage waters. This is because of their ability to capture nitrogen<br />
pollutants from the atmosphere and concentrate nitrate levels in groundwater,<br />
particularly in are<strong>as</strong> of low rainfall. High nitrogen inputs can result where forests are<br />
downwind of local pollutant sources, such <strong>as</strong> intensive pig- and poultry-rearing units.<br />
This is likely to be an incre<strong>as</strong>ingly important consideration with the expansion of<br />
NVZs. The main are<strong>as</strong> at risk are those receiving low rainfall where the concentrating<br />
effect of evaporation is disproportionately large. Consideration should be given to<br />
avoiding large-scale conifer planting within NVZs receiving < 650 mm annual<br />
rainfall.<br />
148
Siltation<br />
Siltation principally results from soil disturbance <strong>as</strong>sociated with ground cultivation,<br />
drainage, road construction and maintenance, and harvesting operations. It is<br />
best managed at the site level and good site planning is an essential part of any<br />
forest operation. The Guidelines require a methodological approach, which involves<br />
consideration of available techniques and resources, the potential environmental<br />
impacts of the work, and early consultation with appropriate bodies to <strong>as</strong>sess the<br />
sensitivity of the area. Usually there will be a need for a detailed site <strong>as</strong>sessment and<br />
the production of a well-annotated map (site plan) showing pertinent information,<br />
particularly site constraints. Common <strong>as</strong>pects are:<br />
• the need for meticulous planning and supervision of operations;<br />
• the adoption of less disruptive practices;<br />
• the careful matching of machinery to site conditions;<br />
• varying the scale and timing of operations according to site sensitivity;<br />
• the use of a wide range of protective me<strong>as</strong>ures; and<br />
• the preparation of a contingency plan in c<strong>as</strong>e of the accidental spillage of<br />
chemicals or oils.<br />
Effectiveness of the Forests and Water Guidelines<br />
Research and monitoring have played a key role in <strong>as</strong>sessing the effectiveness of<br />
best management practices (Nisbet, 2001). The preferred approach h<strong>as</strong> been to form<br />
a partnership with the water regulatory authorities and others in undertaking this<br />
work. In general, sensitive catchments and large-scale treatments were selected to<br />
provide good test c<strong>as</strong>es. Where possible both water quality and biology are examined.<br />
Results are published, often in peer-reviewed scientific literature, for general scrutiny.<br />
Examples relevant to afforestation are Nisbet et al. (1995), Nisbet (1997) and Nisbet<br />
et al. (2002). The effects of fertiliser applications are described in Nisbet and Stonard<br />
(1995) and Lees and Tervet (1994). Road construction, harvesting and restocking<br />
impacts are written up by Pratt et al. (1996), Neal and Reynolds (1998), and Nisbet et<br />
al. (2002). These studies confirm the effectiveness of the Guidelines in controlling the<br />
threat of diffuse pollution from forestry. Demonstration studies such <strong>as</strong> the EU LIFE<br />
UK182 Project in Galloway (CVCWT, 2004) have also played a vital part in promoting<br />
and communicating the success of best practice for protecting the freshwater<br />
environment.<br />
THE USE OF WOODLANDS IN AGRICULTURAL LANDSCAPES<br />
The success of the Guidelines h<strong>as</strong> resulted in attention shifting from viewing forestry<br />
<strong>as</strong> a threat to exploring how it can be used to improve the ecological status of water<br />
bodies. In particular, opportunities exist for forestry to help tackle diffuse pollution<br />
from more intensive land uses such <strong>as</strong> agriculture. One example is the use of riparian<br />
woodland buffers to retain sediments, nutrients and pesticides in waters draining<br />
from adjacent farmland. Investigations of the use of forestry in largely agricultural<br />
catchments are beginning to demonstrate the potential value of woodlands. Work<br />
in the upper reaches of the Severn within the Pontbren catchment showed that<br />
149
infiltration of water sheeting off grazed p<strong>as</strong>ture disappeared into the soil when it<br />
p<strong>as</strong>sed into recently planted shelterbelts (Carroll et al., 2004). Infiltration incre<strong>as</strong>ed<br />
dramatically under 6- to 8-year-old trees but there seemed to be an effect even under<br />
2-year-old trees which could be due to the effect of tree roots and soil animal activity<br />
and also reduced grazing pressure. Replicated experiments have been set up to<br />
examine the effect in greater details.<br />
Broadmeadow and Nisbet (2005) have shown how the width of the buffer, the structure<br />
of the vegetation and species choice can be manipulated to maximise this benefit.<br />
Another example is the use of woodland to protect erosion prone soils and control<br />
sediment losses. A guide h<strong>as</strong> been produced b<strong>as</strong>ed on studies at B<strong>as</strong>senthwaite<br />
in the Lake District, which describes a catchment approach that is being used by<br />
a partnership of organisations to control sediment inputs to the lake (Nisbet et al.,<br />
2004).<br />
NEXT STEPS<br />
Waterbodies categorised <strong>as</strong> Category 1b are the focus of more detailed <strong>as</strong>sessments<br />
to determine whether or not they are actually at significant risk. The Forestry<br />
Commission h<strong>as</strong> participated in the SEPA project to develop a screening tool to<br />
identify and characterise diffuse pollution pressures.<br />
Attention will focus on the rivers and lochs where forestry h<strong>as</strong> been identified <strong>as</strong> a<br />
factor in placing these water bodies at risk. Forest design and management practices<br />
will be <strong>as</strong>sessed to ensure that the Guideline me<strong>as</strong>ures are appropriate and sufficient<br />
to minimise any threat.<br />
Effort will also be given to exploring how forestry could be better integrated with<br />
farming to benefit water quality and ecology. There are clear opportunities for<br />
developing win-win solutions using woodland to help reduce both diffuse pollution<br />
and the generation of flood flows, <strong>as</strong> well <strong>as</strong> providing a range of nature conservation,<br />
recreation and landscape benefits.<br />
In parallel, research continues to test the Guidelines in practice and <strong>as</strong>sess the effect<br />
of new developments, such <strong>as</strong> continuous cover forestry, short rotation forestry and<br />
urban woodlands. Climate change is another important area of work, which h<strong>as</strong> the<br />
potential to affect most forest and water issues. One example of current research<br />
is a study in the New Forest of the role of riparian woodland shade in controlling<br />
summer maximum stream temperatures. The Forestry Commission will continue to<br />
review and update the Guidelines to ensure that they reflect the most recent research<br />
and experience. This will help to ensure that the forestry sector makes a positive<br />
contribution to safeguarding the sustainable use of the UK’s water resources.<br />
150
REFERENCES<br />
Broadmeadow S and Nisbet T (2005). The effects of riparian forest management<br />
on the freshwater environment: a literature review of best management practice.<br />
Hydrology and Earth System Sciences 8, 286–305.<br />
Carroll ZA, Bird SB, Emmett BA, Reynolds B and Sinclair FL (2004). Can tree shelter<br />
belts on agricultural land reduce flood risk? Soil Use and Management 20, 357–<br />
359.<br />
Cree Valley Community Woodland Trust (2004). Sustainable forestry to protect water<br />
quality and aquatic biodiversity. Final Report on EU LIFE Project UK 182. CVCWT,<br />
Newton Stewart.<br />
Environment Change Research Centre (2001). Acidification of freshwaters: the role<br />
of nitrogen and the prospects for recovery. Environmental Change Research Centre<br />
Report No 79, University College London, London<br />
Forestry Commission (1988). Forests and Water Guidelines. Forestry Commission,<br />
Edinburgh.<br />
Forestry Commission (1998). The UK Forestry Standard. Forestry Commission,<br />
Edinburgh.<br />
Forestry Commission (2003). Forests and Water Guidelines. Fourth Edition. Forestry<br />
Commission, Edinburgh<br />
Forestry Commission (2004). The UK Forestry Standard. Second Edition. Forestry<br />
Commission, Edinburgh.<br />
Lees FM and Tervet DJ (1994). Final Report on the Effect of Fertiliser Application to<br />
the Ellergower Knowe Plantation. Solway River Purification Board, Dumfries.<br />
Neal C and Reynolds B (1998). The Impact of Conifer Harvesting and Replanting<br />
on Upland Water Quality. Environment Agency Research & Development Technical<br />
Report P211. Environment Agency, Bristol.<br />
Nisbet TR (1997). The sustainability of afforestation development within highland<br />
catchments supporting important salmonid fisheries – the Upper Halladale River.<br />
In: Forest Research Annual Report and Accounts 1997–1998. The Stationary Office,<br />
Edinburgh.<br />
Nisbet TR (2001). The role of forest management in controlling diffuse pollution in UK<br />
Forestry. Forest Ecology and Management 143, 215–226.<br />
Nisbet TR and Stonard JS (1995). The effect of aerial applications of urea fertiliser on<br />
stream water quality. Forestry Commission Research Information Note 266. Forestry<br />
Commission, Edinburgh.<br />
Nisbet TR, Fowler D and Smith IR (1995). An investigation of the impact of afforestation<br />
on stream-water chemistry in the Dee catchment, SW Scotland. Environmental<br />
Pollution 90, 111–120.<br />
151
Nisbet TR, Orr H and Broadmeadow S (2004). A Guide to Using Woodland for<br />
Sediment Control. Forest Research, Farnham.<br />
Nisbet TR, Welch D and Doughty R (2002). The role of forest management in<br />
controlling diffuse pollution from the afforestation and clearfelling of two public water<br />
supply catchments in Argyll, West Scotland. Forest Ecology and Management 158,<br />
141–154.<br />
Pratt JE, Nisbet TR, Tracy DR and Davidson J (1996). Boron content in surface<br />
water run-off from a clearfelled crop in West Scotland following stump treatment<br />
with Disodium octaborate tetrahydrate. Scandinavian Journal of Forest Research<br />
11, 370–374.<br />
152
THE USE OF FISH TO DETERMINE IMPACTS OF<br />
DIFFUSE POLLUTION ON RIVERS AND HUMAN HEALTH<br />
RGM Heath, HH du Preez and B Genthe<br />
Pulles Howard & de Lange Inc, P. O. Box 861, Auckland Park, Johannesburg, South<br />
Africa, E-mail: ralphh@phd.co.za<br />
INTRODUCTION<br />
Modern agriculture, industrialization and urbanization have negatively affected<br />
environmental quality and specifically aquatic systems (Förstner and Wittmann,<br />
1983). In South Africa, the pollution of freshwater aquatic systems can be linked to<br />
point source discharges (w<strong>as</strong>te water treatment works and industrial effluents) and<br />
diffuse surface run-off (agricultural, mining, informal settlements and urban). As a<br />
result of these anthropogenic activities, innocent people <strong>as</strong> well <strong>as</strong> other life forms<br />
may be exposed to harmful contaminants that may be rele<strong>as</strong>ed without adequate<br />
consideration of human health and the environmental effects (Tchounwou et al.,<br />
1996).<br />
Effects on human health <strong>as</strong> a result of exposure to surface water contaminants<br />
can occur through contact recreation, drinking water and the consumption of<br />
contaminated food for example, fish and shellfish (USEPA, 1991). People consuming<br />
fish or shellfish are potentially at risk <strong>as</strong> these organisms have the potential to<br />
bioaccumulate harmful contaminants from the aquatic environment (USEPA, 1991;<br />
Bevelhimer, 1995). The contaminants that have been bioaccumulated by the fish<br />
or shellfish pose carcinogenic, genotoxic and non-carcinogenic health risks to<br />
consumers (Reinert et al., 1991; USEPA, 1991). It must be stressed, however, that the<br />
consumption of fish is generally beneficial <strong>as</strong> it provides a good source of protein,<br />
vitamins, omega fatty acids and b<strong>as</strong>ic minerals (USEPA, 1997), <strong>as</strong> well <strong>as</strong> many<br />
others benefits. It is evident that the consumption of fish is beneficial to humans, but<br />
if these fish are contaminated they pose a health risk to consumers.<br />
As a result of the potential health risk <strong>as</strong>sociated with the consumption of chemically<br />
contaminated non-commercially caught fish, the United States of America h<strong>as</strong> been<br />
issuing fish consumption advisories and bans that are designed to reduce the risk to<br />
fish consumers (USEPA, 1995a, 1999).<br />
The results of metal surveys in South Africa linking human health and consumption<br />
of fish have indicated that in highly industrialised catchments and those with mining<br />
activities (mainly gold and coal), that the metals in the fish tissues are at levels that<br />
could cause human health risks under different exposure scenarios (Heath, 1999;<br />
Heath et al., 2004a,b). Similarly studies undertaken on biocides from diffuse pollution<br />
sources such <strong>as</strong> intensive agriculture, forestry and where malaria control is practiced<br />
have indicated that the levels of pesticides recorded in the fish could possible cause<br />
human health risks under different exposure scenarios (Bouwman et al., 1990; Heath,<br />
1999; Heath and Cla<strong>as</strong>sen, 1999).<br />
From the preceding it is evident that possible human health risks due to the<br />
consumption of contaminated fish from South African freshwater systems have<br />
received little attention. This is an unacceptable situation <strong>as</strong> pollutants from various<br />
153
anthropogenic activities are polluting these systems (Heath, 1999). Furthermore, fish<br />
are captured from many of the water bodies in South Africa by recreational and<br />
subsistence fisherman, while commercial fishing and cage culture are undertaken at<br />
selected systems. Therefore, certain sections of the South African population that<br />
consume fish may be at risk from the possible exposure to contaminants accumulated<br />
by fish captured from freshwater systems. Information regarding the possible health<br />
risk due to the consumption of fish from the freshwater systems in South Africa is<br />
therefore urgently required.<br />
The general objective of this paper is to provide a generic methodology that would<br />
give guidance in the undertaking of fish contaminant surveys in South Africa to provide<br />
information regarding the possible health risk if the fish are consumed by recreational<br />
and subsistence fishermen (Heath et al., 2004a,b). It must, however, be stressed<br />
that developing and implementing methodologies to manage and reduce the human<br />
health risk <strong>as</strong>sociated with the consumption of freshwater fish will also benefit the<br />
aquatic ecosystem at large. The ecosystem will benefit, <strong>as</strong> the ultimate goal of the<br />
management strategy would be to protect the freshwater aquatic environment and<br />
to put remedial actions in place that would ensure that the fish populations of the<br />
system are fit for present and future human consumption.<br />
METHODOLOGY DEVELOPED USING FISH TO DETERMINE POLLUTION<br />
AND HUMAN HEALTH RISK<br />
Although the United States of America h<strong>as</strong> issued fish contaminant advisories since<br />
the mid-1970s the various Agencies have employed different methods to estimate<br />
the risks to human health from the consumption of chemically contaminated fish.<br />
Subsequently the United States of America Environmental Protection Agency<br />
(USEPA) h<strong>as</strong> developed a series of four documents to provide guidance to Agencies<br />
issuing fish consumption advisories for non-commercial fishing (USEPA, 1995a,b,<br />
1996, 1997). From these documents it is evident that a fish consumption advisory<br />
programme should consist of:<br />
• fish sampling and analysis, therefore the collection of contaminant data,<br />
• risk <strong>as</strong>sessment,<br />
• risk management and<br />
• a risk communication and <strong>as</strong>sociated health advisory programme.<br />
However, much of the information and guidance provided in these documents h<strong>as</strong> a<br />
wider application and could <strong>as</strong>sist in the development of any investigation related to<br />
the <strong>as</strong>sessment of contaminant levels in fish and shellfish.<br />
In order to promote the use of fish to determine both ecological contamination<br />
and human health risk, two publications were developed in South Africa entitled:<br />
‘An Overview Guide to Determine the Human Health Risks of Eating South African<br />
Freshwater Fish’ (Heath et al., 2004a) and a ‘Reference Guide to Determine the<br />
Human Health Risks of Eating South African Freshwater Fish’ (Heath et al., 2004b).<br />
The fundamentals of the methodology are b<strong>as</strong>ed on catchment information (possible<br />
anthropogenic activities that can result in chemical pollution), socio-demographic<br />
154
information of consumers of freshwater fish in the catchment, bioaccumulation<br />
potential and health risks of analytes, sound sampling design, risk <strong>as</strong>sessment<br />
procedures and performing monitoring at different scales and depth (Figure 1). It is<br />
important to note the method developed is closely linked to the protocols proposed<br />
by the USEPA (1995a,b, 1996, 1997) for issuing fish consumption advisories for noncommercial<br />
fish and by Heath (1999) for the monitoring of pesticides and metals in<br />
South African rivers. The approach by Heath (1999) and the current approach are<br />
catchment-b<strong>as</strong>ed, making it possible to use much the data and information when<br />
undertaking any of the proposed levels of investigation. Therefore, if projects are<br />
carefully planned using the same methodology and principles, the data and information<br />
can be exchanged, which would ensure the optimal utilisation of resources.<br />
South African Methodology<br />
The methodology developed for South African human health risks <strong>as</strong>sociated with<br />
eating freshwater fish identifies ten major steps, namely:<br />
(i) selection of scale and depth of survey,<br />
(ii) <strong>as</strong>sessment of the water-body catchment,<br />
(iii) monitoring system design,<br />
(iv) field collection,<br />
(v) laboratory sample processing and analysis,<br />
(vi) analysis of and reporting of results,<br />
(vii) risk <strong>as</strong>sessment,<br />
(viii) risk management,<br />
(ix) risk communication, and<br />
(x) evaluation and review of the programme.<br />
The application of the protocol developed, even though it h<strong>as</strong> several sequential<br />
steps, must be seen <strong>as</strong> an iterative process. For example, during the <strong>as</strong>sessment of<br />
the water body (Step 2) it is important understand the needs of the risk <strong>as</strong>sessment<br />
(Step 7) so that the relevant information is collected at the appropriate time. The<br />
same applies to the collection of sample in the field (Step 4), which need to be<br />
collected and preserved according to the analytical Procedures (Step 6).<br />
The b<strong>as</strong>ic requirements of each step is highlighted <strong>as</strong> limited resources (financial,<br />
infr<strong>as</strong>tructure and skilled personnel) in South Africa would limit the possibility of<br />
undertaking detailed <strong>as</strong>sessments <strong>as</strong> undertaken by the United States of America<br />
Environmental Protection Agency (USEPA). Nevertheless, by applying the proposed<br />
protocol, sound comparable <strong>as</strong>sessments, b<strong>as</strong>ed on risk <strong>as</strong>sessment methodology,<br />
can be made regarding the human health risk <strong>as</strong>sociated with the consumption of<br />
freshwater fish in South Africa.<br />
Three monitoring levels are identified for the investigation of the chemical contaminant<br />
concentrations in freshwater fish tissue (Figure 1). The following levels of monitoring<br />
are considered for the South African surveys, namely Screening surveys, Intensive<br />
surveys (Ph<strong>as</strong>e I) and Intensive surveys (Ph<strong>as</strong>e II). The intensity of the level of<br />
155
monitoring is determined up front by governmental authorities at a national or<br />
provincial level <strong>as</strong> well <strong>as</strong> project managers of specific surveys who are responsible<br />
for designing fish chemical contaminant surveys (Figure 1). It is also important to<br />
note that these surveys are interlinked and naturally flow from the one to the next. To<br />
be cost-effective these levels should be applied in a hierarchical manner.<br />
STEP 7 RISK ASSESSMENT FOLLOWED<br />
Hazard Identification<br />
The likelihood that the exposure to a chemical under specific exposure conditions<br />
poses a threat to human health is <strong>as</strong>sessed. General information such <strong>as</strong> the physical<br />
and chemical properties of the chemical, routes and patterns of exposure, structureactivity<br />
relationships, metabolic and pharmacokinetic properties, toxicological<br />
effects, acute and chronic animal exposure studies, human studies, bioaccumulation<br />
potential, persistence and prevalence in the environment, and the biochemical fate<br />
of the contaminant are reviewed in hazard identification.<br />
The datab<strong>as</strong>es such <strong>as</strong> HEALTH EFFECTS SUMMARY TABLES (HEAST, 1998) Agency<br />
Toxic Substances and Dise<strong>as</strong>e Registry (ATSDR, 1999), Integrated Risk Information<br />
System (IRIS, 1999) and Toxicology Excellence for Risk Assessment (TERA, 1999)<br />
should be used to evaluate the toxicity and carcinogenicity of the various chemical<br />
contaminants. The software packages Risk*AssistantTM (Risk*AssistantTM, 1995)<br />
and the USEPA (1997) make this information readily available.<br />
Dose–response Assessment<br />
The relationship between the dose of a hazardous chemical (i.e. the amount of the<br />
chemical taken into the body through skin contact, breathing and ingestion) and the<br />
incidence of an adverse health effect in the exposed population is characterised.<br />
Hazardous chemicals can be broadly grouped <strong>as</strong> those with non-threshold effects<br />
(causing carcinogenic and genotoxic health effects) and those with threshold effects<br />
(causing acute, chronic or developmental effects). A distinction is therefore made<br />
in describing the dose-response variables for carcinogenic and non-carcinogenic<br />
chemicals. The above-mentioned toxicity datab<strong>as</strong>es and software packages are used<br />
to evaluate the dose-response relationships of the various chemical contaminants.<br />
The publications by the USEPA (1991, 1997) and Tchounwou et al., (1996) would also<br />
provide ready access to this information.<br />
Exposure Assessment<br />
The intensity, frequency and duration of human exposure to a chemical in potentially<br />
exposed populations is me<strong>as</strong>ured or estimated. Information and data on chemical<br />
residues in the fish and human consumption patterns are used to identify and describe<br />
potentially exposed populations. The risk-b<strong>as</strong>ed consumption limits calculated<br />
for the determined analytes in can be used for the consumption of South African<br />
freshwater fish if information on the input values and risk values is not available for<br />
South African situations.<br />
156
Risk Characterisation<br />
All the information concerning the hazard identification, dose-response <strong>as</strong>sessment,<br />
and exposure <strong>as</strong>sessment are used to characterise and describe the extent of the<br />
overall individual or population risk. The most significant quantitative and qualitative<br />
<strong>as</strong>pects of these <strong>as</strong>sessments, the <strong>as</strong>sumptions used and the identified uncertainties<br />
are <strong>as</strong>sessed, summarised and discussed to provide an overall estimate of individual<br />
risk. If information and data are available this can also be expanded to estimate<br />
overall population risk. Guidance on the risk characterisation process and examples<br />
of how to compile these documents can be found in the USEPA publications (USEPA<br />
1997; du Preez et al., 2003a). To perform these risk calculations for the chemical<br />
contaminants found in freshwater fish from South African systems and for different<br />
scenarios the Risk*AssistantTM software package can be used.<br />
DISCUSSION<br />
The method suggested in this paper h<strong>as</strong> been tested on rivers and impoundments<br />
in South Africa (Heath 1999, du Preez et al., 2003b) and the data indicate that there<br />
are potential metal and biocide health risks <strong>as</strong>sociated with the daily consumption of<br />
fish. The method h<strong>as</strong> been further developed and tested by the regulatory authority in<br />
South Africa and published <strong>as</strong> a series of reports by the Water Research Commission<br />
(Heath et al., 2004a,b).<br />
It is important to note that due to the differences in fish species, fish sizes and<br />
cultural beliefs freshwater fish are prepared and eaten in different manners in South<br />
Africa, ranging from filleting of larger fish to smaller fish being cooked whole. The<br />
consumers of these fish must be aware that certain tissues (such <strong>as</strong> liver, skin, testes<br />
and eggs) can have high levels of contamination, which could result in a human<br />
health risk (Heath et al., 2004b).<br />
The different levels of <strong>as</strong>sessment proposed in this method will also enable an<br />
accurate <strong>as</strong>sessment of diffuse pollution run-off from mines dumps, mine water<br />
decants (heavy metals) and agricultural run-off (mainly biocides). There is an<br />
international move, with the Stockholm Convention on Persistent Organic Pesticides<br />
(POP’s) <strong>as</strong> one of the driving forces, for aquatic biota to be monitored for levels<br />
of POP’s (DWAF, 2006). The protocol proposed in this paper will be ideal for such<br />
surveys. There is trend in America and Europe towards Total Maximum Daily Loads<br />
(TMDL), or the amount of pollution that a water body can receive and still meet water<br />
quality objective. The water quality objective includes the aquatic life requirements.<br />
The methodology developed can be used <strong>as</strong> a check to determine if the fish are in<br />
fact healthy and able to reproduce in a sustainable manner <strong>as</strong> well <strong>as</strong> to <strong>as</strong>certain if<br />
humans can in fact consume the fish without ill effects.<br />
The methodology should provide guidance to governmental authorities at national<br />
or provincial level and project managers for the collection of data and information<br />
<strong>as</strong> well <strong>as</strong> for the <strong>as</strong>sessment, management and communication of the health risks<br />
<strong>as</strong>sociated with the consumption of freshwater fish. The b<strong>as</strong>ic requirements are<br />
highlighted, <strong>as</strong> limited resources (financial, infr<strong>as</strong>tructure and skilled personnel)<br />
in South Africa would curtail the possibility of undertaking detailed <strong>as</strong>sessments<br />
<strong>as</strong> undertaken by the United States of America Environmental Protection Agency<br />
157
(USEPA). Nevertheless, by applying the proposed methodology, sound comparable<br />
<strong>as</strong>sessments, b<strong>as</strong>ed on risk <strong>as</strong>sessment methodology, can be made regarding the<br />
human health risk <strong>as</strong>sociated with the consumption of freshwater fish in South Africa.<br />
People responsible for these <strong>as</strong>sessments would also be able to compare their data<br />
and information with other studies in the world, especially that of the United States<br />
of America.<br />
These surveys will also identify are<strong>as</strong> in the aquatic system where aquatic life<br />
and especially fish have unacceptably high chemical contaminant levels due to<br />
anthropogenic activities in the catchment. This information can be used in catchment<br />
management programmes and thereby contribute to the general management of<br />
the catchments. Thus, by following and implementing the proposed methodology a<br />
major contribution would be made to the protection of the consumers of freshwater<br />
fish <strong>as</strong> well <strong>as</strong> the freshwater aquatic environment. This would in turn contribute to<br />
the ultimate goal of ensuring that the fish populations are fit for present and future<br />
human consumption.<br />
All the data and results that are generated are documented and organised in a way<br />
that will facilitate their review and <strong>as</strong>sessment. The risk <strong>as</strong>sessment project leader<br />
or designated person should design specific forms to ensure proper documentation.<br />
The long-term goal must be to reduce the impacts on the water-body to such a level<br />
that the contaminant levels in the fish pose no health risk to consumers (see Heath<br />
et al., 2004a,b for more details).<br />
The programme must be reviewed considering the objectives, activities and remedial<br />
actions that have been taken by other programmes, especially those related to<br />
catchment management and the River Health programmes of the Department of<br />
Water Affairs and Forestry. This review will enable the risk manager to adapt the<br />
programme <strong>as</strong> required thereby achieving the goals of reducing the health risk to<br />
the consumers of freshwater fish and contributing to the effective management of<br />
catchments.<br />
158
• Level 1: Screening<br />
surveys: national or<br />
regional surveys<br />
Sites where<br />
contaminant levels<br />
in fish could pose<br />
a health risks to<br />
consumers?<br />
SELECTION OF SCALE AND DEPTH OF SURVEY<br />
• What are the scope and level of investigation?<br />
• What are the main objectives of the investigation?<br />
• Level 2: Intensive<br />
surveys, Ph<strong>as</strong>e 1:<br />
surveys at potential<br />
risks sites <strong>as</strong> identified<br />
during Level 1 surveys.<br />
Magnitude of<br />
contamination in<br />
consumed fish<br />
species?<br />
• Level 3: Intensive<br />
surveys, Ph<strong>as</strong>e II:<br />
surveys at the sites<br />
investigated during<br />
Level 2 surveys.<br />
Size cl<strong>as</strong>s<br />
contamination level<br />
and geographical<br />
extent of<br />
contamination?<br />
ASSESSMENT OF THE WATER BODY CATCHMENT<br />
• What are the main features of the catchment?<br />
• What chemical contaminants are expected?<br />
• What fish are expected?<br />
• What are the socio-demographics of the catchment?<br />
• Geology, soil type,<br />
slopes<br />
• Freshwater system:<br />
rivers, dam, weirs,<br />
natural barriers,<br />
se<strong>as</strong>onal hydrology<br />
• Type of land use:<br />
agriculture, forestry,<br />
settlements, industries,<br />
mining<br />
• W<strong>as</strong>te dumps,<br />
industrial sites, w<strong>as</strong>te<br />
water treatment works<br />
effluent points<br />
Contaminants<br />
expected and site<br />
selection?<br />
•<br />
Sampling<br />
site<br />
selection<br />
• Fish population<br />
• Species used by<br />
recreational and<br />
subsistence fishermen<br />
• Se<strong>as</strong>onal availability<br />
• Size, age and gender<br />
Fish expected and<br />
utilized?<br />
MONITORING SYSTEM DESIGN<br />
• Where to Monitor?<br />
• What to Monitor?<br />
• When to Monitor?<br />
• Selection of analytes<br />
• Selection of analyte<br />
concentrations<br />
• Species selection<br />
• Tissue type and m<strong>as</strong>s<br />
selection<br />
• Number of samples<br />
• Socio-demographics<br />
of recreational and<br />
subsistence fishermen:<br />
gender, age, household<br />
numbers, etc<br />
• Fishing activities:<br />
number and species,<br />
frequency, etc<br />
• Preparation and<br />
consumption patterns:<br />
cooking methods,<br />
amounts consumed,<br />
etc.<br />
Exposure population<br />
and amount of fish<br />
consumed?<br />
• Sample<br />
time<br />
•<br />
Sampling<br />
frequency<br />
STEP 1<br />
STEP 2<br />
STEP 3<br />
Figure 1: Methodology for freshwater fish chemical contaminant surveys for<br />
<strong>as</strong>sessing the human health risks to consumers<br />
159
• Sampling<br />
equipment<br />
•Laboratory and<br />
instrumentation<br />
requirements<br />
•Sample storage<br />
requirements<br />
• Recording<br />
of results<br />
FIELD COLLECTION<br />
• How to Collect Samples?<br />
• Associated sample and data to collect?<br />
• How to pack and transport samples?<br />
• What documents are required?<br />
• Species identification<br />
and sorting<br />
• Size me<strong>as</strong>urements<br />
• Health observations<br />
• Sample<br />
package and<br />
preservation<br />
LABORATORY SAMPLE PROCESSING AND ANALYSIS<br />
• What is the condition of the samples?<br />
• How to remove and prepare tissue?<br />
• What analysis methods to follow?<br />
• What quality <strong>as</strong>surances are followed?<br />
• Sample inspection<br />
• Sample weighing<br />
• Size, age, gender<br />
determinations<br />
• Fish health observations<br />
• Scaling and<br />
skinning of<br />
fish<br />
• Preparation<br />
of individual<br />
and<br />
composite<br />
samples<br />
• Distribution<br />
of samples<br />
ANALYSIS AND REPORTING OF RESULTS<br />
• Statistical analysis of results<br />
• Data<br />
storage<br />
• Documentation<br />
• Selection<br />
of analytical<br />
laboratory<br />
• Selection<br />
of analytical<br />
methods<br />
• Quality<br />
<strong>as</strong>surance and<br />
quality control<br />
• Reporting of<br />
data<br />
STEP 4<br />
STEP 5<br />
STEP 6<br />
• Hazard<br />
identification<br />
• Evaluation<br />
risk<br />
<strong>as</strong>sessment<br />
data and<br />
information<br />
Figure 1 (continued)<br />
RISK ASSESSMENT<br />
• Dose-response <strong>as</strong>sessment<br />
• Assessment of risk<br />
management options<br />
RISK MANAGEMENT<br />
• Exposure<br />
<strong>as</strong>sessment<br />
• Assessment<br />
of positive<br />
and negative<br />
impacts<br />
RISK COMMUNICATION<br />
EVALUATION AND REVIEW OF PROGRAMME<br />
• Risk<br />
characterisation<br />
• Selection of<br />
most appropriate<br />
action and<br />
recommendations<br />
STEP 7<br />
STEP 8<br />
STEP 9<br />
STEP 10<br />
160
ACKNOWLEDGEMENTS<br />
Dr Steve Mitchell of the Water Research Commission (WRC) for supply funding to<br />
complete the reference and guideline manuals.<br />
REFERENCES<br />
Bevelhimer MS (1995). Recent advances in contaminant <strong>as</strong>sessment offer proactive<br />
alternatives for managing contaminated fisheries. Fisheries 20, 6–10.<br />
Bouwman H, Coetzee A and Schutte GHJ (1990). Environmental and health<br />
implications of DDT – contaminated fish from the Pongola Food Plain. Journal of<br />
African Zoology 104, 275–286.<br />
Förstner U and Wittmann G T W (1983). Metal Pollution in the Aquatic Environment,<br />
2nd edn. Springer Verslag, New York.<br />
Health Effects Summary Tables (1998). Health Effects Summary Tables. W<strong>as</strong>hington<br />
DC: Office of Emergency and Remedial Response. United States of America<br />
Environmental Protection Agency. www.epa.gov/iris/index.<br />
Heath RGM (1999). A catchment-b<strong>as</strong>ed <strong>as</strong>sessment of the metal and pesticide<br />
levels of fish from the Crocodile River, Mpumalanga. Johannesburg. Unpublished<br />
PhD Theses, Rand Afrikaans University.<br />
Heath RGM and Cl<strong>as</strong>sen MC (1999). An Overview of the Pesticide and Metal Levels<br />
Present in Populations of the Larger Indigenous Fish Species of Selected South<br />
African rivers. Report to the Water Research Commission, Report No. 428/1/99.<br />
Water Research Commission, Pretoria. 318 pp.<br />
Heath RGM, du Preez HH, Genthe B and Avenant-Oldewage A (2004a) Freshwater<br />
Fish and Human Health Overview Guide. .Water Research Commission Report No<br />
TT212/04. Pretoria, South Africa.<br />
Heath RGM, du Preez H, Genthe B and Avenant-Oldewage A (2004b) Freshwater Fish<br />
and Human Health Reference Guide. Water Research Commission Report Report No<br />
TT213/04. Pretoria, South Africa.<br />
DWAF (2006). National Toxicity Monitoring Programme (NTMP) for Surface Waters<br />
Ph<strong>as</strong>e 2: Prototype Implementation Manual (K Murray, RGM Heath, JL Slabbert, B<br />
Ha<strong>as</strong>broek, C Strydom and PM Matji eds). Report No.:0000/00/REQ/0505 Resource<br />
Quality Services, Department of Water Affairs and Forestry, Pretoria, South Africa.<br />
du Preez HH, Heath RGM and Sandham LA (2003a). Methodology for the <strong>as</strong>sessment<br />
of human health risks <strong>as</strong>sociated with the consumption of chemical contaminated<br />
freshwater fish in South Africa. Water SA 29, 69–90.<br />
du Preez HH, Genthe B, Groenewald M, Kotze PJ, Heath RGM and Sandham LA<br />
(2003b). An Initial Assessment of Possible Human Health Risks Associated with<br />
the Consumption of Fish from the Vaal River Barrage Reservoir and the Klip River,<br />
Gauteng province. Scientific Services report.Rand Water, Johannesburg.<br />
161
Reinert RE, Knuth BA, Kamrin MA and Sober QJ (1991). Risk <strong>as</strong>sessment, risk<br />
management and fish consumption advisories in the United States. Fish 16, 3–12.<br />
RISK * ASSISTANT TM (1995). Risk * Assistant TM. Hampshire Research Institute,<br />
Inc. Alexandria, VA.<br />
Tchounwou P B, Abdelghani A A, Pramary V, Heyer L and Steward C M (1996).<br />
Assessment of potential health risks <strong>as</strong>sociated with ingesting heavy metals in fish<br />
collected from a hazardous-w<strong>as</strong>te contaminated wetland in Louisiana, USA. Reviews<br />
on Environmental Health 11, 191–203.<br />
USEPA (1991). Guidelines for Developmental Toxicity Risk Assessment. Federal<br />
Register, 56: 63798-63826. USEPA, W<strong>as</strong>hington, D.C.<br />
USEPA (1995a). Guidance for Assessing Chemical Contaminant Data for use in Fish<br />
Advisories. Volume 1: Fish sampling and Analysis. 2nd Edn. EPA 823-R-95-007.<br />
USEPA, W<strong>as</strong>hington, D.C.<br />
USEPA (1995b). Guidance Guidance for Assessing Chemical Contaminant Data for<br />
use in Fish Advisories. Volume 4: Risk communication. EPA 823-R-95-001. USEPA,<br />
W<strong>as</strong>hington, D.C.<br />
USEPA (1996). Guidance for Assessing Chemical Contaminant Data for use in Fish<br />
Advisories. Volume 3: Overview of risk management. EPA 823-B-96-006. USEPA,<br />
W<strong>as</strong>hington, D.C.<br />
USEPA (1997). Guidance for Assessing Chemical Contaminant Data for use in Fish<br />
Advisories. Volume 2: Risk <strong>as</strong>sessment and fish consumption limits. 2nd Edn. EPA<br />
823-B-97-009. USEPA, W<strong>as</strong>hington, D.C.<br />
USEPA (1999). Update: National listing of fish and wildlife advisories. EPA 823-F-99-<br />
005. USEPA, W<strong>as</strong>hington, D.C.<br />
162
DELIVERING ENVIRONMENTAL BENEFITS THROUGH<br />
LAND MANAGEMENT CONTRACTS<br />
I Clayden<br />
SEERAD, Pentland House, 47 Robbs Loan, Edinburgh, EH14 1TY, UK, E-mail: Ingrid.<br />
Clayden@scotland.gsi.gov.uk<br />
SUMMARY<br />
From 2007 Land Management Contracts (LMCs) will be the main vehicle for<br />
delivering rural development support to rural land managers. This novel approach is<br />
designed to provide an integrated approach to rural development in order to achieve<br />
the Executive’s priority objectives <strong>as</strong> set out in the Rural Development Strategy for<br />
Scotland. The Strategy is structured around 3 proposed themes which address<br />
priorities and challenges facing rural Scotland. Some of these have already been<br />
identified elsewhere – for example the need to minimise diffuse pollution w<strong>as</strong><br />
highlighted in the Custodians of Change report. The Scottish Climate Change<br />
Programme (SCCP) is due to be published early in 2006 and the Water Framework<br />
Directive (WFD) will place pressure on the land use sector to meet water quality<br />
objectives.<br />
The three themes are:<br />
Theme 1 Underpinning performance and quality in the agriculture, food processing<br />
and forestry sectors.<br />
Theme 2 Enhancing rural landscapes and the natural heritage.<br />
Theme 3 Promoting a more diverse rural economy and thriving rural communities.<br />
The actions we propose under Theme 2 will contribute to achieving a range of<br />
environmental benefits, from halting biodiversity loss to implementing the WFD and<br />
contributing to UK commitments under the Kyoto climate change agreement and<br />
<strong>as</strong>sociated commitments under the SCCP.<br />
Current agri-environment schemes are designed to encourage beneficial management<br />
of a very wide range of habitats which, in turn provides benefits for wildlife, for water<br />
quality and for landscape.<br />
The LMC concept allows for environmental public goods to be incentivized at<br />
different levels.<br />
Tier 1 – the Single Farm Payment – is subject to cross-compliance requirements,<br />
which provide a b<strong>as</strong>ic environmental standard which all recipients must<br />
meet.<br />
Tier 2 – the LMC Menu Scheme – w<strong>as</strong> introduced in 2005 and includes a range<br />
of “light touch” agri-environment me<strong>as</strong>ures which are generally applicable<br />
across the countryside, do not require a high degree of expertise, and which<br />
all farmers and crofters can access.<br />
163
Tier 3 – Tier 3 of LMCs is planned to come on stream in 2007, following consultation in<br />
March 2006 on the priorities for funding in a new Scottish Rural Development<br />
Programme for the period 2007-2013. The specific me<strong>as</strong>ures to be funded<br />
will be those which contribute to the Executive’s priorities for enhancing<br />
rural landscapes and the natural heritage.<br />
164
CARROTS, STICKS, SERMONS OR HUGS? DESIGNING<br />
CO-ORDINATED POLICY MEASURES FOR THE UPTAKE<br />
OF ENVIRONMENTAL MANAGEMENT OPTIONS<br />
B Davies<br />
The Macaulay Institute, Craigiebuckler, Aberdeen AB15 8QH, UK, E-mail: b.davies@<br />
macaulay.ac.uk<br />
SUMMARY<br />
Environmental policy instruments that encourage the uptake of environmental<br />
management me<strong>as</strong>ures have traditionally been focused at the level of the individual<br />
farm, and have aimed to re-direct the principal farm decision-maker towards adoption<br />
of alternative management options using a combination of voluntary and mandatory<br />
me<strong>as</strong>ures. These have combined incentives, regulations and advice delivered<br />
through a variety of channels – or in Kenneth Boulding’s terminology: ‘carrots, sticks<br />
and hugs’. There is now widespread recognition that emph<strong>as</strong>is on policy designed<br />
for the single farm is not a sufficient condition for achieving desired environmental<br />
quality targets, in particular where scale and spatial co-ordination are significant<br />
factors in effective uptake. Drawing on research on environmental collective action<br />
in Scotland, we draw out some issues with a more collective approach to policy<br />
design, and identify some key research challenges that need to be met to make<br />
these approaches more viable in the future.<br />
INTRODUCTION<br />
The range of policy options available to government for rural land management spans<br />
a wide range in theory, but the options available to specific agencies in practice<br />
are much narrower, constrained most clearly by both pragmatic considerations<br />
(most obviously financial and personnel resources) and regulatory jurisdiction. The<br />
underlying options in providing agri-environmental delivery are essentially fourfold:<br />
• Changing how things are produced to ensure environmental goods and services<br />
are part of the process (e.g. Best Management Practices).<br />
• Changing where things are produced, to reduce pressure on sensitive are<strong>as</strong>.<br />
• Changing what is produced, to provide a better mix of goods and services, at a<br />
range of scales.<br />
• Changing who produces things, to enable specialization in are<strong>as</strong> of management<br />
expertise.<br />
Government and its responsible agencies have a range of policy instruments which<br />
can be deployed to bring about these changes, and these can be referenced to<br />
Kenneth Boulding’s (1989) analysis of power relations. The available ways of bringing<br />
about change can be broadly pursued through three strategies – the power of<br />
coercion (the stick), the power of exchange (the carrot) and the power of integration<br />
(the hug in Boulding’s own terminology – or the sermon to emph<strong>as</strong>ise its persu<strong>as</strong>ive<br />
rather than supportive element). These are more often described <strong>as</strong> economic<br />
instruments, regulation (or Command and Control) and moral su<strong>as</strong>ion in the cl<strong>as</strong>sic<br />
165
policy literature, although this is clearly a more narrow definition than that developed<br />
by Boulding. A summary list of the range of instruments available, broadly delineated<br />
by these categories, is shown in Table 1.<br />
It is important to note that though these elements are often separated, even quite<br />
specific instruments seldom exercise exclusively one kind of power (Frey, 1997). Thus<br />
pricing mechanisms for conservation goods not only offer the power of exchange, but<br />
send clear signals about the value from the public perspective of the goods that are<br />
being offered for exchange. Information provision can help to identify cost savings<br />
or profit opportunities that in turn bring their own rewards. Regulatory instruments<br />
backed up with the threat of prosecution also send a signal about what is ethically<br />
valued, <strong>as</strong> do market-b<strong>as</strong>ed instruments aimed at delivering similar quality targets<br />
but through more flexible mechanisms (Winter and May, 2001). Single instruments<br />
are not therefore typically limited to the exercise of only one kind of power, even<br />
though this is a convenient way of characterizing them.<br />
As Boulding notes, the hug is by far the most prevalent form of exercise of power, <strong>as</strong><br />
it strikes to the heart of human relationships and is inherent in all efforts to engage<br />
humans in some form of activity. In Boulding’s terminology, the hug is founded on<br />
‘love’, though reservations about the impact of such romantic language on political<br />
sensibilities have led to its more common characterization (suggested by Boulding<br />
himself) <strong>as</strong> ‘respect’. Thus although the power of exchange can be observed<br />
in recruiting farmers into various forms of agri-environmental schemes through<br />
payments, the success of these initiatives is still heavily reliant on mutual respect<br />
(essentially good will and honesty) on the part of participants, particularly when<br />
monitoring efforts are by necessity limited (Colman, 1994; Lowe et al., 1997).<br />
TWO HOLY GRAILS OF AGRI-ENVIRONMENTAL POLICY<br />
Many of the me<strong>as</strong>ures listed in Table 1 have been, and continue to be, employed<br />
with varying degrees of support and success. There is substantial experience of<br />
successful (in enrollment terms) initiatives and schemes, both broad and deep, led<br />
by agency project officers, extension staff, NGOs and government departments<br />
themselves (e.g. CRER, 2002).<br />
However, two key objectives for rural land management have been fairly consistently<br />
elusive – integrated delivery mechanisms and co-ordinated uptake. Co-ordination is<br />
used here to refer to the appropriate scale of uptake, whether defined in relation to<br />
land area or numbers of participating farmers. Integrated delivery refers to multiple<br />
objectives that the state and its agencies hold in relation to the management of<br />
rural land, while acknowledging that land managers themselves are simultaneously<br />
involved in delivering multiple objectives for themselves and their families. These<br />
two key priorities add an additional complexity to policy delivery, but one where the<br />
challenges are significantly different to the p<strong>as</strong>t round of agri-environmental scheme<br />
development:<br />
(1) A level of co-ordination in actions that brings synergy across multiple holdings.<br />
(2) A level of co-ordination in objectives that brings synergy in multiple outputs.<br />
At a strategic level, the problem is not the number and range of possible individual<br />
instruments, but the inability to co-ordinate these sufficiently at a comprehensive<br />
166
enough scale and for a wide enough scope of objectives. The challenges here are<br />
numerous, including budgetary restrictions, jurisdictional boundaries, changing<br />
agency remits, competing stakeholder interests and pressures of new European<br />
legislation.<br />
In this context, the introduction of Land Management Contracts (LMCs) offers a<br />
significant opportunity for far greater integration of objectives in delivery. However, the<br />
other challenge – co-ordination – h<strong>as</strong> remained relatively underdeveloped in both UK<br />
research and policy terms. Undoubtedly this reflects the underlying land ownership<br />
structure where examples of collective land management are now largely confined to<br />
the management of common grazings. However, the emph<strong>as</strong>is on collective action is<br />
gaining prominence and reflects a new frontier for environmental working.<br />
COLLECTIVE INITIATIVES – PULLING MULTIPLE LEVERS<br />
Engagement in collaborative activities can be defined along a spectrum from Individual<br />
to Collective (Figure 1). At the individualistic end of the spectrum, farm actions are<br />
focused within a single farm boundary and without reference to wider objectives. At<br />
the other, collective, end of the spectrum lies full community land ownership, under<br />
which the entire decision-making process involves collective action. Collaborative or<br />
collective activities involving multiple land managers occur along this spectrum, and<br />
their advantages in delivering on both agri-environmental and rural policy objectives<br />
have received some – though quite limited – attention in p<strong>as</strong>t research (e.g. Slangen<br />
1994; Hagedorn, 2002; Franks, 2003).<br />
From the individual land manager’s perspective, there are some clear advantages<br />
to both modes of operation (Table 2). Although the benefits of co-operation are<br />
e<strong>as</strong>ily listed, the benefits of individual operation are far more familiar to most land<br />
managers. Currently, it is apparent that incentives to move towards more collective<br />
forms of action for environmental outcomes are notably weak (Davies et al., 2004).<br />
Various types of zoning regulation are the clearest examples aimed at delivering a<br />
broad degree of spatial co-ordination, with specific catchment and habitat initiatives<br />
targeting specific objectives more closely.<br />
A principal advantage of collective action lies in its ability to address multiple<br />
objectives simultaneously, and to harness Boulding’s power of the ‘hug’ alongside<br />
more structured policy instruments. It can create a group which h<strong>as</strong> the capacity<br />
to challenge traditional practice, and in which practices can be redefined, while<br />
simultaneously delivering – with the right supporting structures – direct benefits to<br />
participants either in efficiency savings or opening up new sources of revenue (either<br />
directly or indirectly) (Hagedorn, 2002). Four key elements of collective action can be<br />
characterised <strong>as</strong> co-learning, co-planning, co-acting and co-funding. Some activities<br />
may be limited to only one of these, but the more intangible elements – co-planning<br />
and co-learning – offer the greatest potential to secure attitudinal change over time.<br />
167
Figure 1: Individual-collective spectrum in farm management<br />
However, the impetus required to move land managers to a more collaborative<br />
approach in environmental management is very substantial. Collaboration is costly<br />
in terms of time, is potentially risky, may take time to develop, can have uncertain<br />
objectives and threaten to constrain flexibility (Franks, 2003). Faced with this<br />
prospect, the rewards from collaboration need to be clear, significant and timely.<br />
Commercial co-operative ventures struggle with all these factors and their limited<br />
penetration in UK agriculture h<strong>as</strong> long been evidence of the difficulty of turning<br />
theoretical advantages into reality.<br />
Table 2:<br />
Benefits to land managers of Individual and Collective management<br />
approaches<br />
Individual benefits<br />
Speed of decision making<br />
Flexibility in management<br />
Personal pride in outcomes<br />
Simplicity in control<br />
Clear lines of responsibility<br />
Direct capture of benefits<br />
Enjoyment of autonomy<br />
Collective benefits<br />
Access to wider expertise<br />
More powerful resource b<strong>as</strong>e<br />
Supportive learning environment<br />
Sharing of burdens<br />
Potential capacity to specialize<br />
Realise economies of scale and scope<br />
Stronger voice in negotiation<br />
The driving forces for collaboration in the p<strong>as</strong>t have been essentially twofold – problem<br />
solving and income generation (see Davies et al., 2004) – and these principal motives<br />
are unlikely to change quickly. But securing benefits in response to either of these<br />
two motives is not inevitable even when the potential benefits of collaboration are<br />
clear. In the p<strong>as</strong>t, environmental collective initiatives have almost universally relied<br />
heavily on the driving force of project officers with time, expertise and access to<br />
funding to generate activity. The characteristics evident in generating enduring and<br />
productive collaborative action are complex and varied:<br />
• Critical m<strong>as</strong>s to realize collective benefits at appropriate scale.<br />
• Clarity of purpose.<br />
• Rapid and self-evident initial results.<br />
• Outcomes exceed those available through individual effort alone.<br />
168
• Individual rewards accrue from collective organisation.<br />
• There are opportunities for continuing innovation and development.<br />
• Individuals feel in control of the process.<br />
• Sense of common goals and ownership.<br />
• Appropriate and available training.<br />
• Some secure funding streams to sustain co-operative engagement.<br />
• Voluntary participation due to shared opportunities for gain.<br />
• Strong and inspirational leadership.<br />
• Flexibility in response to new opportunities.<br />
• Continuing positive feedback and information flow to participants.<br />
The extent of collective actions h<strong>as</strong> scale and scope limitations, and not all will meet<br />
all these conditions. If collective approaches are to yield more of their potential,<br />
significant innovation is needed in mechanisms to deliver on the problems raised<br />
by these factors; without such innovation, the potential for moving towards more<br />
collaborative environmental initiatives is likely to remain very weak.<br />
CHALLENGES FOR INNOVATION IN SUPPORTING MORE<br />
COLLABORATIVE ACTION<br />
It should be noted that not everything worth doing is worth doing collaboratively.<br />
What is important is to provide mechanisms to move to the appropriate point on<br />
the Individual–Collective spectrum – appropriately defined in relation to the needs of<br />
both farmers and agencies, and the circumstances within which they are operating.<br />
Collective approaches need therefore to be constructed from, and responsive to,<br />
complex combinations of incentives, regulation and social pressures that can effect<br />
these transitions. At present there are many good examples of p<strong>as</strong>t collaborative<br />
initiatives built on project officers’ expertise (Wondolleck and Yaffee, 2000); but to<br />
build on this experience in the UK context, developments are needed in several key<br />
fields:<br />
(1) In monitoring systems that can enable greater clarity in benefits delivery:<br />
• audit systems that send more precise and appropriate signals to managers;<br />
and<br />
• strengthening returns to individual efforts within collective ventures.<br />
(2) In understanding the full benefits of co-ordinated environmental actions:<br />
• provision of evidence on scale and scope benefits from co-implementation;<br />
and<br />
• recognition of the widest possible set of values delivered at the landscape<br />
scale.<br />
(3) In leveraging additional rewards from other sources to reward multi-farm,<br />
multi-objective initiatives:<br />
• circumventing the audit controls constraining government expenditure; and<br />
169
• tailoring activities to local circumstances and opportunities.<br />
(4) In mechanisms that enable farmers to tap into location-specific environmental<br />
expertise:<br />
• stimulating farmer engagement in defining, rather than just delivering, on local<br />
priorities; and<br />
• monitor and demonstration style farms, connected to environmental support<br />
groups.<br />
(5) In creating farm-level incentives to incre<strong>as</strong>e recruitment to collective<br />
initiatives:<br />
• by incre<strong>as</strong>ing co-operative rewards linked to larger scale initiatives.<br />
(6) In using collective initiatives <strong>as</strong> gateways to other desired services:<br />
• specialist training and software (e.g. in nutrient budgeting) via group<br />
membership; and<br />
• compulsory elements of training in combination with farmer-defined<br />
priorities.<br />
CONCLUDING COMMENT<br />
Land Management Contracts should provide for a level of integration in agrienvironmental<br />
policy delivery exceeding p<strong>as</strong>t approaches; however, delivering<br />
co-ordination across holdings remains exceptionally challenging under prevailing<br />
institutional structures. In seeking to re-orientate land managers to greater<br />
prioritization of environmental outcomes, Boulding’s observation on the power of the<br />
hug in particular may be particularly timely. To quote Senator Robert Byrd (speaking<br />
in 2003 on a very different topic, the inv<strong>as</strong>ion of Iraq):<br />
‘the real power of America lies not in its will to intimidate, but in its ability to inspire’.<br />
The step from coercion to inspiration is the necessary internalization of values that<br />
creates a community of shared interest from a disparate collection of individuals,<br />
a point observed two millennia ago by Aristotle (2000). Many, if not most farmers<br />
continue to fail to be inspired by the opportunities offered by environmental land<br />
management <strong>as</strong> a core activity, not only because it is a significant change of focus,<br />
but because it fails to offer dynamic opportunities for continuing positive innovation,<br />
rewards structured to monitorable outputs, flexibility in delivery and accessible<br />
benchmarks for these processes. Group structures are not a panacea for addressing<br />
these concerns, but they do offer a channel through which innovative responses to<br />
these challenges might be more effectively nurtured.<br />
170
Table 1:<br />
A typology of agri-environmental policy instruments<br />
Emph<strong>as</strong>is on use in UK*<br />
Economic<br />
Transferable property resource rights –<br />
Land covenants and trusts +<br />
Negotiated conservation management agreements +++<br />
Competitive public goods contracts +++<br />
Posted performance bonds –<br />
Crop insurance services +<br />
Hypothecated tax instruments –<br />
Tax relief and exemptions +<br />
Input substitution subsidies –<br />
Equipment upgrade grants +<br />
Output tariffs –<br />
Graduated user fees and charges –<br />
Regulatory<br />
Offset arrangements/planning concessions –<br />
Le<strong>as</strong>ing and licensing schemes +<br />
Producer accreditation schemes ++<br />
Zoning and development controls ++<br />
Statutory procedural regulations +++<br />
Output/input controls and quot<strong>as</strong> ++<br />
Persu<strong>as</strong>ive<br />
Electronic and print media information services ++<br />
Advisory and extension services ++<br />
Process and product research and development +<br />
Education and training entitlements –<br />
Prizes and award Schemes +<br />
Voluntary audits and monitoring ++<br />
Monitor and demonstration farms +<br />
Producer clubs –<br />
Discussion forums +<br />
‘Naming and shaming’ initiatives –<br />
Green benchmarking +<br />
Mixed<br />
Product certification schemes/green marketing ++<br />
Industry sponsored producer clubs +<br />
Cross compliance conditions +++<br />
Local food initiatives +<br />
Regional development/diversification initiatives +<br />
Environmental clubs and cooperatives -<br />
*, very little or not used; +, low emph<strong>as</strong>is; ++, medium emph<strong>as</strong>is; +++, high<br />
emph<strong>as</strong>is.<br />
171
ACKNOWLEDGEMENTS<br />
The support of the Scottish Executive Environment and Rural Affairs Department<br />
is gratefully acknowledged for the research leading to this paper. The views<br />
expressed here are entirely those of the author and not attributable in any way to the<br />
Department.<br />
REFERENCES<br />
Aristotle (2000). The Nicomachean Ethics. trans. Irwin T (Second Edition). Hackett<br />
Publishing Company, Indianapolis, NI.<br />
Boulding K (1989). Three Faces of Power. Sage Publications, Newbury Park, CA.<br />
Colman D (1994). Ethics and externalities: agricultural stewardship and other<br />
behaviour: presidential address’. Journal of Agricultural Economics 45, 299–311.<br />
CRER (2002). Economic Evaluation of Agri-Environmental Schemes. Final Report to<br />
the Department of Environment, Food and Rural Affairs. Centre for Rural Economics<br />
Research (CRER), Department of Land Economy, University of Cambridge and CJC<br />
Consulting, Oxford.<br />
Davies BB, Blackstock K, Brown KM and Shannon P (2004). Challenges in creating<br />
local agri-environmental cooperation action between farmers and other stakeholders.<br />
In: SEERAD Final Report FF 11/03, The Macaulay Institute, Aberdeen.<br />
Frey BS (1997). Not Just for the Money. Edward Elgar, Cheltenham.<br />
Franks J (2003). Revised agri-environment policy objectives: implications for scheme<br />
design. Journal of Environmental Planning and Management 46, 443–466.<br />
Hagedorn K (2002). Environmental Cooperation and Institutional Change: Theories<br />
and Policies for European Agriculture. Edward Elgar, Cheltenham<br />
Lowe P, Clark J, Seymour S and Ward N (1997). Moralizing the Environment. UCL<br />
Press, London.<br />
Slangen LHG (1994). The economic <strong>as</strong>pects of environmental cooperatives for<br />
farmers. International Journal of Social Economics 21, 42–59.<br />
Winter SC and May PJ (2001). Motivation for compliance with environmental<br />
regulations. Journal of Policy Analysis and Management 20, 675–698.<br />
Wondolleck JM and Yaffee S (2000). Making Collaboration Work: Lessons from<br />
Innovation in Natural Resource Management. Island Press, W<strong>as</strong>hington DC.<br />
172
AGRICULTURE POLICY REFORM: OPPORTUNITIES TO<br />
REDUCE DIFFUSE POLLUTION<br />
C Davies, M Gloyer and A Johnstonova<br />
RSPB Scotland, Dunedin House, 25 Ravelston Terrace, Edinburgh EH4 3TP, UK,<br />
E-mail: mandy.gloyer@rspb.org.uk<br />
SUMMARY<br />
Many of Scotland’s rivers, lochs, co<strong>as</strong>tal and groundwaters are affected by diffuse<br />
pollution from agricultural sources. SEPA considers this to be the most significant<br />
cause of poor river quality, and expects it to be the largest cause of water pollution in<br />
Scotland by 2010. Water bodies affected by diffuse pollution from silts and excess<br />
nutrients become eutrophic with dev<strong>as</strong>tating consequences for wildlife. Many<br />
water-dependant species and habitats are of national and international importance.<br />
Existing policy me<strong>as</strong>ures which aim to tackle the problem are inadequate but<br />
comprehensive changes in agriculture and water policy are underway in Europe and<br />
Scotland. The Water Framework Directive is changing the way we manage our water<br />
environment, while reform of the Common Agriculture Policy gives greater emph<strong>as</strong>is<br />
to environmental objectives. Opportunities exist to align water and agricultural policy<br />
through these mechanisms, reducing diffuse pollution while enhancing biodiversity<br />
and delivering other public goods.<br />
INTRODUCTION<br />
Scotland is renowned for, and in many ways defined by, its water. A plentiful supply<br />
shapes its characteristic landscapes, enables production of world cl<strong>as</strong>s goods, and<br />
supports highly popular recreational activities – all of which are vital to the Scottish<br />
economy. Many of our most valuable wildlife habitats are water dependant and<br />
often of national and international significance. Rivers and lochs, co<strong>as</strong>tal saltmarshes<br />
and lowland gr<strong>as</strong>slands, reedbeds and v<strong>as</strong>t tracts of upland blanket bogs<br />
support a diverse array of Scottish biodiversity including aquatic species such <strong>as</strong><br />
Atlantic salmon and freshwater pearl mussel, and huge numbers of wading birds<br />
and wildfowl.<br />
There are many threats to the aquatic environment, but there is little doubt that diffuse<br />
pollution from agricultural sources, primarily excess nutrients, pesticides and silt, is<br />
causing major problems for both water quality and the vulnerable water habitats<br />
and species which depend on it. Diffuse pollution is a priority water policy issue<br />
for the UK Government, with the main driver for current action being the EU Water<br />
Framework Directive which requires a co-ordinated approach to protect and restore<br />
aquatic ecology – both water quality and quantity – at the river b<strong>as</strong>in scale.<br />
A range of practical me<strong>as</strong>ures can be used to reduce the cause of the problems<br />
derived from farmland. Various policy mechanisms are currently employed to<br />
address the issue: advice, awareness programmes, incentives and regulation in<br />
some are<strong>as</strong>. However, these appear to be having limited effect. SEPA considers<br />
that the problem is growing and that pollution from agricultural sources is likely to<br />
be the largest cause of water pollution in Scotland by 2010. The issue is politically<br />
and practically complex and there is currently no overall solution to the problem of<br />
diffuse pollution.<br />
173
THE EFFECT OF DIFFUSE POLLUTION FROM AGRICULTURAL SOURCES<br />
ON BIODIVERSITY<br />
Diffuse pollution arises from the cumulative effect of many small discharges. The<br />
total effect of a number of individually minor sources of contamination becomes<br />
incre<strong>as</strong>ingly significant over an entire catchment area and causes considerable<br />
harm to the environment. In particular, nitrogen (N) from inorganic fertilisers, slurries<br />
and manure is transported in surface and groundwater in the form of highly soluble<br />
nitrate. Nitrate is a major polluter of many saline and freshwater systems, where<br />
it incre<strong>as</strong>es the growth of certain aquatic plants and algae at the expense of less<br />
competitive species.<br />
Phosphorus (P) from inorganic fertilisers, slurries and manure is a major plant nutrient<br />
and generally the limiting factor for eutrophication in freshwater systems. While<br />
nitrate is highly soluble and generally transported by leaching, phosphorus binds<br />
strongly to soil particles, and is often <strong>as</strong>sociated with pollution by soil erosion or<br />
run-off. However, <strong>as</strong> soils become saturated with phosphorus, more P becomes<br />
dissolved in water and reaches watercourses in a soluble form.<br />
Silts are particles of soil that are w<strong>as</strong>hed into rivers and lochs from the surrounding<br />
land. Poor soil management combined with heavy rainfall greatly incre<strong>as</strong>es the natural<br />
level of erosion, changing the structure of river habitats by clogging up substrates and<br />
making them unsuitable for some fish and insect species. Silts can also make water<br />
turbid and prevent submerged plants from growing. Declines in mayfly populations<br />
are considered to be the result of a combination of silt and nutrient pollution, while<br />
silt deposition in rivers h<strong>as</strong> serious impacts on salmonid fish which lay eggs in gravel.<br />
Excessive silt reduces oxygen flow to the eggs and provides a physical barrier to<br />
the hatching fry, resulting in serious reductions in breeding success. Other species<br />
vulnerable to silt pollution include freshwater pearl mussel and native white-clawed<br />
crayfish.<br />
Pesticides can be toxic to aquatic life, and have potentially serious consequences<br />
for wildlife, including fish. These can include plant, insect or fish kills, hormonal<br />
disruptions, impacts on food chains <strong>as</strong> a result of changes or reductions in numbers<br />
of plants, or invertebrates providing food to mammals and birds. Assessing impacts<br />
of individual pesticides on the ecology of water environment is very difficult, but there<br />
is sufficient evidence to suggest that action is needed to provide better control of<br />
pesticide input into water.<br />
Modern farming practices have tended to incre<strong>as</strong>e the risk of nutrient and silt loss.<br />
Ploughing, seedbed preparation, crop spraying, fertiliser spreading and application of<br />
slurry to land can all contribute to diffuse pollution. SEERAD (2005) stated that since<br />
the 1950s the amount of inorganic nitrogen applied to agricultural land h<strong>as</strong> incre<strong>as</strong>ed<br />
sevenfold (+600%), and phosphorus application h<strong>as</strong> almost doubled (+70%). SEPA<br />
estimates that some 45,000 tonnes of nitrate and 2,800 tonnes of phosphate are<br />
lost from agriculture to surface waters and groundwater every year. Soil losses from<br />
agricultural activities are estimated at 780,000 tonnes a year (SEERAD, 2005).<br />
The relatively low cost and ready availability of inorganic fertilisers, together with the<br />
geographical separation of crop and livestock production systems, h<strong>as</strong> limited the<br />
re-cycling of N and P from manures and slurries <strong>as</strong> fertilisers. The cost of storing<br />
174
and transporting manures and slurries h<strong>as</strong> also reduced the likelihood of these<br />
being spread on the farm at times and in places where crop uptake will reduce the<br />
risk of nutrient loss. Where an excess nutrient is available, and not taken up by<br />
a crop, it inevitably reaches surrounding watercourses. Current estimates (Defra,<br />
2003) suggest that 40%–50% of P and 60%–70% of N in waters are derived from<br />
agricultural activity, specifically the application of fertilisers and manure. While<br />
some nutrient loss is the inevitable result of tilling the soil and keeping livestock, a<br />
substantial proportion could be avoided by better soil husbandry, improved on-farm<br />
nutrient management and more efficient use of existing sources of N and P to reduce<br />
reliance on inorganic fertilisers.<br />
The loss of hundreds of kilometres of riverine systems and <strong>as</strong>sociated wetlands over<br />
recent decades exacerbates the problem. Naturally functioning wetland systems<br />
can soak up pollutants and clean water in the process, <strong>as</strong> well <strong>as</strong> acting <strong>as</strong> natural<br />
sponges capable of absorbing floodwater. However, development on floodplains,<br />
extensive land drainage and the construction of embankments along rivers to protect<br />
agricultural land from flooding all limit the capacity of natural habitats to cope with<br />
flood events and pollution.<br />
There can be little doubt that diffuse pollution is widespread and having a major<br />
detrimental impact on the health of our water environment. SEPA (2005) identified for<br />
the Scotland River B<strong>as</strong>in District (RBD) a total of 488 rivers, 57 lochs, 18 transitional,<br />
59 co<strong>as</strong>tal and 21 groundwater bodies currently affected by diffuse source pollution<br />
caused mainly by agricultural activities. A further 198 rivers, 13 lakes, 3 transitional,<br />
2 co<strong>as</strong>tal and 16 groundwater bodies are affected by or at risk from diffuse pollution<br />
pressures in the Solway Tweed RBD (SEPA and Environment Agency, 2005).<br />
Many of these are of international importance for wildlife. The Scotland RBD includes<br />
235 water-dependant Special Are<strong>as</strong> of Conservation (SAC) and Special Protection<br />
Are<strong>as</strong> (SPA). The Solway Tweed RBD includes 36 water-dependant SACs and SPAs.<br />
Of these, many may not meet the Water Framework Directives (WFD’s) environmental<br />
objectives in their current state. The intense pressure of diffuse pollution on some<br />
of our most important aquatic habitats and species mean that these sites may<br />
fail to meet the statutory favourable condition required by EU Habitats and Birds<br />
Directives.<br />
SPAs affected by or at risk from diffuse pollution include the Caithness Lochs, Loch<br />
of Strathbeg, the Ythan Estuary, Insh Marshes, Loch of Skene, Loch Lomond, Loch<br />
Ken and Dee Marshes, Loch of Kinnordy, Flanders Moss and Lake of Menteith, and<br />
Loch Leven. SACs affected by or at risk from diffuse pollution include the Dunkeld–<br />
Blairgowrie Lochs, and the Rivers Spey, Tay, Dee, South Esk and Tweed.<br />
The UK Biodiversity Action Plan (BAP) includes a number of priority habitats and<br />
species which depend on good quality water. Priority habitats include mesotrophic<br />
lakes, rivers, fens, reedbeds and grazing marsh. Priority species include the otter,<br />
water vole, medicinal leech, northern blue damselfly, great crested newt, freshwater<br />
pearl mussel, vendace, yellow marsh saxifrage, slender naiad, river jelly lichen, marsh<br />
clubmoss and Shetland pondweed. Action Plans for each of these habitats and<br />
species highlight the threat from nutrient enrichment. Many of these are of principle<br />
conservation importance in Scotland; the new Nature Conservation Act (Scotland)<br />
175
equires the Minister to designate a list of such species and habitats in order to<br />
further their conservation.<br />
In addition to the environmental cost, damage to aquatic ecosystems reduces<br />
the value of water bodies for amenity, recreation and drinking water supply with<br />
significant health and economic implications. The total costs of agricultural pollution<br />
in the UK have been estimated to be in the order of £250 million pounds per year,<br />
with significant clean-up costs borne by the taxpayer.<br />
NEW OPPORTUNITIES IN WATER AND AGRICULTURE POLICY<br />
Best Management Practices for reducing the problem of diffuse pollution are well<br />
documented (e.g. Vinten et al., 2005). However, policy mechanisms have so far failed<br />
to ensure widespread adoption of the me<strong>as</strong>ures needed. The implementation of<br />
the WFD through the Water Environment and Water Services (Scotland) Act 2003<br />
offers the opportunity for effective policy change, particularly if carefully aligned<br />
with Common Agriculture Policy (CAP) reform me<strong>as</strong>ures and the Scottish Rural<br />
Development Plan. The delivery of CAP Pillar 2 funding through the proposed new<br />
system of Land Management Contracts (LMCs) must be a key element of any strategy<br />
to address diffuse pollution from agricultural sources.<br />
DIFFUSE POLLUTION STRATEGY<br />
A Diffuse Pollution Strategy for Scotland should be developed, with a key role for<br />
SEPA, in order to ensure the level of policy integration and implementation necessary<br />
on a widespread and highly targeted b<strong>as</strong>is. Priority catchments need to be identified<br />
and targeted, with other me<strong>as</strong>ures being applied more generally for maximum effect.<br />
Promotion of organic farming techniques would help reduce the reliance on, and<br />
impacts of, inorganic fertilisers. A combination of incentives, advice and regulation<br />
designed to support, engage and ultimately deter farmers and landowners from<br />
carrying out damaging farming practices is required, including the following key<br />
elements.<br />
Regulation<br />
The new regulatory system required by the WFD should provide the necessary<br />
legislative b<strong>as</strong>is for change; proposals by the Scottish Executive to introduce<br />
national and targeted General Binding Rules (GBRs) have the potential to ensure the<br />
application of good practice and should be properly integrated with the new LMC<br />
system of agricultural incentives.<br />
Incentives<br />
Agricultural incentives offered through the proposed new LMCs should promote<br />
good practice nationally, but particularly in priority catchments. There is considerable<br />
scope for addressing diffuse pollution through LMC Tiers 1, 2 and 3. Me<strong>as</strong>ures that<br />
are designed to meet multiple objectives including biodiversity, sustainable flood<br />
management and improvements to public water supplies provide the best value for<br />
funding:<br />
• Widespread gains could be made in Tier 1 by introducing a requirement to prepare<br />
and implement a compulsory Nutrient/Soil Management Whole Farm Plan <strong>as</strong> part<br />
176
of Good Agricultural and Environmental Condition (GAEC) in order to receive the<br />
Single Farm Payment.<br />
• Tier 2 provides non-competitive incentives to land managers and should promote<br />
me<strong>as</strong>ures that deliver multiple benefits, such <strong>as</strong> the widespread use of buffer<br />
strips at riparian field margins, management of farm wetlands, provision of farm<br />
ponds, conversion from winter to spring sown cereals, provision of vegetative<br />
over-winter cover and strip cropping. Fencing off watercourses and provision of<br />
alternative drinking points for livestock are me<strong>as</strong>ures also suited to Tier 2 though<br />
capital costs may necessitate their inclusion in Tier 3.<br />
• Tier 3 aims to enhance the environment and should provide significant competitive<br />
incentives for priority are<strong>as</strong> (identified from SEPA’s ‘characterisation’ process)<br />
linked to targeted GBRs. There is great scope for major environmental gains by<br />
encouraging partnership working at the catchment scale. Enhanced buffer strips<br />
and provision of adequate manure storage facilities should be encouraged. The<br />
restoration of naturally functioning wetland are<strong>as</strong> including riverine and co<strong>as</strong>tal<br />
floodplains is of particular importance. Wetlands deliver the multiple benefits<br />
sought in policy development and should be a major element of any strategy to<br />
combat the cause and effects of diffuse pollution.<br />
Advice<br />
The existing farm advisory service is under review and a new scheme needs to be<br />
introduced <strong>as</strong> a requirement of the Farm Advisory Service provisions of the CAP<br />
mid-term review. This should be considered in the context of the 3 LMC tiers with<br />
widespread e<strong>as</strong>y access to free advice on nutrient and soil management planning<br />
and the provision of public benefits. Catchment advisors should be appointed in<br />
priority are<strong>as</strong>.<br />
Planning<br />
The development of River B<strong>as</strong>in Management Plans (RBMP) and the establishment<br />
of Area Advisory Groups in spring 2006 will provide a major opportunity to address<br />
diffuse pollution in priority catchments. Programmes of Me<strong>as</strong>ures developed to<br />
implement the RBMPs should promote and encourage a package of me<strong>as</strong>ures to<br />
reduce diffuse pollution, including direct regulation, the restoration of wetlands,<br />
sustainable flood management, and changes in land use where necessary to achieve<br />
the ecological objectives of the WFD.<br />
CONCLUSION<br />
The current shift in emph<strong>as</strong>is of agricultural and water policy means that significant<br />
ecological improvements in the water environment at a catchment scale are<br />
possible, and required. This is an unprecedented opportunity to address the issue<br />
of diffuse pollution from agricultural sources which is currently causing such great<br />
environmental damage at significant cost. Policy integration is the key to effective<br />
implementation – agriculture policy reform must be fully integrated with me<strong>as</strong>ures<br />
to implement the WFD and WEWS Act. Development of a strategy to tackle diffuse<br />
pollution is a priority – a combination of regulation, incentives and advice should<br />
be applied on a widespread b<strong>as</strong>is and targeted in key are<strong>as</strong>. Me<strong>as</strong>ures designed<br />
to address the problem must also deliver multiple objectives including habitat<br />
177
protection and restoration, sustainable flood management, cleaner water supplies<br />
and recreational waters, and public health improvements.<br />
ACKNOWLEDGEMENTS<br />
We are grateful for the input of policy officers from SEPA and SNH to this work.<br />
REFERENCES<br />
Haygarth Phil, Penny Johnes, Dan Butterfield, Bob Foy and Paul Withers (2003). Land<br />
Use for Achieving ‘Good Ecological Status’ of Waterbodies in England and Wales:<br />
A Theoretical Exploration for Nitrogen and Phosphorus. A study commissioned by<br />
Defra.<br />
SEERAD (2005). Diffuse water pollution from rural land use: Consultation Paper by<br />
the Scottish Executive Paper 2005/35.<br />
http://www.scotland.gov.uk/Publications/2005/12/12152505/25059<br />
SEPA (2005). Scotland River B<strong>as</strong>in District. Characterisation and Impacts Analysis<br />
required by Article 5 of the Water Framework Directive. Summary Report. SEPA,<br />
Stirling.<br />
SEPA and Environment Agency (2005). Solway Tweed River B<strong>as</strong>in District.<br />
Characterisation and Impacts Analysis required by Article 5 of the Water Framework<br />
Directive. Summary Report. SEPA, Stirling.<br />
Vinten AJA, Towers W, King JA, McCracken DI, Crawford C, Cole LJ, Duncan A, Sym<br />
G, Aitken M, Avdic K, Lilly A, Langan S and Jones M (2005). Appraisal of rural BMP’s<br />
for controlling diffuse pollution and enhancing biodiversity. SNIFFER Report, Project<br />
WFD13: www.sniffer.org.uk.<br />
178
FARMER UPTAKE OF NUTRIENT MANAGEMENT BEST<br />
PRACTICE<br />
G Goodl<strong>as</strong>s<br />
ADAS, Gleadthorpe, Meden Vale, Mansfield, Notts, NG20 9PF, UK,<br />
E-mail: gillian.goodl<strong>as</strong>s@ad<strong>as</strong>.co.uk<br />
SUMMARY<br />
Encouraging farmers to make changes in their farming practices is a major challenge<br />
for all involved in minimising the risk of diffuse pollution from agricultural activity.<br />
Effecting a change involves good communication to improve understanding; oneto-one<br />
advice illustrating the impact to the farmer’s own situation appears to be<br />
most effective. Recent Defra campaigns have concentrated on ‘training the trainers’<br />
with a view to maximising the dissemination of informed advice. Some best practice<br />
me<strong>as</strong>ures are e<strong>as</strong>y for farmers to implement, while others may involve a major capital<br />
outlay or a complete change of management style. Incentives (either financial or<br />
through improved market opportunities) can encourage changes where these extra<br />
costs would otherwise be an insurmountable obstacle. However, changes in fertiliser<br />
use in designated NVZ are<strong>as</strong> suggest that regulation and non-compliance penalties<br />
may have the biggest impact.<br />
INTRODUCTION<br />
European legislation to control the quality of water h<strong>as</strong> led to a wide range of<br />
me<strong>as</strong>ures being introduced across Europe to minimise the risk of diffuse pollution<br />
from agricultural activity. While we know much about best practices and mitigation<br />
methods for decre<strong>as</strong>ing diffuse pollution, the challenge is bringing about change in<br />
farming practices. Some best practice me<strong>as</strong>ures are e<strong>as</strong>y for farmers to implement,<br />
while others may involve a major capital outlay or a complete change of management<br />
style. The methods used to encourage uptake of best practice are often a combination<br />
of the ‘carrot and stick’ approach, where the ‘carrot’ usually takes the form of<br />
government support, and the ‘stick’ is regulation and non-compliance penalties.<br />
Because of the need to change farming practice, there have been several recent<br />
projects on these ‘softer’ issues and Defra h<strong>as</strong> introduced a ‘Knowledge Transfer’<br />
research programme. The aim of this paper is to review methods bringing about<br />
change in farmer practices using recent c<strong>as</strong>e studies, literature review and practical<br />
experience.<br />
METHODOLOGIES<br />
Communication<br />
There are many ways to communicate best practice me<strong>as</strong>ures to farmers ranging<br />
from one-to-one through to larger study groups and conferences <strong>as</strong> well <strong>as</strong> media<br />
coverage in the press or on TV/radio (Dampney et al., 2001). These can be summarised<br />
<strong>as</strong> follows:<br />
• One-to-One: most organisations regard direct one-to-one advice <strong>as</strong> the most<br />
effective method of achieving change on farms though recognise that it is<br />
179
expensive. One-to-one contact becomes more important <strong>as</strong> issues become<br />
more difficult or controversial, and advice becomes more complex.<br />
• One to Group: farm walks, discussion groups, technical seminars and<br />
demonstration farms are examples of ‘one to group’ activities that are being<br />
incre<strong>as</strong>ingly used, <strong>as</strong> they are more cost-effective than one-to-one sessions<br />
• Farmer clubs: the permanent group or ‘Farmer Club’ approach can encourage<br />
belonging, trust, bonding, ‘enjoyment’ and the likelihood of a closer interchange<br />
of farm experiences. A recent ‘Integrated Advice Project’ (Anon, 2004) found<br />
group spirit an important means of getting farmers to attend meetings on topics<br />
that they perceived to be less relevant to their businesses. This demonstrates a<br />
problem commonly seen, that participants have firmly held views on the relevance<br />
of topics to their business and are unwilling to readily explore wider issues,<br />
even though they might be of benefit. In the Integrated Advice Project this w<strong>as</strong><br />
particularly the c<strong>as</strong>e with the Environment module, although those that did attend<br />
these meetings found that discussions went well beyond their expectations.<br />
• Telephone: telephone contact is widely used <strong>as</strong> a supporting me<strong>as</strong>ure. Many<br />
organisations have a telephone help-line that is considered to be cost-effective<br />
<strong>as</strong> a first point of contact but often requiring use of other more direct methods to<br />
adequately meet the needs of the enquirer.<br />
• Press: the farming press is generally regarded <strong>as</strong> an important method to raise<br />
awareness of existing issues and new developments, technical, regulatory or<br />
economic. It is low cost, gets to a large audience and allows scope to repeat the<br />
same message in different ways.<br />
• Shows/events: presence at a range of national and/or regional shows and other<br />
events attended by farmers and their advisers is considered useful to raise<br />
awareness and interest, and <strong>as</strong> a means of encouraging farmers to take the next<br />
step towards implementing change on their own farm.<br />
• Demo farms: ‘one-off’ or ‘semi-permanent’ demonstration farms and farm walks<br />
allow farmers to see for themselves how practices perform at a whole farm scale.<br />
Seeing something work in practice under similar practical conditions can often<br />
give a farmer the confidence and final push to make a change on his own farm.<br />
• Conferences and ‘train the influencers’: small interactive seminars and larger<br />
conferences are regarded <strong>as</strong> a good, cost-effective training mechanisms by<br />
targeting professional advisers, the trade and some leading farmers. They are not<br />
attended by the v<strong>as</strong>t majority of farmers who will usually only benefit indirectly via<br />
their adviser, press coverage or informal contact with farmers who do attend.<br />
• Web/email: websites are usually regarded <strong>as</strong> providing static reference material<br />
(e.g. publications lists, publication downloads, contact points), and links to<br />
centralised and standard information, which might support the implementation<br />
of change once a decision in principle, h<strong>as</strong> been taken by the farmer. E-mail is<br />
a quick, cheap and effective means of responding to queries from professional<br />
advisers or for relaying new information. It is also a convenient method for sending<br />
out ‘alerts’ to notify a group of people of some change or development.<br />
• TV/Radio: these media are not commonly used. Where used, it is to raise<br />
awareness and interest in the wider rural community <strong>as</strong> well <strong>as</strong> for farmers.<br />
180
Regional TV and local radio can be used to highlight local issues that interest or<br />
affect farmers.<br />
The Farm Adviser<br />
The value of the adviser in face-to-face communication h<strong>as</strong> been noted in a number<br />
of studies of information provision in agriculture (Jones et al., 1987; Cox et al.,<br />
1990; Fearne 1990; Angell et al., 1997). Farm visits and face-to-face advice w<strong>as</strong><br />
the preferred method of advice delivery stressed by farmers in farmer panels and<br />
agency interviewees, in an appraisal of conservation advice undertaken for English<br />
Nature (Winter et al., 2000). Farmers emph<strong>as</strong>ise the need for a trusted individual<br />
to act <strong>as</strong> a mentor or interpreter and, for the most part, farmers put greatest value<br />
on information that h<strong>as</strong> been interpreted and given in a specific form. Thus, Winter<br />
et al. (2000) found that farmers prefer face-to-face contact with someone who h<strong>as</strong><br />
interpreted the information within the context of their own business, reflecting the<br />
farmer’s lack of time, the incre<strong>as</strong>ingly technical and legislative nature of the required<br />
information and the perceived need for location specific advice. Where organisations<br />
only provide written material, they recognise that its value is greatest if it is read by<br />
professionals who then go on to provide advice to farmers (Angell et al., 1997). The<br />
success of agri-environment schemes, such <strong>as</strong> ESAs and CSS, h<strong>as</strong> been shown to<br />
be critically dependent on the work of project officers or other advisers promoting<br />
the scheme (Cooper, 1999). The crucial role of advisers/consultants in supporting<br />
farmers in their use of complex nutrient management systems w<strong>as</strong> also noted in<br />
a study of European Input-Output accounting systems (Goodl<strong>as</strong>s et al., 2003).<br />
Morris et al. (2000), examining the uptake of arable options in the CSS, also found<br />
that face-to-face interaction with advisors on the farm w<strong>as</strong> an important channel<br />
of communication. The research showed that, although the m<strong>as</strong>s media appeared<br />
to have been the chief vehicle through which farmers became aware of the CSS,<br />
personal communication with advisors played a significant role in persuading farmers<br />
to take up the schemes that they had heard of through the farming press.<br />
In the context of environmental pollution, the FACTS scheme of adviser registration<br />
and continuing professional development (CPD) h<strong>as</strong> an important role to play in<br />
ensuring that advisers are up to date and well informed about the risks <strong>as</strong>sociated<br />
with poor fertiliser and manure management practices.<br />
Voluntary Versus Compulsory Me<strong>as</strong>ures<br />
Best practice me<strong>as</strong>ures may be voluntary, <strong>as</strong> for example in the Codes of Good<br />
Agricultural Practice. The adoption of such me<strong>as</strong>ures is likely to depend on how e<strong>as</strong>y<br />
they are for the farmer to implement. Financial penalties are a significant disincentive<br />
to uptake whilst marketing advantages of compliance such <strong>as</strong> in some Quality<br />
Assurance schemes incre<strong>as</strong>e uptake (Goodl<strong>as</strong>s et al., 2003). Overall the methods<br />
used to encourage uptake of best practice are often a combination of the ‘carrot and<br />
stick’ approach, where the ‘carrot’ usually takes the form of government support,<br />
and the ‘stick’ is regulation and non-compliance penalties.<br />
In the absence of the legislative ‘stick’, a Danish study on what influences farmers<br />
to change their practices suggests that a combination of farmer study groups with<br />
<strong>as</strong>sociated one-to-one advice is very effective (Halberg et al., 2005). However, this<br />
is expensive in terms of advisory input time and only reaches a small number of<br />
181
farmers. In England, recent policy within Defra h<strong>as</strong> been to use the ‘train the trainers’<br />
approach where workshops are used to train advisers and influencers who then p<strong>as</strong>s<br />
the message on to their clients. Such workshops invariably provide FACTS cpd<br />
points for the advisers who attend. This approach h<strong>as</strong> been used successfully in<br />
several recent campaigns such <strong>as</strong> raising awareness of organic manure management,<br />
promoting the latest fertiliser recommendations and explaining the English Action<br />
Programme for NVZ legislation.<br />
Where me<strong>as</strong>ures impact badly on farm profitability there are clearly implications for<br />
financial sustainability. In England, the recent implementation of the stewardship<br />
schemes <strong>as</strong> part of the England Rural Development Programme (ERDP) provides<br />
farmers with an opportunity to receive payment for following best practice me<strong>as</strong>ures.<br />
Those most relevant to pollution from nutrients in the Entry Level Scheme are nutrient,<br />
manure and soil management plans. Advice on each of these topics is currently being<br />
made available in regionally organised workshops under the Environment Sensitive<br />
Farming campaign (Carter, 2006).<br />
RESULTS<br />
Information Sources<br />
Several surveys have been carried out in recent years on farmers preferred source<br />
of information and advice. The British Survey of Fertiliser Practice (BSFP) (Goodl<strong>as</strong>s<br />
et al., 2002) found that 74% of farmers used their own judgement, b<strong>as</strong>ed on<br />
their knowledge and experience of their own farm when making decisions about<br />
fertiliser application rates. Information from advisers and consultants w<strong>as</strong> the next<br />
most common method (41%). A survey of farmers in NVZs (Scott et al., 2003) also<br />
found that the farmers own p<strong>as</strong>t experience w<strong>as</strong> regarded <strong>as</strong> the most important<br />
b<strong>as</strong>is for fertiliser decisions, but the use of agronomic consultancy and farm w<strong>as</strong>te<br />
management plans had incre<strong>as</strong>ed when compared with the start of designation.<br />
Agronomic consultancy, in particular, w<strong>as</strong> the source most frequently described<br />
<strong>as</strong> most useful in 2003 (in a 1996 survey, ‘p<strong>as</strong>t experience’ w<strong>as</strong> chosen by more<br />
farmers).<br />
In a 2004 survey, Chambers (2004) reported that RB209, MANNER and farmer<br />
meetings/conferences were the most commonly used sources of information and<br />
advice. Farmer workshops and on-farm demonstrations were also highly rated.<br />
Arable farmers (76%) made far more use of RB209 than gr<strong>as</strong>sland farmers (24%).<br />
Farmers, and in particular arable farmers (56%), made frequent use of independent<br />
consultants. Consultants used a wide range of information sources, including trade<br />
representatives. The farming press, although frequently used, w<strong>as</strong> not well regarded<br />
<strong>as</strong> a source of credible technical information by either farmers or consultants. They<br />
rated one-to-one advice <strong>as</strong> the most effective means of communicating nutrient<br />
management information. Workshops/courses, local farming events/conferences<br />
and booklets/leaflets were all highly regarded communication vehicles. Around<br />
80% of arable farmers and 70% of gr<strong>as</strong>sland farmers had made use of IT systems<br />
– although the survey datab<strong>as</strong>e w<strong>as</strong> skewed towards software users. IT systems<br />
were highly regarded, with c. 80% of arable farmers and consultants, and c. 75% of<br />
gr<strong>as</strong>sland farmers regarding them <strong>as</strong> either effective or very effective.<br />
182
Effecting a Change in Practices<br />
Farmers in the original (1996) NVZ designation were surveyed at the start of<br />
designation and again in 2003. This re-survey (Scott et al., 2003) allowed an analysis<br />
of the factors (e.g. previous cropping, fertiliser and manure use) taken into account<br />
by farmers within the NVZs when making decisions about fertilisers. For all of the<br />
main factors, farmers were <strong>as</strong>ked to record the frequency with which they took that<br />
factor into account. Responses were ranked from 1–5 (1 = always, 5 = never), so<br />
that an average score could be calculated for each factor. All of these mean scores<br />
were lower in 2003 than in 1996, for both fertiliser and manure planning. The biggest<br />
change w<strong>as</strong> in ‘recent application of organic manures’. This suggests that farmers<br />
in the NVZs are taking the major factors into account more often, before spreading<br />
manure/fertiliser on their fields. In 2001, the BSFP indicated that, although few<br />
farmers used its tables of recommendations, 42% were aware of the RB209 fertiliser<br />
recommendations book (Goodl<strong>as</strong>s et al., 2002). In a later survey (2004) of farmer use<br />
of decision support tools such <strong>as</strong> the RB209 and software such <strong>as</strong> MANNER and<br />
‘your farm and NVZs’, farmers were less likely to have used the software than would<br />
advisers/consultants (Chambers, 2004). In this survey, around 30% of arable farmers<br />
and 20% of gr<strong>as</strong>sland farmers indicated that RB209 had a major influence on their<br />
fertiliser planning.<br />
Recent BSFP results (Goodl<strong>as</strong>s and Welch, 2005) suggest that, for several crops,<br />
N fertiliser inputs are being reduced in the presence of organic manures (Table 1).<br />
Except for potatoes the amount of reduction is greater in farms within NVZ designated<br />
are<strong>as</strong>.<br />
Table 1:<br />
Effect of NVZ designation on reduction in applied fertilizer N in<br />
presence of manure<br />
Crop NVZ N reduction (kg/ha)<br />
Winter wheat No -4<br />
Winter wheat Yes -16<br />
Winter oilseed rape No -31<br />
Winter oilseed rape Yes -45<br />
Potatoes No +27<br />
Potatoes Yes +22<br />
Sugar beet No +27<br />
Sugar beet Yes -19<br />
Forage maize No -33<br />
Forage maize Yes -74<br />
Impact of Legislation<br />
As indicated above, the NVZ legislation h<strong>as</strong> had an effect on the factors farmers<br />
take into account when making decisions and there is evidence (Scott et al., 2003)<br />
that livestock farmers (especially those in the pig/poultry sector) have found this<br />
legislation h<strong>as</strong> had a big impact on their farming practices. It is too early to say<br />
what impact Cross Compliance and the Stewardship Schemes will have on farmer<br />
183
practices but, hopefully, the changes seen <strong>as</strong> a result of NVZs will gain momentum<br />
under the Environment Sensitive Farming campaign (Carter, 2006).<br />
CONCLUSIONS<br />
Given the advertising endeavour put into making us change our buying habits by<br />
large multinationals it is not surprising that making changes in farming practices<br />
takes time and effort. M<strong>as</strong>s media and generic literature is relevant to awareness<br />
creation, but personal contact and demonstration are critical if persu<strong>as</strong>ion is to<br />
lead to action. The best advocates of agri-environmental schemes are participant<br />
farmers themselves. Surveys in England suggest that fertiliser and organic manure<br />
management are changing <strong>as</strong> marketing and legislative pressures encourage<br />
awareness of best practice. The current Environment Sensitive Farming campaign<br />
h<strong>as</strong> major role to play in taking this forward.<br />
ACKNOWLEDGEMENTS<br />
This paper h<strong>as</strong> drawn on the results from several projects, the work of other colleagues<br />
involved in these projects is acknowledged together with the funding received.<br />
REFERENCES<br />
Anon (2004). The Integrated Advice Pilot Project. Internal Defra Report.<br />
Angell B, Francis J, Chalmers A and Flint C (1997). Agriculture and the Rural Economy<br />
Information and Advice Needs. Internal MAFF Report.<br />
Carter A (2006). Environment Sensitive Farming – Practical advice for land managers.<br />
In: Proceedings of the SAC/SEPA Conference: Managing Rural Diffuse Pollution, 5-6<br />
April 2006, Edinburgh (this publication).<br />
Chambers B (2004). Nutrient management decision support systems: process<br />
improvement (KT0118). Internal Defra Report.<br />
Cooper NK (1999). Street Level Bureaucrats and Agri-Environmental Schemes: The<br />
C<strong>as</strong>e of the FRCA Project Officer Implementing ESA Schemes in England and Wales.<br />
PhD thesis, King’s College, London.<br />
Cox G, Lowe P and Winter M (1990). The Voluntary Principle in Conservation: A<br />
Study of the Farming and Wildlife Advisory Group. Packard, Chichester.<br />
Dampney PMR, Winter M and Jones D (2001). Communication Methods to Persuade<br />
Agricultural Land Managers to Adopt Practices that will Benefit Environmental<br />
Protection and Conservation Management (AgriComms). Internal Defra Report.<br />
Fearne A (1990). Communications in agriculture: results of a farmer survey. Journal<br />
of Agricultural Economics 41, 371-380.<br />
Goodl<strong>as</strong>s G, Rush C and Wilshin S (2002). British Survey of Fertiliser Practice:<br />
fertiliser use on farm crops for crop year 2001. The BSFP Authority, London ISBN 1<br />
86190 123 2<br />
Goodl<strong>as</strong>s G, Halberg N and Verschuur G (2003). Input output accounting systems<br />
184
in the European community-an appraisal of their usefulness in raising awareness of<br />
environmental problems. European Journal of Agronomy 20, 17–24.<br />
Goodl<strong>as</strong>s G and Welch W (2005) British Survey of Fertiliser Practice: Fertiliser Use on<br />
Farm Crops for Crop Year 2004. The BSFP Authority, London.<br />
Halberg N, Verschuur G and Goodl<strong>as</strong>s G (2005). Farm level environmental indicators;<br />
are they useful? An overview of green accounting systems for European farms.<br />
Agriculture, Ecosystems and Environment 105, 195–212.<br />
Jones GE, Rolls MJ and Tranter RB (1987). Information management in agriculture.<br />
British Library R&D report.<br />
Morris J, Mills J and Crawford IM (2000). Promoting uptake of agri-environmental<br />
schemes: the Countryside Stewardship Arable Options Schemes. Land Use Policy<br />
17, 241-254.<br />
Scott T, Hollis K, Goodl<strong>as</strong>s G, Johnson PA and Shepherd MA (2004). Nitrate vulnerable<br />
zones - 2003 re-survey report. Internal Defra report.<br />
Winter M, Mills J and Wragg A (2000). Practical delivery of farm conservation<br />
management in England. English Nature Research Report 393 by Countryside and<br />
Community Research Unit, University of Gloucestershire.<br />
185
A CASE STUDY: ADOPTION OF BEST MANAGEMENT<br />
PRACTICE IN BRITTANY (FRANCE) USING ECONOMIC<br />
INSTRUMENTS AND REGULATION<br />
P Newell Price 1 and M-L Daumer 2<br />
1<br />
ADAS, Gleadthorpe, Meden Vale, Mansfield, Notts, NG20 9PF, UK, E-mail: paul.<br />
newell-price@ad<strong>as</strong>.co.uk; 2 Cemagref, Livestock and Municipal W<strong>as</strong>te Management<br />
Research Unit, 17 avenue de Cucille, CS 64427, 35044 Rennes Cedex, France<br />
SUMMARY<br />
French intensive livestock production h<strong>as</strong> become incre<strong>as</strong>ingly concentrated<br />
in Brittany over the p<strong>as</strong>t 40 years. This h<strong>as</strong> resulted in a serious diffuse pollution<br />
problem. Incre<strong>as</strong>ing nitrate concentrations in waters and eutrophication have<br />
impacted on water treatment, the environment and tourism. To deal with this<br />
situation, environmental regulations were introduced in 2001 at both a regional<br />
and departmental level. Funding is now provided via the Agence de l’Eau and the<br />
regional and departmental councils to help farmers improve water quality. This paper<br />
uses the approach taken in Brittany <strong>as</strong> an example of how one European region h<strong>as</strong><br />
attempted to reduce diffuse pollution through a combination of education, economic<br />
instruments and regulation.<br />
INTRODUCTION<br />
After the introduction of the Nitrates Directive, EU member states were required<br />
to implement a programme of me<strong>as</strong>ures to reverse the trend of incre<strong>as</strong>ing nitrate<br />
concentrations in sensitive waters. The methods used to improve water quality vary<br />
between countries, according to the specific nature of the problem and the degree<br />
to which regulation and economic instruments are seen <strong>as</strong> acceptable means of<br />
attempting to address this issue. This paper provides an overview of the approach<br />
taken in Brittany (France) where regulation and economic instruments have been<br />
used since 1994 to encourage farmers to adopt what are considered to be the best<br />
management practices for the region.<br />
CONTEXT<br />
Only 5% of French agricultural land is in Brittany, but the region contains 55% of<br />
French pig production and a large proportion of dairy and poultry production. This<br />
concentration of livestock supports a food production and processing economy that<br />
is vital to the prosperity and identity of the region (SCEES, 1995). However, such<br />
intensification gives rise to a number of environmental and logistical problems. Large<br />
quantities of animal feed are imported into the region but the livestock themselves<br />
only retain a small proportion of the nutrients. As a result, in many instances the<br />
amount of nutrients excreted by livestock is far greater than the amount required to<br />
support crop growth at a farm or district level.<br />
The intensification of livestock production in the Brittany region h<strong>as</strong> also led to some<br />
conflict with tourism (Merceron, 1999). For example, the incre<strong>as</strong>e in eutrophication<br />
of surface waters and estuaries h<strong>as</strong> been attributed to nutrient surplus (Figure 1).<br />
This h<strong>as</strong> been an area of particular concern, given the importance of bathing waters<br />
and shellfisheries to the economy of the region.<br />
186
80000<br />
60000<br />
40000<br />
20000<br />
Volume of green algae collected (m3)<br />
Number of communes collecting green algae<br />
80<br />
60<br />
40<br />
20<br />
0<br />
1997 1998 1999 2000 2001 2002 2003<br />
0<br />
Figure 1: The impact of algal blooms on the Brittany co<strong>as</strong>t since 1997 – the<br />
quantity of algae collected and the number of communes affected<br />
(source: DIREN Brittany)<br />
Figure 2 illustrates that in 2004 mean nitrate concentrations for a number of rivers in<br />
Brittany were well over the 50 mg/L limit. This is despite efforts made to reduce the<br />
amount of nitrate (and phosphorus) lost from the surrounding agricultural land.<br />
Figure 2: Mean and maximum nitrate concentrations in the river water of<br />
Brittany. The dark columns indicate where values are greater than<br />
50 mg/L (Source: Brittany Direction Régionale de l’Environnement)<br />
187
The approaches taken by Brittany to reduce nitrate and phosphorus pollution have<br />
been influenced by a long history of legislation, starting in 1810, when a regulation for<br />
registered holdings (la réglementation des installations cl<strong>as</strong>sées pour la protection de<br />
l’environnement – ICPE) w<strong>as</strong> first introduced. This regulation w<strong>as</strong> designed to control<br />
activities that are detrimental to environmental and public health.<br />
The ICPE regulation h<strong>as</strong> been modified a number of times and is applied to livestock<br />
enterprises holding numbers of animals above set thresholds. It imposes certain<br />
obligations on the farmer, such <strong>as</strong> the need for manure management plans and the<br />
active management of the nitrogen (N) surplus. Holdings are subject to inspections by<br />
the regional administration. In 2005, Brittany contained 12,000 authorised registered<br />
holdings (including 9782 livestock enterprises): representing 17% of the ICPE in<br />
France (Daumer et al., 2005).<br />
Nitrates Directive in Brittany<br />
Brittany is particularly sensitive to nitrate pollution <strong>as</strong> 80% of drinking water is<br />
derived from surface water sources. In 1994, the whole of Brittany w<strong>as</strong> designated<br />
a Nitrate Vulnerable Zone (NVZ). Table 1 summarises the regulatory process and<br />
actions related to implementation of the Nitrates Directive. In the are<strong>as</strong> of highest<br />
livestock density, more stringent me<strong>as</strong>ures have since been introduced.<br />
Table 1:<br />
The regulatory framework <strong>as</strong>sociated with the implementation of<br />
the Nitrates Directive in Brittany (source: Daumer et al., 2005)<br />
December 1991 Nitrates Directive<br />
December 1994 Brittany is designated a Nitrate Vulnerable Zone (NVZ)<br />
1994–1995 Delineation of 71 ZES and 1st nutrient removal program<br />
1996–2001 First Nitrate Directive Action Programme<br />
Nutrient Management Plans are mandatory<br />
January 1998 Thresholds introduced for manure treatment and limits put on spreading<br />
are<strong>as</strong><br />
July 2001 Second Nitrate Directive Action Programme<br />
Delineation of complementary action zones (ZACs) including:<br />
• Mandatory cover crops over winter<br />
• Nitrogen application limit of 210 kg/ha/year<br />
March 2002 Manure management plans mandatory for new young farmers and all<br />
registered holdings under the IPCE regulations<br />
July 2002 Revision of ZES (104 cantons) and 2nd nutrient removal programme<br />
An <strong>as</strong>sessment w<strong>as</strong> made of the manure N loading in each canton (local administrative<br />
district). Those cantons where the amount of manure N exceeded 170 kg/ha of<br />
agricultural land were designated <strong>as</strong> zones d’excedents structurels (ZES) (structural<br />
surplus zones). There are now 104 ZES and these cover 70% of the region. In these<br />
ZES cantons, actions have to be taken by the largest livestock producers to reduce<br />
the amount of nutrients spread on the land through a combination of two or more of<br />
the following me<strong>as</strong>ures:<br />
• Reduce the number of livestock.<br />
• Reduce the amount of nutrients excreted through changes in animal diet.<br />
188
• Treatment of manures and slurries to remove P and N.<br />
• The transfer of treated manures out of the region.<br />
The requirement to treat depends on the size of the herd on farm and the extent of<br />
the manure N overloading in the canton. The largest pig producers (e.g. producing<br />
> 25,000 kg manure N) in sensitive cantons are obliged to both separate slurries for<br />
P removal (80% of the manure P must be removed) and treat the liquid to reduce the<br />
amount of N in the resulting effluent. However, the livestock threshold for mandatory<br />
treatment varies according to the overall manure N loading within each ZES.<br />
Many of the treatment technologies are costly to set up and operate, and so funding<br />
h<strong>as</strong> been made available to help with investment (Le Louarn, personal communication).<br />
For example, in the Department of Côte d’Armor the following funding is available:<br />
• The Agence de l’Eau (Water Agency) provides up to 30% of the investment<br />
cost.<br />
• The General Council (Departmental level) will provide up to 15% of investment<br />
costs for farm holdings producing 20,000 kg/a of manure N or less, a maximum<br />
of 110,000 euros per holding.<br />
• The Regional Council of Brittany also provides up to 15% of investment costs<br />
for farm holdings producing 20,000 kg/year of manure N or less, but up to a<br />
maximum of 140,000 euros per holding<br />
It is therefore possible for up to 60% of the treatment costs to be paid by regional<br />
funding. However in reality, only those farm holdings that have met the IPCE and<br />
PMPOA (Programme de Maîtrise des Pollutions d’origine Agricole) regulations since<br />
1994 are eligible. In the majority of c<strong>as</strong>es, the level of funding obtained per holding<br />
ranges from 0% to 30% (Le Bris, personal communication).<br />
Farms that are obliged to take action can obtain advice from the General Council,<br />
the Chamber of Agriculture and the various companies that market treatment<br />
technologies. Where treatment is an economically viable option, farms can group<br />
together to form a GIE (Groupement d’Intérêt Economique). However, the majority<br />
(88%) of treatment plants are operated by individual farms (Le Bris et al., 2005). On<br />
those farms for whom the treatment option is not economic, the only alternatives<br />
are to:<br />
• transfer w<strong>as</strong>tes to cantons where the manure N loading is less than 140 kg/ha;<br />
• reduce the amount of N produced by introducing bi-ph<strong>as</strong>e or multi-ph<strong>as</strong>e<br />
feeding;<br />
• incinerate the w<strong>as</strong>te (fe<strong>as</strong>ible for poultry) with transfer of <strong>as</strong>h products; and<br />
• reduce the number of livestock.<br />
189
MANURE TREATMENT<br />
By January 2005, there were 266 farm w<strong>as</strong>te treatment plants in Brittany (Le Bris<br />
et al., 2005). Of these, about 70% use aerobic biological treatment, with or without<br />
separation. Most of the remainder use composting technologies involving straw and<br />
green w<strong>as</strong>te combined with slurry. There are also a few (< 10) physico-chemical,<br />
ph<strong>as</strong>e separation plants.<br />
The most popular treatment technology on many farms is aerobic biological<br />
treatment using nitrification/denitrification. This approach can eliminate up to 70%<br />
of the total N in pig slurry (Burton et al., 1993, Melse et al., 2002, Béline et al., 2004)<br />
and, if combined with mechanical separation, up to 80% of the slurry P can also be<br />
removed (Béline et al., 2004).<br />
Within such treatment plants the two processes of nitrification and denitrification are<br />
carried out via separate aerobic and anoxic ph<strong>as</strong>es. Under controlled commercial<br />
conditions, the denitrification of nitrate to di-nitrogen g<strong>as</strong> is carried out efficiently.<br />
However, when poor management leads to nitrite accumulation in the reactor, this<br />
can give rise to emissions of nitrous oxide. This is a potent greenhouse g<strong>as</strong> that<br />
contributes 260 times the effect of carbon dioxide on a weight b<strong>as</strong>is (IPCC, 1990).<br />
Béline et al. (1999) found that up to 30% of total N can be lost <strong>as</strong> nitrous oxide<br />
during an aeration ph<strong>as</strong>e of between 4 days and 1 week. However, subsequent<br />
research (Béline and Martinez, 2002) h<strong>as</strong> shown that a short aeration ph<strong>as</strong>e followed<br />
by an extended anoxic ph<strong>as</strong>e (aerobic to anoxic ratio = 0.375) can result in complete<br />
denitrification without N2O emissions, provided there is sufficient available carbon<br />
in the slurry. These recommendations have been incorporated in the management<br />
practices of commercial plants and no nitrous oxide emissions were found during<br />
recent me<strong>as</strong>urements carried out on site.<br />
Transformations can also occur in storage and there is a higher risk of nitrous oxide<br />
emissions when carbon availability in the slurry is low (Béline et al., 1999). It is<br />
therefore very important that aerobic treatment is well managed and that changes<br />
in livestock structure are taken into account to avoid nitrous oxide or ammonia<br />
emissions. One problem that h<strong>as</strong> arisen in recent years is that, when changes occur<br />
within a GIE, aerobic biological treatment plants have to cope with changes in the<br />
quantity and type of slurry to be treated (Poilvet, 2005). Such incremental changes<br />
can force adaptations to the treatment system, such <strong>as</strong> residence time and sequence<br />
of events, which do not take account of the potential environmental risks. If these<br />
changes are not monitored, they could give rise to an incre<strong>as</strong>e in the amount of<br />
pollution swapping.<br />
CONCLUSIONS<br />
Aerobic treatment of surplus slurry is seen <strong>as</strong> a useful part of the armoury to help<br />
prevent nitrate pollution of water. Such systems are effective in reducing the amount<br />
of N entering soils and ultimately water. However, if they are not closely monitored<br />
and controlled they can give rise to the loss of N in the form of ammonia and nitrous<br />
oxide, both of which are potentially harmful pollutants. In order to support the creation<br />
and maintenance of efficient treatment systems, funding is available to farmers for<br />
up to 60% of investment. This and further research funding will be necessary to<br />
ensure that farmers are given sufficient scientific and technical support to carry out<br />
manure treatment while minimising the risks to the environment.<br />
190
ACKNOWLEDGEMENTS<br />
We acknowledge the support of the Department for Environment, Food and Rural<br />
Affairs (Defra) for the funding of this collaborative work. We also acknowledge the<br />
help provided by the Chamber of Agriculture of Ille et Vilaine and Cemagref, Rennes<br />
in the gathering of information.<br />
REFERENCES<br />
Béline F and Martinez J (2002). Nitrogen transformations during biological aerobic<br />
treatment of pig slurry: effect of intermittent aeration on nitrous oxide emissions.<br />
Bioresource Technology 83, 225–228.<br />
Béline F, Daumer M-L and Guiziou F (2004) Biological aerobic treatment of pig slurry<br />
in France: nutrients removal efficiency and separation performances. Transactions of<br />
the American Society of Agricultural Engineers 47, 857–864.<br />
Béline F, Martinez J, Chadwick D R, Guiziou F and Coste C-M (1999). Factors affecting<br />
nitrogen transformations and related nitrous oxide emissions from aerobically treated<br />
piggery slurry. Journal of Agricultural Engineering Research 73, 235–243.<br />
Burton C H, Sneath R W and Farrent J W (1993). The effect of continuous aerobic<br />
treatment on the fate of the nitrogen in piggery slurry. In: MVA Verstegen, LA Den<br />
Hartog, GJM van Kempen and JHM Metz (eds), Nitrogen Flow in Pig Production and<br />
Environmental Consequences. Symposium Proceedings, Wageningen, 8-11 June<br />
1993. EAAP Publ. No. 69, 404–409.<br />
Daumer M-L, Béline F, and Guiziou F (2005). Traitement biologique des lisiers de<br />
porcs en boues activées. Guide technique à l’usage des concepteurs, exploitants et<br />
organismes de contrôle des stations. Cemagref Editions, JOUVE, Paris.<br />
IPCC (1990). Climate Change (JT Houghton, GJ Jenkins, JJ Ephraums and Varney<br />
eds). Cambridge University Press, Cambridge.<br />
Le Bris B, David M, Gorius H, Jégou J-Y and Quillen J-P (2005). Stations de<br />
traitement lisier: veille téchnologique et bilan de fonctionnement. Etude realisée avec<br />
le concours financier de l’ADAR et du Comité Regional Porcin. Technical Report,<br />
Chambre d’Agriculture de Bretagne, RENNES, France.<br />
Melse RW, Starmans DAJ and Verdoes N (2002). G<strong>as</strong>eous emissions from systems<br />
for pig slurry treatment. In: J van Ham, APM Baede, R Guicherit and JGFM Williams-<br />
Jacobse (eds), Non-CO2 greenhouse g<strong>as</strong>es: scientific understanding, control options<br />
and policy <strong>as</strong>pects. Proceedings of the Third International Symposium, Ma<strong>as</strong>tricht,<br />
Netherlands, pp. 51–52. Millpress Science Publishers, Rotterdam, the Netherlands.<br />
Mereceron M (1999). Green tides in Brittany: Current state of knowledge in non-point<br />
pollution: From watershed to littoral (in French). Ifremer, France.<br />
Poilvet D (2005). Valétec valide le traitement biologique en b<strong>as</strong>sins separés. Réussir<br />
Porcs, June 2005.<br />
SCEES (1995). Service Central d’Etudes et d’Enquêtes Statistiques. Graphagri,<br />
France.<br />
191
REGULATORY OPTIONS FOR THE MANAGEMENT OF<br />
RURAL DIFFUSE POLLUTION<br />
BJ D’Arcy 1 , K Schmulian 1 and R Wade 2<br />
1<br />
Scottish Environment Protection Agency, 7 Whitefriars Crescent, Perth, PH2 0PA,<br />
UK, E-mail: Brian.Darcy@sepa.org.uk; 2 University of Abertay, Dundee, DD1 1HG, UK<br />
SUMMARY<br />
On 1 April, a new regulatory regime in Scotland came into force, bringing in<br />
regulations to implement much of the requirements of the Water Framework Directive<br />
(WFD). The WFD requires that diffuse sources of pollution are regulated, and this<br />
paper examines how far that can be achieved under the new Controlled Activities<br />
Regulations (CAR) regime, <strong>as</strong> well <strong>as</strong> considering opportunities for further control<br />
under additional regulations, and perhaps beyond them.<br />
INTRODUCTION<br />
Diffuse pollution is a statutory area of core business throughout the EU under the<br />
Water Framework Directive (WFD). Of course, even before WFD, diffuse pollution<br />
w<strong>as</strong> statutory business in Scotland and the rest of the UK. For example, in relation<br />
to nitrates in Nitrate Vulnerable Zones (NVZs), faecal pathogens in bathing waters,<br />
nutrients in lochs, and for diffuse pollution hotspots anywhere. Indirect or advisory<br />
me<strong>as</strong>ures have also been used for many years, for example, in relation to forestry<br />
practices and many of the me<strong>as</strong>ures in the Prevention of Environmental Pollution<br />
From Agricultural Activity (PEPFAA) Code for agriculture. But the Water Framework<br />
Directive specifically requires that diffuse sources of pollution are controlled, not just<br />
a particular cl<strong>as</strong>s of pollutants and not leaving the regulators with the soft option<br />
of merely controlling the pollutants in major point sources. This paper focuses on<br />
the use of the Water Environment and Water Services (Scotland) Act 2003, (the<br />
WEWS Act) and subsequent regulations, notably The Water Environment (Controlled<br />
Activities) (Scotland) Regulations 2005, (referred to <strong>as</strong> CAR below) for managing<br />
diffuse pollution from rural sources. These provisions came into force on 1 April<br />
2006. This paper also considers the possible form and content of further regulations<br />
targeted more closely at the problem and possible regulatory solutions.<br />
The effectiveness and appropriateness of regulation in the UK h<strong>as</strong> been the object<br />
of serious consideration after the publication of the report by Philip Hampton for<br />
HM Tre<strong>as</strong>ury on regulatory inspections and enforcement. While there is no specific<br />
equivalent in Scotland, the report h<strong>as</strong> been influential. One of the recommendations<br />
of that review w<strong>as</strong> that consideration should be given to alternatives to regulation<br />
and to striking the correct balance for regulation; proportionate to environmental<br />
risks. The Water Framework Directive allows the use of what it calls supplementary<br />
me<strong>as</strong>ures (economic support schemes, voluntary initiatives, policy considerations with<br />
regard to pesticide or fertiliser taxes, etc.). An integrated approach to supplementary<br />
me<strong>as</strong>ures and regulation is discussed in Davies (2006) and Campbell et al. (2004),<br />
and is inherent in SEPA strategy (e.g. SEPA 2004a).<br />
Although the requirement for regulation is explicit in WFD, there is scope for a light<br />
touch or for tighter regulation. Figure 1 presents a representation of the three key<br />
192
factors influencing a polluter’s willingness to change behaviour and practices. There<br />
w<strong>as</strong> no doubt that prior to the recent reform of the Common Agricultural Policy,<br />
when the farm payments system drove farmers to ever more intensive practices, it<br />
would have taken a hugely expensive regulatory and educational effort to counter<br />
that economic driver and prevent the environmental impacts of agriculture.<br />
Figure 1: Minimizing regulation (Campbell et al., 2004)<br />
It is hoped that the scenario presented in Figure 1B is now more applicable, with<br />
economic support now more aligned with the environmental drivers, allowing the<br />
adoption of a lighter touch for regulation.<br />
Managing diffuse pollution under the provisions of the WEWS Act 2003 and<br />
regulations in CAR 2005<br />
There is considerable scope for controlling pollution from diffuse sources under<br />
these statutes. Enforcement is predicated on the identified activity having an<br />
individually significant impact, at the scale of individuals undertaking the activity.<br />
At first sight that seems to rule out most of the significant diffuse source loads in<br />
a rural catchment, but it does allow for intervention in relation to diffuse pollution<br />
hotspots. Thus in circumstances where evidence of environmental impacts upstream<br />
and downstream of an activity can be collected, then there is an evidential b<strong>as</strong>is for<br />
enforcement action, just <strong>as</strong> there would have been under COPA (1974 Control of<br />
Pollution Act). SEPA will also be able to serve notices to require corrective me<strong>as</strong>ures<br />
in such circumstances. This sort of regulatory control would apply to incidents where<br />
pollution is caused and a particular farm and farmer can be held responsible. The<br />
CAR 2005 provisions allow for the prevention of further such pollution, by embodying<br />
the necessary prevention conditions in a registration or licence. Example scenarios<br />
are given below.<br />
The CAR offence provisions are set out in regulation 40 and, for example in relation to<br />
pollution incidents (diffuse pollution hotspots), provisions covering powers to serve<br />
notices and undertake work and recover costs, are set out in regulations 28, 29 and<br />
31.<br />
193
There are also me<strong>as</strong>ures that control pollution risks (<strong>as</strong> well <strong>as</strong> other environmental<br />
impacts) from a number of specific activities that are often undertaken in rural are<strong>as</strong>,<br />
established in General Binding Rules (GBR) (see next section and regulation 7 of<br />
CAR 2005). These are set out in CAR in Schedule 3, Part 1, and brief indications of<br />
scope and content are given below.<br />
The relevant GBRs cover the following activities:<br />
• Dredging a river, burn or ditch (GBR 5).<br />
• Bridge construction (GBR 6).<br />
• Laying a pipeline or cable beneath the bed or banks of a river, burn or ditch (GBR<br />
7).<br />
• Revetment work to control bank erosion (GBR 8).<br />
• Operating any vehicle, plant or equipment for the purposes of activity 5, 6, 7 or 8<br />
(GBR 9).<br />
• Discharge of surface run-off from a surface water drainage system to the water<br />
environment from construction sites, buildings, roads, yards and any other built<br />
developments (GBR 10).<br />
• Discharge into a surface water drainage system (GBR 11).<br />
The pollution prevention requirements in GBRs 5–8 include (paraphr<strong>as</strong>ed for this<br />
paper):<br />
• Vegetation shall not be disposed of into the channel.<br />
• All re<strong>as</strong>onable steps must be taken to prevent incre<strong>as</strong>ed erosion of bed or banks,<br />
and prevent transport of disturbed sediments beyond the reach where work is<br />
being done.<br />
• Works shall not be undertaken during periods when fish are likely to be spawning,<br />
or in the period between any such spawning and the emergence of the juvenile<br />
fish.<br />
• Revetments shall be constructed of non-polluting materials.<br />
The pollution prevention requirements in GBR 9 include:<br />
• Refuelling at le<strong>as</strong>t 10 metres from any surface water.<br />
• Drip tray required for static plant, with 110% of capacity of fuel tank.<br />
• Plant or other equipment with oil leaks shall not be used.<br />
• W<strong>as</strong>hing plant, etc. shall be at le<strong>as</strong>t 10 metres from surface water and w<strong>as</strong>h<br />
waters shall not be allowed to enter surface water.<br />
In contr<strong>as</strong>t to the earlier GBRs, numbers 10 and 11 are primarily to prevent pollution,<br />
or damage to treatment systems. The pollution prevention requirements in GBR<br />
10–11 refer to surface water drainage from the built environment and include:<br />
• The discharge shall not contain any trade effluent or sewage, shall not cause<br />
visual impairment, destabilisation of stream bed or banks, or cause pollution.<br />
• SUDS technology is to be used for new developments.<br />
194
• The discharge shall not contain drainage from chemical, oil or other polluting<br />
matter loading/unloading/handling are<strong>as</strong>.<br />
• Do not dispose of oil, paint or paint thinners, pesticides, detergents, disinfectants<br />
or other pollutants into a surface drainage system, or allow any material that might<br />
impair its performance and function to enter a surface water drainage system.<br />
GBRs, Registration or Licences?<br />
The CAR regulatory regime allows for three levels of authorisation (Part II, regulations<br />
7–10), and SEPA may serve a notice on a person responsible for an activity, to<br />
change the level of authorisation (regulation 11). The most b<strong>as</strong>ic level is the General<br />
Binding Rule (GBR); essentially this way of controlling activity simply establishes the<br />
requirements to prevent environmental harm. It is an offence to carry out the activity<br />
in breech of those requirements. A precedent is the way the oil storage regulations<br />
have been established in England and Wales, and the successive regulations across<br />
the UK for controlling pollution risks <strong>as</strong>sociated with the storage of silage, slurry and<br />
agricultural fuel oil. For existing establishments there is no need to register with the<br />
regulatory agency, but enforcement can be undertaken by notices on inspection.<br />
The GBR is therefore the le<strong>as</strong>t bureaucratic regulatory option. To quote the recent<br />
rural diffuse pollution consultation by the Scottish Executive (2005):<br />
‘…<strong>as</strong> far <strong>as</strong> is practicable, the b<strong>as</strong>ic level of authorisation, national GBRs, should be<br />
used <strong>as</strong> the b<strong>as</strong>is of control. This minimises the regulatory burden on the industry,<br />
while requiring a b<strong>as</strong>ic minimum of action to be taken to prevent pollution…’<br />
Registration is the next level of authorisation, requiring the farmer to register the farm<br />
with SEPA, and to comply with a simple set of pollution control me<strong>as</strong>ures. A fee will<br />
be payable to cover administrative costs; there could also be a subsistence charge<br />
to cover the costs for SEPA of inspections and meetings on the farms and <strong>as</strong>sociated<br />
office work. For the rare situations where a particular farm or other rural enterprise<br />
is individually significant in a catchment, then SEPA may require an authorisation<br />
in the form of a licence for the farm. That would allow for site-specific conditions,<br />
rechargeable costs for monitoring and inspection.<br />
Licences have previously been held by many farmers, for example for septic<br />
tank discharges under COPA and earlier legislation, and more recently under the<br />
groundwater regulations. Under the CAR, these will be transferred to become either<br />
registrations or licences.<br />
What is Missing in CAR for Managing Diffuse Pollution from Rural<br />
Sources?<br />
The gaps are how to control the individually minor but collectively significant impacts;<br />
background contamination that is a function of land-use – <strong>as</strong> identified in the Scottish<br />
Executive consultation (2005) Diffuse Water Pollution from Rural Land Use. The<br />
SEPA strategy document for managing diffuse pollution (SEPA, 2004) highlighted<br />
the importance of the Best Management Practices (BMPs) approach developed<br />
in the USA (see chapter 2 in Campbell et al., 2004, definitions and discussions in<br />
Novotny 2003, and D’Arcy and Frost, 2001). Many of the BMPs in those references<br />
are addressing <strong>as</strong>pects of farming and forestry practice that have not hitherto been<br />
195
widely recognised <strong>as</strong> needing much attention in Scotland or indeed much of the<br />
UK; contamination <strong>as</strong>sociated with livestock grazing in fields, with growing crops<br />
in are<strong>as</strong> prone to soil erosion, harvesting timber, movements of livestock, access<br />
to watercourses. There are also strategic decisions to be taken in catchment<br />
management, for example recognition that with or without BMPs, there will be more<br />
P and N loss from a field of potatoes than from a gr<strong>as</strong>s field or cereal crop: the landuse<br />
decision is the first level for managing pollution risks. A general set of rules could<br />
bring in national me<strong>as</strong>ures, but targeting specific high-risk are<strong>as</strong> of fields for soil<br />
erosion control, lengths of watercourses to be fenced off, etc., would be site-specific<br />
control and likely to be licence territory. It may prove best regulated by an alternative<br />
approach, perhaps using supplementary me<strong>as</strong>ures for site-specific circumstances?<br />
Can Regulation be Focused on the Target Are<strong>as</strong> within a Farm?<br />
The following sections consider how a regulatory approach could ensure use of<br />
BMPs to address rural diffuse pollution problems, and follows the BMP system<br />
used in Campbell et al. (2004) and in the new BMPs Manual produced for SEPA and<br />
stakeholder partners by CEH (Centre for Ecology and Hydrology). Four target are<strong>as</strong><br />
are considered: steading, in-field, riparian and planning tools.<br />
Steading controls<br />
Source apportionment studies have shown that steadings (farm buildings, yards<br />
and any other <strong>as</strong>sociated roof and hard standing are<strong>as</strong>) are a significant source of<br />
contamination (Edwards et al. in prep.) The GBRs 10 and 11 in CAR 2005 effectively<br />
provide a statutory b<strong>as</strong>is for managing pollution risks from steading drainage, and also<br />
for surface run-off from other rural developments such <strong>as</strong> forestry offices, housing<br />
and depots, golf course buildings and car parks, and poultry units, piggeries etc. An<br />
additional requirement in a farm GBR could be to require the use of a biobed where<br />
yard run-off at risk from pesticide handling does not drain naturally onto gr<strong>as</strong>sland.<br />
A broad range of controls can be envisaged for managing pollution risks at steadings;<br />
from control at source for high strength, low volume pollution risks (storage and<br />
handling controls) to high volume, relatively low contamination where drainage<br />
infr<strong>as</strong>tructure me<strong>as</strong>ures are needed to attenuate the pollutants, such <strong>as</strong> SUDS and<br />
other BMP drainage features (see Figure 2). Bhamidimarri et al. (in preparation) are<br />
developing design guidance for constructed farm wetlands. The difficulty for steading<br />
drainage from livestock farms in the UK, is at what point on the schematic (what level<br />
of contamination) can dirty water be allowed to drain to a constructed wetland or<br />
onto gr<strong>as</strong>s where no drainage system is used, without risking a contravention of the<br />
Silage Slurry and Agricultural Fuel Oil regulations (SSAFO regulations).<br />
196
Drainage<br />
Infr<strong>as</strong>tructure<br />
Containment<br />
Behaviour Change<br />
Figure 2: Different pollution control approaches for diffuse sources of<br />
pollution, in relation to volume and toxicity (D’Arcy, 2005)<br />
Modifications to the SSAFO (Scotland) regulations are currently being considered by<br />
the Scottish Executive. The aim of these changes will be to permit more sustainable<br />
management of wider environmental issues and more cost-effective pollution<br />
prevention.<br />
In-field me<strong>as</strong>ures<br />
Land use decisions, which may change on an annual b<strong>as</strong>is for any given farm,<br />
can dr<strong>as</strong>tically alter the diffuse pollution potential of a given area (see D’Arcy and<br />
Frost, 2001). As such, this is perhaps the most difficult area to control by specific<br />
regulations. It is hoped that the cross-compliance elements of the reform of the<br />
Common Agricultural Policy (CAP) of the European Community such <strong>as</strong> GAEC (Good<br />
Agricultural & Environmental Condition), and perhaps land management contracts,<br />
will go a long way to delivering better environmental farming practice. It may be<br />
possible to include GBR me<strong>as</strong>ures that require conservation tillage techniques for<br />
example in nutrient sensitive catchments, or prohibit autumn sowing in erosion prone<br />
soils in nutrient sensitive catchments. Some in-field hotspots can result in pollution<br />
where drainage enters a watercourse at a particular location; this is considered in<br />
the next section.<br />
Riparian me<strong>as</strong>ures<br />
Buffer zones for arable land and for livestock densities in excess of a threshold<br />
could be specified in a national GBR, but would probably have to be so small <strong>as</strong><br />
to be in need of significant extension on a site-specific b<strong>as</strong>is in particular problem<br />
catchments or designated are<strong>as</strong>. The me<strong>as</strong>ures are already widespread in forestry<br />
planting, and in agriculture a buffer zone at le<strong>as</strong>t 2 m wide me<strong>as</strong>ured from the stream<br />
bank top is required under GAEC. Design criteria for effectiveness in relation to<br />
different issues need to be established.<br />
A farm licence would allow for site specific me<strong>as</strong>ures, and the use of maps appended<br />
to the licence showing the lay-out of steep or erosion prone slopes that would not be<br />
197
ploughed, of rivers and streams that would be fenced to exclude livestock, etc. Where<br />
livestock are regularly standing in numbers in a watercourse, perhaps sheltering<br />
where a stream crosses the bottom corner of a field, the impact on water quality can<br />
be severe; a diffuse pollution hotspot. Under the regulations in CAR 2005, a notice<br />
can be served requiring the farmer to carry out me<strong>as</strong>ures such <strong>as</strong> stream fencing and<br />
protection from contaminated field run-off. Similarly pollution can be prevented from<br />
a poorly sited hay-feeder for livestock in a field, to require its relocation to a position<br />
where puddled ground around it will not result in contaminated drainage entering a<br />
watercourse. Use of such provisions to control diffuse pollution hotspots in arable<br />
land might be more difficult to achieve successfully, and it may be better to seek<br />
control by in-field me<strong>as</strong>ures specified in a GBR, backed by catchment initiatives and<br />
GAEC me<strong>as</strong>ures?<br />
Planning and other management techniques<br />
Nutrient budgets, farm manure and slurry management planning are all recognised<br />
good practice. In NVZs, nutrient budgets and farm w<strong>as</strong>te management plans are<br />
already statutory requirements. Such commonsense approaches to use of resources<br />
and avoidance of unnecessary expense, <strong>as</strong> recommended in the PEPFAA code,<br />
should be more widespread. There are often significant savings to be made for<br />
the farmers, alongside the environmental opportunities. The smaller the farm units,<br />
the simpler the estimations required. These me<strong>as</strong>ures are obvious candidates for<br />
the national statutory me<strong>as</strong>ures to meet WFD requirements for controlling diffuse<br />
pollution.<br />
Even-handedness Across Rural Sectors<br />
It is important that an even-handed approach is taken, and seen to be taken, in<br />
regulating pollution risks. That h<strong>as</strong> been achieved in CAR for the regulation of<br />
surface water discharges from the built environment, which includes steadings,<br />
forestry offices and depots, golf courses and everything else that involves buildings,<br />
yards, roads roof are<strong>as</strong>, etc. Surface water discharges are authorised by GBRs 10<br />
and 11, <strong>as</strong> noted above and that applies across all sectors in Scotland.<br />
Under the infield me<strong>as</strong>ures discussed above, a simple GBR approach for farming<br />
w<strong>as</strong> also outlined, and reference made to the recent consultation by the Scottish<br />
Executive.<br />
A simple GBR approach for forestry would be e<strong>as</strong>y to devise, in direct consultation<br />
with forestry interests and at-risk environmental sectors such <strong>as</strong> fisheries and nature<br />
conservation interests. Scotland is soon to be a net exporter of timber, with potential<br />
risks to the trophic status of oligotrophic waters, <strong>as</strong> well <strong>as</strong> the spawning grounds<br />
of migratory fish.<br />
Cost Recovery Challenges: GBRs, Registrations or Licences?<br />
A subsistence charge could be attached to registrations, and certainly to licences,<br />
to enable SEPA to recover the cost of regulation. For non-registered GBRs, what<br />
are those costs likely to be? Direct funding for SEPA by central government for<br />
activity to manage diffuse pollution is likely to continue to be essential. In Canada,<br />
on the spot fines can be imposed by regulators for minor water pollution offences;<br />
198
ecourse to the law courts would only be for non-payment, at le<strong>as</strong>t for initial offences<br />
that are subsequently adequately resolved. How might this work in Scotland? First<br />
inspection visit could be at no charge; if anything is found to be in breach of GBR,<br />
then a letter would be sent to the farmer or forester or whoever, warning that if not<br />
corrected within a re<strong>as</strong>onable time (to be determined), an on-the-spot fine may be<br />
imposed. An enforcement procedure would be set out and farmers would be sent<br />
bills for payment, with risk of court action for non-payment. The size of the fine<br />
could be set at the cost to SEPA for the average time for two farm visits? N.B. this<br />
is not currently envisaged in regulatory options for Scotland. Precedents exist in<br />
Scotland, for example in relation to control of litter by local authorities, but not for<br />
work by SEPA. The idea is to have smaller fines in line with the environmental risk<br />
of the individual misdemeanour, yet still have some regulatory option to encourage<br />
best practice.<br />
However, there is a wider issue of funding the inspection and promotion of good<br />
practice in the rural sector, including monitoring <strong>as</strong>sociated environmental quality.<br />
SEPA recovers <strong>as</strong> much of the costs of regulation <strong>as</strong> possible from the major point<br />
source discharges such <strong>as</strong> municipal sewage and process effluents from industry.<br />
SEPA is fully stretched servicing these few thousand such discharges; how will<br />
it recover inspection and enforcement action for the hundreds of thousands of<br />
individually minor sources that together can seriously influence water quality? The<br />
collection of subsistence charges from some rural businesses, or on the spot fines<br />
to cover necessary enforcement, will not be sufficient to fund pro-active campaigns<br />
and educational partnership initiatives <strong>as</strong> part of catchment management planning.<br />
Diffuse pollution is already a major driver for catchment planning projects in Scotland<br />
(SEPA, 2004b).<br />
For agriculture, it is sensible for all the government-funded agencies whose field<br />
officers visit farms to collaborate:<br />
a) to ensure consistent messages are conveyed to farmers, and<br />
b) with its farm visits, SEPA can fulfil its regulatory duties by undertaking an audit<br />
role of the uptake of good practice and risk to the environment.<br />
While delivery of the message to the sector may be primarily by the sector-b<strong>as</strong>ed<br />
partners in such a scenario, SEPA would have to continue to play an ever more proactive<br />
role in joint training for agricultural advisors if such a light touch for regulatory<br />
action is to be considered and likely to be effective.<br />
CONCLUSIONS<br />
Regulating rural diffuse pollution presents SEPA with many challenges and<br />
opportunities. With the introduction of WFD legislation and CAR there is an opportunity<br />
to take a fresh look at the means by which this is undertaken. One of the greatest<br />
challenges will come in relation to effectively enforcing pollution-sensitive land-use<br />
decision-making. Promotion of best practice will continue to be the standard means<br />
of diffuse pollution control from rural are<strong>as</strong>. However, the expense of educational<br />
(e.g. catchment b<strong>as</strong>ed) initiatives is the hidden cost of light touch regulation: the<br />
regulated sectors need to be told about the GBRs for example, <strong>as</strong> well <strong>as</strong> about<br />
how to comply with them. At present central government funding to the agency<br />
199
is the only mechanism identified for SEPA’s costs. Working closely with others in<br />
government and the rural sector offers cost effective ways to minimise costs <strong>as</strong> well<br />
<strong>as</strong> regulatory burdens.<br />
ACKNOWLEDGEMENTS<br />
Thanks to Dave Gorman, Jannette MacDonald and Lynda Gairns in SEPA and<br />
Dave Merrilees of SAC, for looking at drafts of the paper and offering constructive<br />
comments. This is a discussion paper, so opinions expressed herein are those of<br />
the individual authors and do not necessarily represent corporate views of their<br />
employers.<br />
REFERENCES<br />
Bhamidimarri R, Edwards A, D’Arcy BJ and Gairns L (in preparation). Design<br />
considerations for constructed farm wetlands.<br />
Campbell NS, D’Arcy BJ, Frost CA, Novotny V and Sansom AL (2004). Diffuse<br />
Pollution – An Introduction to the Problems and the Solutions. IWAP, London.<br />
Clayden I (2006). Delivering environmental benefits through land management<br />
contracts. In: Agriculture and Environment VI: Managing Rural Diffuse Pollution.<br />
Proceedings of the SAC and SEPA Biennial Conference, 5–6 April 2006, Edinburgh.<br />
D’Arcy BJ (2005). Diffuse dilemm<strong>as</strong>: meeting the pollution challenge. In: Water 21,<br />
December 2005, pp 38-40. IWAP, London.<br />
D’Arcy BJ and Frost CA (2001). The role of best management practices in alleviating<br />
water quality problems <strong>as</strong>sociated with diffuse pollution. The Science of the Total<br />
Environment 265, 359–367.<br />
Davies B (2006). Carrots, Sticks, Sermons or Hugs? Designing Co-ordinated Policy<br />
Me<strong>as</strong>ures for the Uptake of Environmental Management Options. In: Agriculture<br />
and Environment VI: Managing Rural Diffuse Pollution. Proceedings of the SAC and<br />
SEPA Biennial Conference, 5–6 April 2006, Edinburgh.<br />
Edwards AC et al. In preparation for Journal of Environmental Management.<br />
Scottish Executive (2005) Diffuse Water Pollution from Rural land Use. Scottish<br />
Executive Environment Group Paper 2005/35. Scottish Executive, Edinburgh.<br />
SEPA (2004a). A strategy for the control of diffuse pollution. Unpublished Technical<br />
report of the Scottish Environment Protection Agency; Diffuse Pollution Initiative<br />
report no. DPI 20. SEPA, Stirling.<br />
SEPA (2004b). Catchment management and diffuse pollution in Scotland. A review<br />
of partnership projects with particular regard to diffuse pollution. Unpublished<br />
Technical report of the Scottish Environment Protection Agency; Diffuse Pollution<br />
Initiative report no. DPI 23. SEPA, Stirling.<br />
200
THE FARM SOILS PLAN<br />
R Audsley<br />
SAC, Auchincruive, Ayr, KA6 5HW, UK, E-mail: Rebecca.Audsley@sac.co.uk<br />
SUMMARY<br />
The Farm Soils Plan (FSP) is a guidance booklet targeted at all farmers across<br />
Scotland. It aims to highlight various soil issues that could benefit both the farm<br />
business and surrounding environment. The FSP will help farmers comply with<br />
GAEC (Good Agricultural and Environmental Condition) under Cross Compliance<br />
and outlines soil management practices that will help to reduce the risk of diffuse<br />
pollution from farmland. The FSP follows on from the successful ‘4 Point Plan’ (www.<br />
sac.ac.uk/4pp) that helped livestock farmers identify and reduce the risk of diffuse<br />
pollution from agricultural activities.<br />
The FSP contains b<strong>as</strong>ic guidance on a range of topics. It also lists contact addresses<br />
and websites that could act <strong>as</strong> a starting point for farmers looking for further<br />
information about alternative practices or new technologies. The main sections in<br />
the pack include:<br />
• Recognising and rectifying poor soil conditions – highlights some common<br />
problems seen on Scottish soils and suggests possible solutions.<br />
• Reducing soil erosion – minimising soil loss could avoid expensive re-seeds and<br />
remediation work while also protecting surrounding water quality.<br />
• Targeting nutrient application – matching nutrient application to crop demand<br />
and taking account of nutrients from slurry and manure applications can help to<br />
reduce nutrient loss and make better use of bagged fertiliser applications.<br />
• Preventing soil loss and protecting water quality – benefits both the farm business<br />
and the surrounding environment.<br />
• GAEC checklist – non-compliance with GAEC could result in financial penalties<br />
under the Single Farm Payment Scheme.<br />
• Field Notes – a reminder for farmers on how to hand texture soils to indicate<br />
the texture cl<strong>as</strong>s and suggests ways to identify any problems visible in the soil<br />
profile.<br />
During development of the plan, soil specialists and farm advisers were invited<br />
to comment on the document. Once near to completion, a group of farmers w<strong>as</strong><br />
also <strong>as</strong>ked to give comments and suggestions prior to publication. The feedback<br />
from the farmer group suggested that the FSP w<strong>as</strong> a useful guide to identifying soil<br />
problems that may have previously gone unnoticed such <strong>as</strong> over-compaction or the<br />
formation of a plough pan and also provided a useful reminder of general soil issues,<br />
confirming that they are doing the right things.<br />
The FSP is a joint initiative supported by SAC, SEERAD (Scottish Executive<br />
Environment and Rural Affairs Department), SNH (Scottish Natural Heritage), WWF<br />
(Scotland) (funded through HSBC), SEPA (Scottish Environment Protection Agency),<br />
NFU Scotland (National Farmers Union) and FWAG Scotland (Farming and Wildlife<br />
Advisory Group).<br />
201
PHOSPHORUS STORAGE IN FINE CHANNEL BED<br />
SEDIMENTS<br />
DJ Ballantine 1a , DE Walling 1 , AL Collins 2b and GJL Leeks 2<br />
1<br />
Department of Geography, University of Exeter, Exeter, EX4 6RJ, UK, E-mail:<br />
Deborah.Ballantine@sepa.org.uk; 2 Centre for Ecology and Hydrology, Wallingford,<br />
Oxfordshire, OX10 8BB, UK; a Present address: SEPA, Carseview House, C<strong>as</strong>tle<br />
Business Park, Stirling, FK9 4SW, UK; b Present address: ADAS, Woodthorne, Wergs,<br />
Wolverhampton, WV6 8TQ, UK<br />
SUMMARY<br />
Deposition and storage of fine sediment on channel beds represent an important<br />
component of a catchment’s sediment budget and can have implications for<br />
sediment-<strong>as</strong>sociated phosphorus fluxes and concentrations through water-sediment<br />
interactions. Spatial and temporal variations in the phosphorus content and storage<br />
in fine bed sediment have been studied in two UK lowland catchments, the Rivers<br />
Frome and Piddle in Dorset. Fine bed sediment w<strong>as</strong> sampled in representative<br />
reaches on a bi-monthly b<strong>as</strong>is using a re-suspension cylinder, and the resulting<br />
samples were analysed for total phosphorus, a range of phosphorus fractions<br />
and particle size. The results demonstrate the spatial and temporal variability of<br />
sediment-<strong>as</strong>sociated phosphorus concentrations and storage, with maximum<br />
and minimum phosphorus concentrations and storage occurring in late summer<br />
and winter respectively. Temporal variations in concentrations reflect residence<br />
times of the sediment and ambient phosphorus concentrations, while variations in<br />
storage are mainly due to hydrological regimes. Spatial variations reflect catchment<br />
characteristics and the location of inputs. Overall, the study highlights the need to<br />
consider both spatial and temporal controls on phosphorus storage <strong>as</strong>sociated with<br />
fine channel bed sediments.<br />
202
RED, AMBER AND GREEN FOR THE NEW PEPFAA<br />
CODE<br />
C Christian 1 , R Audsley 2 and AH Sinclair 3<br />
1<br />
SAC Environmental, Bush Estate, Penicuik, EH26 0PH, UK, E-mail: carole.christian@<br />
sac.co.uk; 2 SAC Farm Business Services, Auchincruive, Ayr, KA6 5HW, UK; 3 SAC<br />
Environmental, Craibstone Estate, Aberdeen, AB21 9YA, UK<br />
SUMMARY<br />
A revised PEPFAA (Prevention of Environmental Pollution from Agricultural Activity)<br />
Code w<strong>as</strong> launched in March 2005 (Scottish Executive, 2005). A shortened version<br />
called the PEPFAA Do’s and Don’ts Guide (Scottish Executive, 2004) h<strong>as</strong> been<br />
sent to all agricultural holdings in Scotland in the hope that it will be referred to on<br />
a regular b<strong>as</strong>is in the workplace. The purpose of the Code is to provide practical<br />
guidance on minimising the risks of environmental pollution from farming operations.<br />
A new feature is the Red, Amber and Green highlighted text. The points highlighted in<br />
Red are mandatory for all farm businesses affected by the relevant legislation, Amber<br />
are a requirement for receipt of the Single Farm Payment, and Green are voluntary<br />
but if implemented will help minimise the risk of environmental pollution. There is<br />
considerable emph<strong>as</strong>is placed on planning, <strong>as</strong> well <strong>as</strong> keeping records to show that<br />
the planning h<strong>as</strong> been implemented.<br />
DIFFUSE AGRICULTURAL POLLUTION<br />
A revised PEPFAA Code w<strong>as</strong> launched in March 2005 (Scottish Executive, 2005). The<br />
section on Diffuse Agricultural Pollution h<strong>as</strong> incre<strong>as</strong>ed in importance. Although water<br />
quality in Scotland is generally good, the Scottish Environmental Protection Agency<br />
(SEPA) considers that diffuse agricultural pollution is now the most significant cause<br />
of poor river quality in certain parts of Scotland and that it will continue to be so unless<br />
appropriate action is taken at individual farm and catchment level to turn the situation<br />
around. Activities such <strong>as</strong> ploughing, seedbed preparation, crop spraying, fertiliser<br />
spreading and applying slurry may all contribute to diffuse pollution if inappropriately<br />
carried out. Run-off after rainfall from farm roads and yards, the surface of fields,<br />
and dirty roofs are all potential sources of diffuse pollution. Such pollution tends<br />
to arise over wide are<strong>as</strong> of land making it difficult to control. The key to preventing<br />
diffuse pollution by nitrate is to ensure that all inputs are carefully accounted for and<br />
that applications are not made in excess of the requirements of the growing crop.<br />
Preparation and implementation of a nitrogen management plan are mandatory (a<br />
Red highlight) on farms within designated Nitrate Vulnerable Zones (NVZs). This N<br />
plan is recommended <strong>as</strong> best practice from a cost-efficient and environmental point<br />
of view for all farms spreading organic or inorganic inputs onto land, and involves<br />
a Manure Management Plan (also known <strong>as</strong> a Farm W<strong>as</strong>te Management Plan or<br />
FWMP) on livestock farms.<br />
SOIL PROTECTION AND SUSTAINABILITY<br />
One <strong>as</strong>pect of Cross Compliance, and a condition of receipt of the Single Farm<br />
Payment, is a requirement to maintain the land in ‘Good Agricultural and Environmental<br />
Condition’ (GAEC). GAEC standards relate to soil erosion, soil organic matter, soil<br />
203
structure and minimum level of maintenance. Good soil management practices will<br />
help ensure that the requirements of GAEC are met. Amber requirements include<br />
‘All cropped land over the following winter must, where soil conditions after harvest<br />
allow, have either: crop cover, gr<strong>as</strong>s cover, stubble cover, ploughed surface or a<br />
roughly cultivated surface’ and ‘Fine seedbeds must only be created very close to<br />
sowing’. Good soil management also plays a significant role in minimising diffuse<br />
pollution.<br />
LIVESTOCK SLURRIES AND MANURES<br />
There are important, new, good practices highlighted in the section on The Collection,<br />
Storage and Application to Land of Livestock Slurries and Manures. An Amber<br />
requirement is to ‘incorporate livestock manures within 2 weeks after spreading on<br />
stubbles’. All livestock farms should have a FWMP.<br />
‘The 4 Point Plan’ (SEERAD et al., 2004) is highlighted for the first time in a main<br />
PEPFAA Code. This Plan is aimed at livestock farmers and provides guidance on:<br />
• minimising dirty water around the steading,<br />
• better nutrient use,<br />
• risk <strong>as</strong>sessment for manures, and<br />
• managing water margins.<br />
4 Point Plans <strong>as</strong>sess manure and dirty water volumes, storage conditions, steading<br />
discharges and clean water contamination and can form the b<strong>as</strong>is of a full FWMP. A<br />
full Risk Assessment for Manure and Slurry (RAMS) is part of the FWMP. This involves<br />
an examination and soil survey of each field in order to identify their suitability for<br />
receiving organic manures and slurries. Risk b<strong>as</strong>ed on soil, land, gradient, farming<br />
and climatic factors will be identified and mapped.<br />
ACKNOWLEDGEMENTS<br />
The PEPFAA Code is produced by the Scottish Agricultural Pollution Group<br />
comprising SEERAD, SEPA, NFUS and SAC. SAC receives financial support from<br />
Scottish Executive Environment and Rural Affairs Department.<br />
REFERENCES<br />
Scottish Executive (2004). Prevention of Environmental Pollution from Agricultural<br />
Activity: Dos and Don’ts Guide. Scottish Executive Publication, Edinburgh.<br />
Scottish Executive (2005). Prevention of Environmental Pollution from Agricultural<br />
Activity: A Code of Good Practice. Scottish Executive Publication, Edinburgh.<br />
SEERAD, SEPA, SAC, NFUS, SNH, WWF, FWAG and BOC (2004). The 4 Point Plan.<br />
Straightforward guidance for livestock farmers and contractors to minimise pollution<br />
and benefit your business. The Stationery Office, Edinburgh, Ref 03/2004.<br />
204
ESTIMATING DIFFUSE PHOSPHORUS LOADS TO<br />
LAKES: IMPLICATIONS FOR THE CALCULATION OF<br />
TOTAL MAXIMUM DAILY LOADS<br />
LH Defew<br />
Centre for Ecology and Hydrology, Bush Estate, Penicuik, Midlothian, EH26 0QB,<br />
UK, E-mail: ldef@ceh.ac.uk<br />
SUMMARY<br />
Nutrients and the concentrations in which they are present within a water body<br />
are important factors regulating the growth of phytoplankton and other plants.<br />
Problematic overgrowth of these is generally recognised <strong>as</strong> the biological<br />
manifestation of eutrophication and poor water quality, often resulting in hypoxia,<br />
loss of biodiversity, fish kills, and rele<strong>as</strong>e of algal toxins in the water body. As many<br />
freshwater environments are considered to be phosphorus limited, controlling and<br />
regulating the input of this particular nutrient is often one of the targets set under the<br />
total maximum daily load (TMDL) management approach.<br />
A TMDL is the sum of the allowable loads of a single pollutant from all contributing<br />
point and non-point (diffuse) sources, including natural background levels. The major<br />
steps in the American TMDL initiative are: (1) to develop load calculations for nonpoint<br />
sources of pollution; (2) to calculate natural loads; (3) to calculate maximum<br />
total loads from all sources; and (4) to determine how to reduce the maximum load<br />
in order to meet water-quality standards. A key requirement of this approach is the<br />
determination of accurate and reliable pollutant loads to the receiving water from<br />
non-point sources.<br />
Many of the methods that are currently being developed in the UK to <strong>as</strong>sess nutrient<br />
inputs to lakes from non-point sources are b<strong>as</strong>ed on data collected at weekly, monthly<br />
or even quarterly intervals. Previous studies have shown that such infrequent data<br />
collection results in pollutant load estimates that are of low accuracy and precision<br />
(Webb et al., 1997; Soerens and Nelson, 2001). There is now mounting evidence<br />
(e.g. May et al., 2005) that calculations b<strong>as</strong>ed on such data may underestimate the<br />
pollutant load to water bodies from diffuse sources by up to 80%. This is because<br />
they fail to take account of the influence of storm events on the mobilisation and<br />
transport of pollutants. The method used to estimate the nutrient loading to a lake<br />
will have important implications to the final TMDL that is calculated. To be reliable,<br />
TMDLs must take into account the impact of high intensity, low frequency rainfall<br />
events on nutrient loadings to water bodies.<br />
205
REFERENCES<br />
May L, Place C, O’Hea B, Lee M, Dillane M and McGinnity P (2005). Modelling soil<br />
erosion and transport in the Burrishoole catchment, Newport, Co. Mayo, Ireland.<br />
Freshwater Forum 23, 139-154.<br />
Soerens TS and Neilson MA (2001). Designing Stream Sampling Schemes for Load<br />
Determination. In: Warwick, J. J. (Ed) AWRA Annual Spring Speciality Conference<br />
Proceedings. Water Quality Monitoring and Modelling. American Water Resources<br />
Association, Middleburg, Virginia, TPS-01, pp 71-76.<br />
Webb BW, Phillips JM, Walling DE, Littlewood IG, Watts CD and Leeks GJL (1997).<br />
Load estimation methodologies for British rivers and their relevance to the LOIS<br />
RACS programme. The Science of the Total Environment, 194-195, 379-389.<br />
206
SEDIMENT LOADS AND SOURCES IN THE BUSH<br />
CATCHMENT: A MOVE TOWARDS INFORMED<br />
MANAGEMENT STRATEGIES<br />
D Evans 1 * and C Gibson 2<br />
1<br />
Aquatics Section, Department of Agriculture and Environmental Sciences,<br />
Queen’s University Belf<strong>as</strong>t, Newforge Lane, Belf<strong>as</strong>t, BT9 5PX, UK; 2 Agricultural and<br />
Environmental Science Division, Department of Agriculture and Rural Development,<br />
Newforge Lane, Belf<strong>as</strong>t, BT9 5PX, UK; *Current presenting/correspondence author<br />
address: Dr D J Evans, Atkins Limited, Chadwick House, Birchwood Science Park,<br />
Warrington, Cheshire, WA3 6AE, UK, E-mail: dan.evans@atkinsglobal.com<br />
SUMMARY<br />
A decline in the survival of salmon from ova to smolt had been reported in the River<br />
Bush, Northern Ireland, due partly to habitat degradation. A monitoring programme<br />
w<strong>as</strong> initiated at four study sites on the river in order to promote improved sediment<br />
management at the catchment scale. Bed and suspended sediment loads were<br />
quantified leading to the identification of specific grain types and transport events<br />
contributing to the sedimentation of salmon spawning redds. Temporal and spatial<br />
variations were recorded in fine sediments transported through the channel in<br />
suspension (median value range 26.4–448 kg per week) and along the bed (median<br />
value range 0.214–9.55 kg per week). The resulting data indicated that lower parts<br />
of the river suffered form a relatively high sediment load. This poster also reports<br />
on supplementary work aimed at cl<strong>as</strong>sifying the sources of these sediments in the<br />
catchment. A combination of visual observations, GIS erosion potential maps and<br />
bank erosion monitoring were used to <strong>as</strong>sess large-scale sediment processes and<br />
guide more detailed study. For instance, bank erosion w<strong>as</strong> highest in regions of<br />
the catchment with the le<strong>as</strong>t cohesive bank materials during high flow conditions<br />
(e.g. mean of 38.1 mm per storm at Magherahoney). These data targeted specific<br />
sites where sediment fingerprinting techniques were applied to elucidate the link<br />
between soil erosion in the Bush catchment and downstream sediment delivery<br />
to the four instream study sites. Livestock poaching and peak flows exacerbated<br />
damage to banks at a localised scale and led to selective patches of bare land being<br />
susceptible to further erosion, augmenting the sediment load (approximately 2%<br />
of the suspended sediment load and 60% of the bed load). Drainage maintenance<br />
work (60% and 30%, respectively), forest clearfell (1% and 2%, respectively) and<br />
ploughed land (37% and 8%, respectively) were also shown to influence the quantity<br />
of sediment transported through the study channels. Information generated from<br />
the sediment source <strong>as</strong>cription process w<strong>as</strong> transferred into a scientifically justified<br />
plan aimed at reducing fine sediment transport in the Bush catchment. Nine key<br />
actions were suggested in order to improve habitat quality in the River Bush. These<br />
included wetland restoration, prohibiting drainage maintenance work, strategies to<br />
control conifer plantation felling, reducing bare ground, livestock access restrictions,<br />
construction site management, systematic macrophyte clearance, employment of<br />
a river warden and systematic dissemination of project recommendations to the<br />
general public to generate community involvement. Above all, this work h<strong>as</strong> showed<br />
that effective catchment management h<strong>as</strong> to be steered by detailed sediment budget<br />
information.<br />
207
LOUND CATCHMENT PROJECT: WORKING WITH<br />
STAKEHOLDERS TO DELIVER BENEFITS FOR WATER<br />
AND WILDLIFE<br />
HG Gray 1 and C Lorenc 2<br />
1<br />
Broads Authority, PO Box 118, Lowestoft, Suffolk NR32 5NT, UK, E-mail: hannah.<br />
gray@broads-authority.gov.uk; 2 Essex & Suffolk Water, Hall Street, Chelmsford,<br />
Essex, CM2 0HH, UK<br />
SUMMARY<br />
Engaging the local community is at the heart of the Lound Project. The Project w<strong>as</strong><br />
started in October 2004 <strong>as</strong> a partnership between the Broads National Park Authority<br />
and Essex and Suffolk Water (ESW) to try to tackle diffuse pollution at source. It is<br />
focussed on the relatively small, rural catchment (30 km2) of shallow lakes on the<br />
Norfolk-Suffolk border, from which ESW abstracts water for public supply. It h<strong>as</strong><br />
four aims:<br />
• To incre<strong>as</strong>e understanding of catchment hydrology and improve water quality;<br />
• To manage the land owned by ESW to incre<strong>as</strong>e biodiversity;<br />
• To build closer working relationships with farmers and landowners in the<br />
catchment, in order to encourage environmentally sensitive land management;<br />
• To involve and include the site users and the local community through access,<br />
education and volunteering opportunities.<br />
Perhaps the most challenging <strong>as</strong>pect h<strong>as</strong> been building relationships with farmers<br />
in the catchment surrounding the Lound lakes. Visits to some of these farmers<br />
suggested a lack of understanding about how farming practices can affect water<br />
quality. Diffuse pollution, in particular nitrate, phosphate and sediment, is a major<br />
problem all over the Norfolk and Suffolk Broads. The National Park Authority is<br />
working to raise awareness of the issue with farmers and provide solutions that are<br />
practicable. The Lound Project is doing this through a variety of methods, including<br />
farm visits, advisory leaflets and workshops for farmers. These tools attempt to<br />
advise farmers directly on issues such <strong>as</strong> soil management and efficient fertiliser use,<br />
and to encourage farmers to opt into new government Environmental Stewardship<br />
schemes.<br />
The Lound Project Officer undertakes regular monitoring of water quality, in<br />
particular nutrients such <strong>as</strong> nitrate and phosphate that largely come from agriculture<br />
in the Lound catchment. Although any change in farm practices in the surrounding<br />
catchment will take many years to have an impact on water quality, the sooner these<br />
changes are started, the sooner the benefits will be seen. This year the Project is<br />
working closely with the Somerleyton estate who own Fritton Lake, a significant<br />
visitor attraction located in the Lound catchment, to find ways of improving water<br />
quality to reduce algal blooms - something which will benefit tourism, public water<br />
supply, and aquatic wildlife.<br />
208
On a smaller scale, the Project is managing the land adjacent to the reservoirs, owned<br />
by ESW, to promote biodiversity. The meadows and fen are managed through a<br />
DEFRA Countryside Stewardship Scheme. Woodland are<strong>as</strong> are being managed<br />
for wildlife with the help of a volunteer group established this year. This includes<br />
coppicing, creating glades and hedge laying. Local residents make good use of the<br />
public footpaths across the site, and the Project is keen to promote responsible<br />
access and <strong>as</strong>sociated infr<strong>as</strong>tructure.<br />
All of these me<strong>as</strong>ures, and more, feature in the Catchment Management Plan, written<br />
in 2005, which sets out the vision for the Lound Project and how it will be achieved.<br />
209
MINIMISING THE PRESSURES AND IMPACTS ON<br />
FRESHWATER FROM AGRICULTURE IN THE UPPER<br />
BALLINDERRY RIVER SAC<br />
M Horton and A McGarel<br />
Ballinderry Fish Hatchery Ltd, Orritor Road, Cookstown, Co Tyrone, Northern Ireland,<br />
E-mail: mhorton@bfhltd.wanadoo.co.uk<br />
SUMMARY<br />
With funding from HSBC and EHS, WWF h<strong>as</strong> established the Ballinderry River<br />
Enhancement Project in partnership with Ballinderry Fish Hatchery. It aims to<br />
identify and reduce the causes of deteriorating water quality within one of the river’s<br />
tributaries.<br />
The tributary displays a variety of pollution pressure points with detectable impacts<br />
on water quality. Agriculture is one of the main sources, and me<strong>as</strong>ures to reduce its<br />
impact have been considered.<br />
Pollution reduction is being achieved through encouraging better uptake of agrienvironment<br />
schemes and water protection me<strong>as</strong>ures and providing knowledge and<br />
incentives to farm to higher environmental standards.<br />
Low-cost solutions to reduce the risk of pollution are also being developed and<br />
tested on a demonstration farm in the catchment. Management practices being<br />
adopted include the separation of clean and dirty water, secure storage and handling<br />
of dirty water and farmyard w<strong>as</strong>te, water conservation and efficient application of<br />
organic and inorganic fertilisers.<br />
210
A FRAMEWORK FOR VALUING THE HEALTH BENEFITS<br />
OF IMPROVED BATHING WATER QUALITY IN THE RIVER<br />
IRVINE CATCHMENT<br />
EK Johnson 1 , D Moran 2 and AJA Vinten 3<br />
1<br />
592 Quail Court Kingston, Ontario, K7M 8Z3, Canada, E-mail: elaine_k_johnson@<br />
hotmail.com; 2 Land Economy and Environment Research Group, SAC, West Mains<br />
Road, Edinburgh EH6 5AT, UK; 3 Macaulay Land Use Research Institute, Craigiebuckler,<br />
Aberdeen, AB15 8QH, UK<br />
SUMMARY<br />
A model predicting bathing water concentrations of Escherichia coli from livestock<br />
in the Irvine catchment h<strong>as</strong> been adapted for faecal streptococci (FS). This h<strong>as</strong> been<br />
used to predict risk of bather illness by extrapolation of published data on bather FS<br />
exposure vs. incidence of g<strong>as</strong>tro-enteritis. Simulated reduction in the risk of illness<br />
by reduced faecal loading w<strong>as</strong> multiplied by a willingness to pay for risk reduction<br />
to estimate the annual benefits of mitigation. Benefits of reducing loading by 95% at<br />
Irvine Beach were about £600 k pa. Estimated annualised costs of best management<br />
practises (BMPs) across the catchment were higher (> £1 m), and it is very unlikely<br />
that 95% mitigation is achievable with current stocking rates. However, more work<br />
on calibration and validation of this framework is needed.<br />
INTRODUCTION<br />
Current research is exploring applications of BMPs which reduce agriculture’s<br />
contribution of faecal bacteria to co<strong>as</strong>tal bathing waters. An economic incentive<br />
is required for implementation of these me<strong>as</strong>ures. This paper presents a draft<br />
framework for valuing the health benefits to society of reducing faecal loading to<br />
bathing waters which may be achieved through BMP implementation. By relating<br />
a BMP-induced reduction in faecal loading to a decre<strong>as</strong>e in risk of illness, benefits<br />
can be calculated using an estimate of society’s willingness to pay for reduction in<br />
swimming-<strong>as</strong>sociated illness.<br />
MODEL FRAMEWORK<br />
Three components were involved in evaluating reduced faecal loading in the<br />
Irvine catchment in Ayrshire (Figure 1). These will subsequently be linked to cost/<br />
effectiveness of mitigation.<br />
Predict<br />
Bathing Water<br />
Quality<br />
Relate Bathing<br />
Water Quality to<br />
Risk of Illness<br />
Determine Value of<br />
Reduced Faecal<br />
Loading<br />
Justification of BMPs???<br />
Figure 1: Steps involved in determining the value of faecal loading reductions<br />
in the Irvine catchment<br />
211
Predicting Bathing Water Quality<br />
Vinten et al. (2004) devised a spreadsheet model to predict E. coli in bathing water<br />
by accounting for inactivation, sedimentation, transport and mixing in the Irvine<br />
Beach/River Irvine catchment system for various loading in the catchment. We have<br />
modified this model so FS levels in bathing waters could be predicted rather than<br />
E. coli, using changes to key parameter values, summarised in Table 1. The relative<br />
levels in animal faeces and inactivation factors show considerable variation in the<br />
literature, so these figures should only be considered indicative at this stage.<br />
Table 1:<br />
Correction factors used with the model of Vinten et al. (2004) to<br />
predict FS concentrations in bathing water instead of E. coli<br />
Parameter<br />
Correction factor for<br />
FS/E. coli<br />
References<br />
Levels in animal faeces 5.6 Sinton et al., 1993 Reddy<br />
et al., 1981<br />
Half lives in soil and water 0.7 Sherer et al., 1992 in<br />
Merrilees, 2004<br />
Bathing water quality predictions were made for current and 25–95% reduction in<br />
livestock loadings. Summer discharge percentiles were calculated using 14 years<br />
(1989-2002) of River Irvine data.<br />
Bathing Water Quality and Risk of Illness<br />
A dose–response function between the concentration of FS in bathing water and the<br />
probability of contracting g<strong>as</strong>tro-enteritis w<strong>as</strong> determined by Kay et al. (1994) and<br />
Wyer et al. (1999), b<strong>as</strong>ed on risk of contracting illness from bathing water quality<br />
determined by the World Health Organization using a probability density function<br />
of bathing water quality throughout Europe (WHO, 2001). This relationship h<strong>as</strong> data<br />
for up to 12% probability of infection, and these data were fitted to an exponential<br />
function (eq. 1) to predict risk of illness, including extrapolation where necessary<br />
beyond the data range.<br />
-<br />
Risk of illness = 1-<br />
e 0. 000218c<br />
(1)<br />
Where c = concentration of FS in bathing water (cfu/100mL).<br />
This equation w<strong>as</strong> linked to model simulations of FS in bathing water to give the risk<br />
of contracting g<strong>as</strong>tro-enteritis <strong>as</strong> a function of faecal loading and river discharge<br />
(Step 2 in Figure 1).<br />
Economic Valuation of Reduced Risk of Illness<br />
Consumer willingness to pay (WTP) for a reduction in risk of illness resulting from<br />
swimming in contaminated waters w<strong>as</strong> determined using a benefit transfer of a<br />
contingent valuation used in a previous study in England and Wales (EFTEC, 2002).<br />
The EFTEC study determined consumers’ WTP for a reduction in risk of illness from<br />
swimming in contaminated bathing water. Valuations from the study indicate that<br />
respondents are willing to pay between £1.10 and £2.00 per household per year<br />
212
for a 1% reduction in the risk of suffering a stomach upset (EFTEC, 2002) and we<br />
<strong>as</strong>sumed a. WTP of £1.10 per 1% reduction in risk. For comparison with Scottish<br />
bathing waters, a direct unadjusted mean value w<strong>as</strong> used to determine the benefits<br />
of incre<strong>as</strong>ed bathing water quality resulting from the reduction in faecal loading in the<br />
Irvine catchment. The EFTEC study is a suitable comparative site for Irvine Beach<br />
because of similarities below listed in Table 2. The annual benefit accruing to Irvine<br />
Beach from reducing faecal loading w<strong>as</strong> calculated by accounting for the likelihood<br />
of high discharge events. Benefits were calculated at each percentile flow (above the<br />
72nd) for a range of reductions in loading from 25–95%.<br />
Table 2:<br />
Comparison of site characteristics between proposed Scottish<br />
benefit transfer and EFTEC WTP study in England and Wales<br />
England and Wales<br />
Scotland<br />
Environmental quality parameter Bathing water quality Bathing water quality<br />
Households 24,000,000 2,200,000<br />
Population 52,900,000 5,062,000<br />
Average household size 2.204 2.3<br />
Mean weekly household income £302 £296<br />
A spreadsheet model w<strong>as</strong> developed to determine the benefits accruing to society<br />
from incre<strong>as</strong>ed bathing water quality. Table 3 gives the equations used in the<br />
development of this model.<br />
Table 3:<br />
Parameters used to model social benefits from incre<strong>as</strong>ed bathing<br />
water quality<br />
Parameter Equation Components<br />
Risk of illness (1) · C = FS concentration in<br />
bathing water<br />
Risk of illness<br />
differences<br />
(2) · r full = risk of illness at full FS<br />
loading<br />
Social benefits<br />
at each<br />
discharge<br />
percentile<br />
Total annual<br />
benefits (TB)<br />
· r %reduction = risk of illness<br />
with reduction in loading<br />
(3) · WTP = household WTP to<br />
pay for risk reduction<br />
(4)<br />
· H = number of households<br />
· F = percentile flow.<br />
Lifetime<br />
benefits (LB) (5)<br />
· TB = future value (in year t)<br />
· i = interest rate<br />
213
Risk of illness percentages were calculated at various discharge percentiles for each<br />
loading reduction. The differences between risk of illness at full FS loading and the<br />
other loadings were determined. This accounts for the risk reduction expected by<br />
reducing FS loading.<br />
Benefits accruing to the population were calculated for each discharge percentile.<br />
These values were aggregated across all percentile flows and corrected for the<br />
frequency of occurrence to determine total annual benefits (TB). Because the<br />
entire Scottish population w<strong>as</strong> used, the total benefit value had to be corrected to<br />
elicit benefits occurring only at Irvine Beach. A 2004 study indicated that 3% of all<br />
Scottish beach visits were made to Irvine Beach (Scottish Executive Social Research,<br />
2004). The total benefits to Scotland were therefore multiplied by 3% to calculate<br />
the benefits at Irvine Beach. To calculate future benefits, discounting w<strong>as</strong> done to<br />
give the present value. This w<strong>as</strong> done on a 25-year timescale with a 6% interest<br />
rate in this study, <strong>as</strong> they are similar to values used in evaluating costs of agricultural<br />
infr<strong>as</strong>tructure and machinery.<br />
Using the above framework, benefits from reducing faecal loading were calculated<br />
for the River Irvine catchment. Irvine Beach is located in Ayrshire in the west of<br />
Scotland (Grid Reference: NS305375). Discharge data from SEPA for the River Irvine<br />
for 1989–2003 were used to determine summer flow percentiles.<br />
RESULTS AND DISCUSSION<br />
FS concentrations at Irvine beach simulated with the modifications of the Vinten<br />
et al. (2004) model are shown in Figure 2. Risk of illness w<strong>as</strong> determined for all<br />
loadings at various levels of discharge (Figure 3). Table 4 shows the annual benefit,<br />
and aggregated benefit over 25 years of improved bathing water quality at Irvine<br />
Beach.<br />
100000<br />
75 th 80 th 85 th 90 th Percentile Flow<br />
95 th<br />
BW Faecal Streptococc<br />
(cfu/100 mL)<br />
10000<br />
1000<br />
100<br />
10<br />
1<br />
C urrent loading<br />
25% reduction<br />
50% reduction<br />
75% reduction<br />
80% reduction<br />
85% reduction<br />
90% reduction<br />
95% reduction<br />
0 1 2 3 4 5<br />
Daily C atchment Discharge (mm/day)<br />
Figure 2: Predictions of faecal streptococci concentrations in bathing water<br />
at the Irvine Beach at various river Irvine scaled discharges<br />
214
Figure 3 shows that risk of illness is insignificant at all FS input rates below the<br />
75 percentile flow. During 95 percentile flow, faecal loading needs to be reduced<br />
by 95% to give a risk of illness < 20%. These figures depend on the reliability<br />
of the extrapolation used in eq. (1) for risk of illness, and improvement of the<br />
epidemiological datab<strong>as</strong>e for such modelling should be a research priority. There<br />
is also little information on the levels of FS in animals faeces, and literature data on<br />
inactivation suggest longer survival of FS than E. coli in soil (Cools et al., 2001) but<br />
higher sensitivity to sunlight (Sinton et al., 2002).<br />
100%<br />
75 th 80 th 85 th 90 th<br />
95 th Percentile<br />
80%<br />
Risk of Illness (%) .<br />
60%<br />
40%<br />
20%<br />
0%<br />
C urrent loading 25% reduction<br />
50% reduction 75% reduction<br />
80% reduction 85% reduction<br />
90% reduction 95% reduction<br />
0 1 2 3 4 5 6 7 8 9 10 11 12<br />
Daily C atchment Discharge (mm/day)<br />
Figure 3: Discharge and related risk of illness<br />
The WTP for avoidance of illness of BW improvement can now be compared with the<br />
costs of implementing BMPs to attempt to control diffuse pollution. Recent work h<strong>as</strong><br />
estimated the annual cost of installing BMPs on two farms in SW Scotland to be £3 k<br />
per farm plus £50 k capital cost (Merrilees, 2004). If we <strong>as</strong>sume an annualised capital<br />
cost of £10 k, and that across the River Irvine catchment there are about 70 farms,<br />
total annualised mitigation costs are (3 + 10) x 70 = £910 k. From Table 4 the required<br />
reduction of FS loading achieved needs to be > 95% to obtain a benefit/cost ratio<br />
which exceeds 1. BMPs to <strong>as</strong>sist in bathing water quality improvements include<br />
me<strong>as</strong>ures such <strong>as</strong> stock reduction, fencing, buffer strips, constructed wetlands,<br />
slurry storage, cattle access routes, and separating clean and dirty water. In practice<br />
achieving > 50% efficacy may be very difficult, particularly considering that BMP<br />
performance during high intensity flow events is critical. Dickson et al. (2005) found a<br />
40% reduction in high flow faecal indicator loadings where BMPs had been installed.<br />
If the entire Irvine catchment installed these practices, bathing waters may still pose<br />
a high risk of illness after storm events.<br />
215
Table 4:<br />
Expected lifetime benefits of reducing faecal loading in the Irvine<br />
catchment<br />
Reduction in faecal loading<br />
in the Irvine catchment<br />
Annual benefit<br />
(in £k)<br />
25% reduction £63 £868<br />
50% reduction £153 £2,103<br />
75% reduction £312 £4,300<br />
85% reduction £428 £5,897<br />
95% reduction £617 £8,509<br />
REFERENCES<br />
Aggregated benefits over<br />
25 years at a 6% discount<br />
rate (in £k)<br />
Cools D, Merckx R, Vl<strong>as</strong>sak K and Verhaegen J (2001). Survival of E.coli and<br />
Enterococcus spp. Derived from pig slurry in soils of different texture. Applied Soil<br />
Ecology 17, 3–62.<br />
Dickson JW, Edwards T, Jeffrey WA and Kay D (2005). Catchment scale appraisal<br />
of best management practices (BMPs) for the improvement of bathing water<br />
– Brighouse Bay. Report prepared for Scottish Environment Protection Agency<br />
(SEPA). Reference 230/4187. SAC Environmental: Edinburgh [Internet] Scottish<br />
Executive Environment.<br />
URL http://www.scotland.gov.uk/Topics/Environment/Water/15561/bathingwatpro<br />
[Accessed 15th February 2006].<br />
Economics for the Environment Consultancy Ltd (EFTEC) (2002). Valuation<br />
of Benefits to England and Wales of Revised Bathing Water Quality<br />
Directive and other Beach Characteristics Using the Choice Experiment<br />
Methodology. [Internet] Department for Environment, Food and Rural Affairs.<br />
URL http://www.defra.gov.uk/environment/water/quality/bathing/bw_study4.htm><br />
[Accessed 16 August 2005].<br />
Kay D, Fleisher JM, Salmon RL, Jones F, Wyer MD, Godfree AF, Zelenauch-Jacquotte<br />
Z and Shore R (1994). Predicting likelihood of g<strong>as</strong>troenteritis from sea bathing:<br />
results from randomised exposure. Lancet 344, 905–909.<br />
Merrilees DW (2004). Research and Design of Pilot Schemes to Minimise<br />
Livestock Pollution to the Water Environment in Scotland. Contract GLC 9/2. Final<br />
Report to the Scottish Executive. [Internet]. Scottish Executive Environment.<br />
URL http://www.scotland.gov.uk/Topics/Environment/Water/15561/pollutionmainreport<br />
[Accessed 10 August 2005].<br />
Reddy KR, Khaleel R and Overc<strong>as</strong>h MR (1981). Behaviour and transport of microbial<br />
pathogens and indicator organisms in soils treated with organic w<strong>as</strong>tes. Journal of<br />
Environmental Quality 10, 255–266.<br />
216
Scottish Executive Social Research (2004). Bathing water use in Scotland:<br />
TNS Travel and Tourism. [Internet]. Scottish Executive Research.<br />
URL http://www.scotland.gov.uk/Publications/2004/04/19210/35655<br />
[Accessed 22 August 2005].<br />
Sinton LW, Hall CH, Lynch PA and Davies-Colley RJ (2002). Sunlight inactivation of<br />
faecal indicator bacteria and bacteriophages from w<strong>as</strong>te stabilisation pond effluent<br />
in fresh and saline waters. Applied and Environmental Microbiology 68, 1122–1131.<br />
Vinten AJA, Lewis DR, McGechan M, Duncan A, Aitken M, Hill C and Crawford<br />
C (2004). Predicting the effect of livestock inputs of E. coli on microbiological<br />
compliance of bathing waters. Water Research 38, 3215–3224.<br />
World Health Organization (WHO) (2001). Bathing water quality and human health:<br />
faecal pollution. WHO, Geneva.<br />
Wyer MD, Kay D, Fleisher JM, Salmon RL, Jones F, Godfree AF, Jackson G and<br />
Rogers A (1999). An experimental health-related cl<strong>as</strong>sification for marine waters.<br />
Water Research 33, 715–722.<br />
217
DETERMINATION OF THE VETERINARY ANTIBIOTICS<br />
POLLUTION IN SOIL FROM AGRICULTURAL SOURCES<br />
M Kaštelan-Macan, S Babic, ć D Ašperger, D Mutavdžic ć and AJM Horvat<br />
Faculty of Chemical Engineering and Technology, Marulicev trg 20, 10000 Zagreb,<br />
Croatia, E-mail: mmacan@fkit.hr<br />
SUMMARY<br />
Emission of veterinary antibiotics h<strong>as</strong> emerged <strong>as</strong> an environmental problem and<br />
a lack of knowledge concerning this kind of pollution requires further investigation.<br />
The antibiotics primarily used in animal medicine are tetracyclines, sulfonamides,<br />
ß-lactames and fluoroquinolones. Antibiotics reach agricultural soils directly through<br />
livestock or indirectly through the use of manure and sewage sludge <strong>as</strong> fertilisers.<br />
The aim of this work w<strong>as</strong> to optimise the conditions for ultr<strong>as</strong>onic solvent extraction<br />
(USE) of the most commonly used antibiotics in Croatian veterinary practice:<br />
sulfamethazine, sulfadiazine, sulfaguanidine, norfloxacine, oxytetracyclin, penicillinG/<br />
procaine and trimethoprim from soil samples. Sonication provides a more efficient<br />
contact between the solid and solvent than cl<strong>as</strong>sic extraction procedures, resulting<br />
in a greater recovery of analyte. The extracted pesticides were identified using a<br />
thin-layer chromatography (TLC) system: HPTLC CN F 254<br />
chromatography plates <strong>as</strong><br />
a stationary ph<strong>as</strong>e, and 0.05 M oxalic acid/methanol=0.80:0.20 <strong>as</strong> a mobile ph<strong>as</strong>e.<br />
Quantification w<strong>as</strong> performed using a 3CCD colour video camera.<br />
INTRODUCTION<br />
In the p<strong>as</strong>t, the emission of so-called ‘emerging’ or ‘new’ contaminants h<strong>as</strong> emerged<br />
<strong>as</strong> an environmental problem and a lack of knowledge concerning this kind of<br />
pollution requires further investigation. Emerging contaminants are the unregulated<br />
ones, mainly composed of products used in everyday life, such <strong>as</strong> pharmaceuticals,<br />
personal care products, surfactants, pl<strong>as</strong>ticisers, industrial additives, etc. Many<br />
believe that of all the emerging contaminants, antibiotics are the biggest concern, <strong>as</strong><br />
their emission in the environment can result in an incre<strong>as</strong>ed occurrence of resistant<br />
bacteria in the environment, which may lead to unforeseen consequences.<br />
In veterinary medicine, a wide range of antibiotics are frequently used, and <strong>as</strong> a<br />
result of their consumption, excretion, and persistence, they are disseminated<br />
mostly via excrements and thus enter the soils. According to FEDESA, one-third<br />
of all antibiotics are used for veterinary purposes (FEDESA, 2001). No regulations<br />
exist for concentration limits of antibiotics in soils or water, but some EU directives<br />
prescribe the risk <strong>as</strong>sessment of veterinary antibiotics (EMEA, 1997).<br />
The antibiotics in primary use in animal medicine are tetracyclines, sulfonamides,ßlactames<br />
and fluoroquinolones. The main sources of their rele<strong>as</strong>e into the environment<br />
are animal farms and aquaculture for fish production.<br />
Antibiotics reach agricultural soils directly through livestock or indirectly through the<br />
use of manure and sewage sludge <strong>as</strong> fertilizers. Manure samples from pigs contained<br />
up to 3.5 mg/kg of sulfonamides and up to 4 mg/kg of tetracyclynes (Hamscher et<br />
al., 2002; Höper et al., 2002). Antibiotic residues and resistant micro-organisms can<br />
218
affect the natural soil community and also disturb soil function. In addition, it w<strong>as</strong><br />
found that w<strong>as</strong>tewater and run-off from agricultural land are mainly responsible for<br />
the contamination of aquatic systems (Alder, 2001).<br />
For this purpose, it w<strong>as</strong> necessary to establish a simple and reliable method for<br />
extraction, separation and determination of veterinary pharmaceuticals in soil. The<br />
drugs investigated included three sulfonamides (sulfaguanidine, sulfadiazine and<br />
sulfamethazine), sulfonamide synergist (trimethoprim), tetracycline (oxytetracycline),<br />
fluoroquinolone (norfloxacine) and b-lactam (penicillinG/procaine). In this contribution,<br />
we worked out the procedure using ultr<strong>as</strong>ound extraction (USE) of investigated<br />
compounds from soil, and their subsequent thin-layer chromatographic (TLC)<br />
determination.<br />
MATERIALS AND METHODS<br />
Materials<br />
All used chromatographic solvents were p.a. grade (Kemika, Zagreb, Croatia). In<br />
this work, chromatographic plates HPTLC CN F254 10 x 20 cm, (Merck, Darmstadt,<br />
Germany) were used. Soil w<strong>as</strong> collected at Medvednica, a hill near Zagreb. At<br />
le<strong>as</strong>t 10 years before collecting, the soil had not been treated with any antibiotics.<br />
Its composition w<strong>as</strong>: sand 61.45%, silt 20.75%, clay 11.80% and organic matter<br />
6.44%.<br />
Standards<br />
Trimethoprim (TMP), oxytetracycline (OTC), norfloxacine (NOR), sulfaguanidine<br />
(SGUA), sulfamethazine (SMETH), sulfadiazine (SDIAZ) and penicillinG/procaine<br />
(PGP) (VETERINA Animal Health Ltd., Kalinovica, Croatia) were min. 99 % pure.<br />
Stock solution of pharmaceutical mixture w<strong>as</strong> prepared by dissolving accurate<br />
quantities of the powdered standards in methanol. M<strong>as</strong>s concentration of each<br />
pharmaceutical in the mixture w<strong>as</strong>: 5 mg/L for NOR, 100 mg/L for SMETH, SDIAZ,<br />
TMP, OTC and PGP, and 200 mg/L for SGUA. Calibration standards were made by<br />
serial dilution of a stock standard solution with methanol in the working range from<br />
0.15 to 1.5 mg/L for NOR, from 10 to 60 mg/L for OTC, TMP, SDAIZ, SMETH, and<br />
PGP, and from 30 to 110 mg/L for SGUA.<br />
Soil Spiking and Extraction Procedure<br />
Ten millilitres of standard solution w<strong>as</strong> added to 100 g of dried and sieved soil. An<br />
additional 100 mL of methanol w<strong>as</strong> added to cover the soil particles; the slurry<br />
w<strong>as</strong> mixed for 1 h and then left at room temperature for 24 hours to allow solvent<br />
evaporation.<br />
Accurately weighted spiked soil (10 g) w<strong>as</strong> added to 20 mL of methanol and<br />
sonicated for 15 min in an ultr<strong>as</strong>onic bath (frequency 25–40 Hz, UZ-20R, Iskra, Kranj,<br />
Slovenia). The extracts were filtered through Whatman No.40 filter paper. The filtrate<br />
w<strong>as</strong> evaporated on a rotary vacuum evaporator (R-114/A, Büchi, Switzerland) at 40°<br />
to dryness. The residue w<strong>as</strong> dissolved in 1 mL of methanol and this solution w<strong>as</strong><br />
directly spotted on a TLC plate.<br />
219
Thin Layer Chromatography<br />
The samples were applied to the plates <strong>as</strong> bands by means of an automated sample<br />
applicator (Linomat IV, Camag, Muttenz, Switzerland): volume 5 μL, bandwidth<br />
7 mm, distance between the middle of the bands 15 mm, delivery rate 1 μL/10 s.<br />
Ascending development w<strong>as</strong> performed at room temperature in a CAMAG doubletrough<br />
chamber without previous saturation. Plates were developed to a distance<br />
of 70 mm with 0.05 M oxalic acid/methanol = 0.80:0.20 <strong>as</strong> a mobile ph<strong>as</strong>e. After<br />
development, the plates were air dried and the chromatograms were visualised<br />
under UV light at = 254 nm and = 366 nm.<br />
Video densitometry w<strong>as</strong> performed with a highly sensitive 3CCD colour video camera<br />
HV-C20 (Hitachi Denshi, Japan). The parameters of video densitometry were <strong>as</strong><br />
follows: close-up lens +2 Dpt, zoom lens 9.5 mm, integration period-exposure time 1<br />
frame (= 20 ms) at 254 nm and 15 frames at 366 nm, frame accumulation-off mode,<br />
aperture (F-stop number) 2.0. Imaging, processing and archiving were controlled<br />
via VideoStore2 2.30 documentation software. The extended version of Camag<br />
VideoScan 1.01 software w<strong>as</strong> used for quantitative evaluation of the stored TLC<br />
chromatograms. For quantification purposes, detection w<strong>as</strong> carried out at 366 nm,<br />
and TMP w<strong>as</strong> me<strong>as</strong>ured at 254 nm. Method w<strong>as</strong> validated for selectivity, linearity,<br />
limit of detection (LOD), limit of quantification (LOQ), precision and recovery.<br />
RESULTS AND DISCUSSION<br />
Optimization of the mobile ph<strong>as</strong>e w<strong>as</strong> performed by systematic variation of the<br />
composition of the b<strong>as</strong>ic mobile ph<strong>as</strong>e (methanol and 0.05 M oxalic acid). The quality<br />
of chromatographic separation w<strong>as</strong> evaluated by chromatographic response function<br />
on the b<strong>as</strong>is of the predicted R F<br />
values. In this work, the MRF criteria (De Spiegeleer<br />
and De Moerloose, 1987) w<strong>as</strong> used <strong>as</strong> the separation criterion, and maximum value<br />
of MRF function w<strong>as</strong> found using the genetic algorithm approach (Babic et al., 2005).<br />
Optimum mobile ph<strong>as</strong>e composition obtained with these parameter settings w<strong>as</strong><br />
0.05 M oxalic acid/methanol = 0.80:0.20. The obtained results indicate excellent<br />
agreement between experimental and calculated retention factors (R F<br />
-values), <strong>as</strong><br />
well <strong>as</strong> very good overall resolution (Table 1 and Figure 1).<br />
Table 1:<br />
Experimental and calculated R F<br />
values of pharmaceuticals at<br />
optimal mobile ph<strong>as</strong>e composition<br />
Pharmaceutical Calculated Experimental<br />
NOR 0.16 0.15<br />
OTC 0.31 0.31<br />
TMP 0.38 0.37<br />
SDIAZ 0.45 0.44<br />
SMETH 0.56 0.54<br />
PGP 0.62 0.65<br />
SGUA 0.71 0.71<br />
For qualitative purposes, the method w<strong>as</strong> evaluated by taking into account the<br />
precision in the R F<br />
-value and selectivity. Comparing the chromatogram of extracts<br />
with the chromatogram of standard solution (Figure 1a and b) a coincidence of<br />
220
RF-values could be observed. A high repeatability in the R F<br />
-values w<strong>as</strong> obtained<br />
with relative standard deviation (RSD) values lower then 1.5% for standards and<br />
1.7% for extracts. Optimization of the chromatographic method enabled an efficient<br />
separation of pharmaceuticals.<br />
Figure 1: Chromatograms of: a) standard pharmaceutical mixture and b)<br />
extracted samples from spiked soil, 1-NOR, 2-OTC, 3-TMP, 4-SDIAZ,<br />
5-SMETH, 6-PGP and 7-SGUA<br />
Linearity, limit of detection (LOD), limit of quantification (LOQ), precision and recovery<br />
were evaluated for quantitative purposes. The regression analysis w<strong>as</strong> performed<br />
and the resulting parameters are shown in Table 2. R 2 values of the pharmaceuticals<br />
were higher than 0.99 thus confirming the linearity of the method.<br />
Limits of detection (LOD) and quantification (LOQ) for each pharmaceutical in the<br />
mixture were determined from signal-to-noise ratio by comparing me<strong>as</strong>ured signals<br />
from the samples with known low concentrations of analyte with those of the blank<br />
samples (Table 2).<br />
221
Table 2:<br />
Regression functions and correlation coefficients of the studied<br />
pharmaceuticals<br />
Pharmaceutical Regression function R 2 Linearity<br />
range<br />
(ng/spot)<br />
LOD (ng/<br />
spot)<br />
LOQ<br />
(ng/<br />
spot)<br />
NOR A = 2.286 . 10 6 . + 930.8 0.994 0.75–7.5 0.5 0.75<br />
OTC A = 29.6400 . - 429.3 0.994 50–250 25 50<br />
TMP A = 6.3470 . - 6.821 0.997 75–300 50 75<br />
SDIAZ A = 38.8400 . + 1445.0 0.998 50–200 25 50<br />
SMETH A = 26.9500 . + 1496.0 0.999 50–200 25 50<br />
PGP A = 18.300 . + 1090.8 0.993 50–200 25 50<br />
SGUA A = 15.7500 . + 3265.0 0.996 150–550 100 150<br />
A-peak area.<br />
g-m<strong>as</strong>s concentration (ng/spot) (spot = 5 μL).<br />
Precision expressed in terms of RSD indicated high me<strong>as</strong>urement repeatability (Table<br />
3). In general, recoveries were dependent on the analyte concentration and values<br />
between 36.5% and 100.5% were obtained for all pharmaceuticals.<br />
Table 3:<br />
Recoveries and RSDs obtained for studied pharmaceuticals<br />
Pharmaceutical Recovery (%) RSD (n = 3)<br />
NOR 36.5 4.05<br />
OTC n.d. 2.86<br />
TMP 52.6 9.83<br />
SDIAZ 83.2 6.00<br />
SMETH 100.5 6.50<br />
PGP 44.7 3.12<br />
SGUA 78.5 4.88<br />
ND: not detected.<br />
According to validation parameters, it can be concluded that USE-TLC determination<br />
of veterinary antibiotics in soil is comparable with other commonly used extraction<br />
and chromatographic techniques, and convenient for determination of veterinary<br />
pollutants in soil (Thiele-Bruhn, 2003).<br />
ACKNOWLEDGEMENTS<br />
This work h<strong>as</strong> been supported by: EU project EMCO (INCO CT 2004-509188)<br />
- Reduction of environmental risks, posed by Emerging Contaminants, through<br />
advanced treatment of municipal and industrial w<strong>as</strong>tes and Croatian Ministry of<br />
Education, Science and Sport (Project No. 0125055).<br />
222
REFERENCES<br />
Alder AC, McArdell CS, Golet EM, Ibric S, Molnar E, Nipales, NS and Giger W (2001).<br />
Occurrence and fate of fluorochinlone, macrolide, and sulfonamide antibiotics during<br />
w<strong>as</strong>tewater treatment and in ambient waters in Switzerland. In C. G. Daugton and T.<br />
Jones-Lepp (eds), Pharmaceuticals and Personal Care products in the Environment:<br />
Scientific and Regulatory Issues, pp. 56-69. American Chemical Society, W<strong>as</strong>hington,<br />
D.C.<br />
Babic S, Horvat AJM and Kaštelan-Macan M (2005). Application of genetic algorithm<br />
in optimization of TLC separation. JPC-Journal of Planar Chromatography-Modern<br />
TLC 18, 112–117.<br />
De Spiegeleer BMJ, De Moerloose PHM (1987). Criterion for evaluation and<br />
optimization in thin-layer chromatography. Analytical Chemistry 59, 62–64.<br />
EMEA (1997). Note for guidance: Environmental Risk Assessment for Veterinary<br />
Medicinal Products other than Gmo-Containing and Immunological Products.<br />
Committee for Veterinary and Medicinal Products, London, p. 42.<br />
FEDESA (2001). Antibiotic use in farm animals does not threaten human health. Press<br />
rele<strong>as</strong>e, Visby , Sweden.<br />
Hamscher G, Sczesny S, Höper H and Nau H (2002). Determination of persistent<br />
tetracycline residues in soil fertilized with liquid manure by high-performance liquid<br />
chromatography with electronspray ionization tandem m<strong>as</strong>s spectrometry. Analytical<br />
Chemistry 74, 1509–1518.<br />
Höper H, Kues J, Nau H. and Hamscher G (2002). Eintrag und Verbleib von<br />
Tieranzneimittelwirkstoffen in Böden. Bodenschutz 4, 141–148.<br />
Thiele-Bruhn S (2003). Pharmaceutical antibiotic compounds in soils-a review.<br />
Journal of Plant Nutrition and Soil Science 166, 145–167.<br />
223
OPPORTUNITIES AND CONSTRAINTS FOR USING BEST<br />
MANAGEMENT PRACTICES: SOME LESSONS FROM<br />
THE TARLAND CATCHMENT INITIATIVE<br />
S Langan<br />
Macaulay Institute, Craigiebuckler, Aberdeen, AB15 8QH, UK, E-mail: S.Langan@<br />
macaulay.ac.uk<br />
SUMMARY<br />
The Tarland Catchment Initiative (TCI) is a partnership venture set up between<br />
researchers, land managers, regulators and the local community. The aims of the<br />
TCI are to improve water quality and incre<strong>as</strong>e awareness of catchment management.<br />
The implementation of these improvements h<strong>as</strong> been guided by an objective<br />
<strong>as</strong>sessment of existing water quality and selected ecological components across<br />
the catchment and by consideration of the differing needs and perceptions of the<br />
issues from a range of stakeholders. In order to engage the community, there h<strong>as</strong><br />
been a need to undertake capacity building exercises to introduce the concept of<br />
catchment management. This w<strong>as</strong> also used to highlight the pressures and possible<br />
intervention through improved riparian land management to lessen the detrimental<br />
impacts on water quality and ecology. From this starting point, the TCI h<strong>as</strong> initiated<br />
a plan of action b<strong>as</strong>ed on best practice guidelines. The approach adopted allows<br />
for the implementation of me<strong>as</strong>ures on a systematic b<strong>as</strong>is in order to evaluate their<br />
efficacy; to develop the work <strong>as</strong> a show piece and demonstration catchment from<br />
which others can learn. Results after intervention for water quality, ecology and<br />
acceptance by the community are largely a success. The approach adopted, the<br />
issues tackled and outcomes expected are central to many of the requirements set<br />
out in the guiding principles for the European Water Framework Directive.<br />
INTRODUCTION<br />
Incre<strong>as</strong>ingly attention is being given to how catchments can be managed in a holistic<br />
manner. One of the principle policy drivers for this in Europe is the Water Framework<br />
Directive (EC, 2000). The central features of the WFD and its implementation are: the<br />
focus on ecological status and stakeholder engagement (EC, 2000). Within Scotland<br />
one of the largest pressures on surface water bodies failing to meet good ecological<br />
status is due to the impact of diffuse pollution. As part of the characterisation and<br />
impacts report in developing a River B<strong>as</strong>in management Plan, SEPA identify 25% of<br />
river water bodies at risk from diffuse pollution largely linked to land use management<br />
activities (SEPA, 2005).<br />
In order to reduce the impact of diffuse pollution on the environment, a range of<br />
Best Management Practices (BMPs) for agricultural land management have been<br />
included <strong>as</strong> parts of farm agri-environment schemes and good codes of practice,<br />
such <strong>as</strong> the PEPPFA code (SEERAD, 2005). A comprehensive report of many of<br />
the BMPs available for reducing diffuse pollution to surface waters by Hilton (2002)<br />
shows that many of these practices have not been evaluated in the context of the UK<br />
or in relation to impacts on aquatic and riparian ecology.<br />
224
The implementation of BMPs requires an appreciation of the issues involved by<br />
practicing land mangers. To this end there is a need to connect the competent<br />
authorities developing catchment management plans, with land managers and<br />
research on the reduction of diffuse pollution impacts.<br />
The aim of this paper is to summarise the development of a catchment initiative in<br />
terms of: (i) incre<strong>as</strong>ing awareness and stakeholder participation in relation to best<br />
management practice and the need for catchment management, (ii) improving land<br />
management practices in relation to streams and rivers and (iii) the establishment<br />
and use of the work <strong>as</strong> a demonstration site illustrating practical examples of best<br />
practice.<br />
MATERIALS AND METHODS<br />
The Tarland Burn is the most westerly tributary of the River Dee (Aberdeenshire,<br />
Scotland) that is dominated by intensive land use. These land uses, <strong>as</strong> characterised<br />
by the Land Cover of Scotland 1988 dat<strong>as</strong>et, comprise: Heather moorland 7.9%,<br />
unimproved gr<strong>as</strong>sland 9.7 %, plantation forestry 19.1 %, mixed/broadleaved<br />
woodland 1.8%, improved gr<strong>as</strong>sland 35.7%, built-up area 0.7% and arable 25.1%.<br />
Farming in the catchment is typically mixed cereal and livestock, dominated by<br />
the fattening of cattle and malting barley production and some sheep on improved<br />
p<strong>as</strong>ture on the higher ground. Across the catchment area that is used for agriculture,<br />
the practice is to utilise the maximum possible area, including up to the stream<br />
margins. When the riparian fields are used for cattle grazing the streams provide the<br />
cattle waterings.<br />
Earlier work on the River Dee (Langan et al., 1997; SEPA, 2000) and an initial<br />
examination of the temporal variation in water quality at the bottom of the Tarland<br />
catchment indicated there were significant issues related to diffuse pollution,<br />
particularly faecal indicator organisms (FIO), N and P losses. On the b<strong>as</strong>is of this<br />
information, an invitation to the major stakeholders in the catchment w<strong>as</strong> sent out to<br />
discuss these results. As a result of this meeting, various issues were identified (see<br />
results), one of which w<strong>as</strong> the need for more information on water quality variability.<br />
To <strong>as</strong>sess the spatial variability in nitrogen, phosphorus and suspended solids<br />
across the catchment, monthly dip samples have been collected at 16 points since<br />
2001. At the sites, quarterly samples for FIOs were collected and benthic macro<br />
invertebrates sampled using the standard SEPA 3-min kick sample. The invertebrate<br />
data are reported <strong>as</strong> a BMWP (Biological Monitoring Working Party) score (Hawkes,<br />
1997) used to cl<strong>as</strong>sify waters according to the tolerance of different families to<br />
pollution. These sites and parameters were selected to give a series of data in which<br />
the generation of water quality within each major tributary across the catchment<br />
could be examined. Chemical samples were returned to the laboratory and analysed<br />
for nitrate, ammoniacal nitrogen and phosphate within 3 days using automated<br />
colorimetric methods.<br />
This monitoring and survey data provides a set of objective information against<br />
which together with discussions with stakeholders it h<strong>as</strong> been possible to identify<br />
priority are<strong>as</strong> in which intervention management should be initiated. The intervention<br />
me<strong>as</strong>ures trialled are BMPs largely b<strong>as</strong>ed on the requirements of agri-environment<br />
funding and the PEPPFA Code (Scottish Executive, 2005) with a view to <strong>as</strong>sessing<br />
there efficacy for both water quality and invertebrate ecology and to demonstrate<br />
225
to land managers and agency staff the issues involved. The range of environmental<br />
improvement me<strong>as</strong>ures suggested centred on the provision of off stream waterings<br />
for cattle, fencing off streams to provide a buffer strips, the creation of wetland are<strong>as</strong><br />
and soft engineering to improve the diversity of the stream morphology and habitat.<br />
In order to meet the objectives of an inclusive approach to catchment management,<br />
efforts aimed at incre<strong>as</strong>ing awareness and building capacity have been undertaken<br />
at the same time <strong>as</strong> the monitoring and used to guide intervention. This h<strong>as</strong> been<br />
approached by providing a number of different forums for both presenting and<br />
gathering relevant information. A commentary on this process is provided in the<br />
discussion.<br />
RESULTS<br />
The results are presented in terms of water quality; stakeholder involvement and<br />
outcomes from a trial intervention.<br />
Water Quality<br />
Table 1 shows the range and mean concentrations of the major water quality<br />
determinands from the sites across the catchment. Each site represents a sampling<br />
point at the bottom of each tributary of the Tarland Burn. Table 1 also gives the<br />
BMWP score for each site. The data suggests major differences in water quality<br />
across the catchment. In the absence of any single large discharge source within<br />
the catchment, this variation is the result of the combined inputs of a number of<br />
smaller point and non-point sources of pollution. In overall terms, site 13 h<strong>as</strong> the<br />
poorest water quality <strong>as</strong> noted in the high concentrations of FIOs and elevated<br />
concentrations of ammonia, nitrate and phosphate, relative to the other sites. The<br />
invertebrate analysis reflects this poor water quality.<br />
Table 1:<br />
Variation in concentrations from monthly samples for water quality<br />
for selected chemical determinands and quarterly invertebrate<br />
samples in the Tarland catchment tributaries 2000 to 2002<br />
Site<br />
Number<br />
226<br />
PO 4<br />
-P<br />
mg/L<br />
NO 3<br />
-N<br />
mg/L<br />
NH 4<br />
-N<br />
mg/L<br />
Faecal coliforms<br />
/100 mL<br />
BMWP<br />
score<br />
1 0.02 3.49 0.03 7031 96<br />
0.008–0.05 1.34–4.75 < 0.003–0.11 420–35000<br />
10 0.01 3.42 0.03 586 103<br />
< 0.005–0.04 1.14–6.22 0.003–0.10 100–2600<br />
13 0.11 4.72 0.11 127207 83<br />
0.022–0.27 2.28–6.63 < 0.003–0.36 320–640000<br />
14 0.06 2.61 0.04 1043 97<br />
0.013–0.29 1.21–3.73 0.003–0.14 300–2800<br />
15 0.01 3.20 0.03 297 96<br />
0.005–0.02 2.33–4.25 0.004–0.08 20–600<br />
16 0.01 5.06 0.03 1885 92<br />
< 0.005–0.03 3.51–6.51 < 0.003–0.08 600–2800<br />
20 0.01 3.97 0.02 253 104<br />
< 0.005–0.03 2.33–5.04 0.003–0.05 200–340
On the b<strong>as</strong>is of discussions with the land mangers and other stakeholders it w<strong>as</strong><br />
agreed that that any interventions to improve water quality should be undertaken<br />
in a systematic b<strong>as</strong>is by concentrating efforts on individual tributaries. In the light<br />
of this and the data presented in Table 1 initial intervention work concentrated on<br />
the tributary represented by site 13. After further investigation of the tributary and<br />
in conjunction with the riparian land managers, three specific intervention me<strong>as</strong>ures<br />
were identified and implemented. These were: (a) the overhaul of the operation of a<br />
septic tank, (b) the installation of buffer strips and water troughs to reduce the need<br />
for cattle using the stream waterings and (c) the establishment of a small wetland<br />
where field drainage collector pipes were known to issue directly to the burn. These<br />
me<strong>as</strong>ures were implemented during the winter and spring of 2002/03. From the<br />
programme of samples taken comparison of the water quality and invertebrates for<br />
the year prior to and after the interventions were made is presented in Table 2. The<br />
data indicate significant reductions in the concentrations of phosphate, ammonia,<br />
nitrate and faecal coliforms. Furthermore a significant incre<strong>as</strong>e is seen in the BMWP<br />
score.<br />
Table 2:<br />
Water quality and invertebrate data prior to and post-intervention<br />
above tributary site 13<br />
Determinand Pre-intervention Post-intervention<br />
PO 4<br />
-P (mg/L) 0.032<br />
(< DL–0.11)<br />
NH 4<br />
-N (mg/L) 0.043<br />
(< DL–0.166)<br />
NO 3<br />
-N (mg/L) 4.96<br />
(3.48–5.89)<br />
Faecal coliforms 252000<br />
(640000–29000)<br />
BMWP 72<br />
(59–89)<br />
Stakeholder Involvement<br />
0.018<br />
(< DL–0.050)<br />
0.015<br />
(< DL–0.052)<br />
4.26<br />
(3.33–4.89)<br />
2080<br />
(320–5000)<br />
90<br />
(74–113)<br />
An important element of establishing, prioritising and agreeing to intervention<br />
works in the Tarland catchment h<strong>as</strong> been to include and involve the catchment<br />
stakeholders. To fulfil this requirement stakeholders have been involved in a number<br />
of ways according to their interest and stake in the catchment. At the b<strong>as</strong>ic level, the<br />
community have been introduced to the issues, need for intervention and concept<br />
of catchment management through a mixture of informal and formal meetings,<br />
presentations, summary information and a web site (www.macaulay.ac.uk/tarland/).<br />
At the next level of engagement an annual seminar and discussion group with the<br />
farmers h<strong>as</strong> taken place. Through this mechanism additional information from p<strong>as</strong>t<br />
experiences in the form of anecdotal evidence h<strong>as</strong> been made available. Furthermore,<br />
the options for possible tributaries have been identified and the mechanisms for<br />
reducing pollution have been discussed together with possible advantages or<br />
constraints on sites have been identified. Finally the principal land managers (the<br />
MacRobert Trust estate manager, Scottish Water) together with Agency and research<br />
staff (SEPA, SNH, Macaulay Institute and Aberdeenshire Council) formed a steering<br />
group. This group h<strong>as</strong> taken the available information and views expressed by the<br />
227
stakeholders, together with their individual expertise and through consensus agreed<br />
the priority, scale and type of intervention possible. Each of these three groupings<br />
h<strong>as</strong> had a different need and function in taking forward and improving the catchments<br />
management. For all the three groupings there h<strong>as</strong> been a need to improve the level<br />
of understanding of how a catchment operates and highlight some of the pressures<br />
on it. In return this incre<strong>as</strong>ed capacity to understand h<strong>as</strong> given rise to a greater<br />
awareness and involvement. Examples of the additional outcomes arising from the<br />
close involvement of each of these groups are given in Table 3. The <strong>as</strong>pects of the<br />
high level of involvement of the stakeholders that were not fully appreciated are<br />
identified <strong>as</strong> common issues between the different groupings. In summary these are:<br />
(a) the high level of resource requirements, largely staff time, in organising, setting<br />
up and undertaking adequate consultation, (b) the strong role of an individuals<br />
personality and traits in influencing meetings, (c) the additional resources required to<br />
overcome conflict resolution which largely arise over mis-understandings between<br />
different stakeholder groups and (d) in overcoming issues a–c there is an inevitable<br />
slowed pace of implementation.<br />
Grouping<br />
Community<br />
Land managers<br />
Steering group<br />
Examples of additional outcomes<br />
1. Identification of issues of habitat diversity for wader birds highlighted<br />
2. Desire for active involvement<br />
3. Sharing of anecdotal evidence on fish numbers<br />
4. Incre<strong>as</strong>ed reporting of environmental issues and requests for<br />
<strong>as</strong>sistance<br />
5. Implementation results in multi-purpose intervention to incre<strong>as</strong>e water<br />
quality, habitat and riparian access<br />
6. Provide in kind and c<strong>as</strong>h help to implement me<strong>as</strong>ures<br />
7. Sharing of expertise<br />
Table 3:<br />
Examples of additional outputs from stakeholder consultation and<br />
participation<br />
DISCUSSION<br />
The monitoring results have shown that there are a range of diffuse pollution issues<br />
within the Tarland catchment that are impacting on its ecological status. Through<br />
some simple interventions following best practice guidelines on one tributary in<br />
the catchment it h<strong>as</strong> been possible to improve water quality and the biology (<strong>as</strong><br />
me<strong>as</strong>ured by invertebrate BMWP). Added benefit to the intervention and the potential<br />
for including more wide ranging, multi-issue benefits have been brought about by the<br />
involvement and participation of a range of stakeholders. The visual establishment<br />
and demonstratable success of the first intervention h<strong>as</strong> resulted in an incre<strong>as</strong>ed<br />
willingness to expand the me<strong>as</strong>ures to other tributaries in the catchment. The<br />
provision of objective data through which the changes can be quantified and shown<br />
is an important element in discussions of future developments with the stakeholders.<br />
These positive outcomes need to be balanced by consideration of some of the more<br />
difficult <strong>as</strong>pects presented by the relatively slow pace of implementation and high<br />
resource requirements necessary to ensure adequate consultation and participation.<br />
B<strong>as</strong>ed on the experience to date in Tarland, possibly the most effective stakeholder<br />
involvement have been developed through largely unstructured informal approaches. A<br />
228
major factor in the stakeholder involvement h<strong>as</strong> been the necessity for communication<br />
between all parties at all stages and that this communication h<strong>as</strong> been b<strong>as</strong>ed on a<br />
common understanding of the stakeholder requirements and the technical issues.<br />
The success of the intervention for the stakeholders can be commented on through<br />
the continued interest and involvement in the work and apparent willingness to<br />
continue with the work and to roll it out across the catchment.<br />
Through the approach taken, i.e. the monitoring of the impact of intervention of<br />
best management practices in the catchment, it is hoped that the site can act <strong>as</strong><br />
a demonstration for others to learn. This will become incre<strong>as</strong>ingly important <strong>as</strong> the<br />
implementation of the WFD moves forward.<br />
It is interesting to note that within the context of the WFD and the River Dee<br />
catchment that SEPA, through their characterisation report, have identified Tarland<br />
<strong>as</strong> at risk of failing good ecological status through pressures from diffuse pollution<br />
and morphological change. It is also likely that the catchment will appear <strong>as</strong> a priority<br />
in the Dee catchment management plan that is currently being drafted and consulted<br />
on. Further activity and work to reduce these pressures in Tarland is currently<br />
underway through the North Sea Commission Interreg funding (3 Dee Vision).<br />
CONCLUSIONS<br />
This paper h<strong>as</strong> introduced some of the issues that arise in relation to water quality and<br />
describes stakeholder involvement and participation through which improvements<br />
have been achieved. The programme of action suggested h<strong>as</strong> been designed in<br />
such a way that an evaluation of the benefits of the implementation of me<strong>as</strong>ures<br />
can be <strong>as</strong>sessed through the monitoring and survey network already established.<br />
The pressures which generate the problems identified and the solutions with<br />
which to reduce their impact in the Tarland catchment are generic for many rural<br />
and agricultural catchments in Scotland and other parts of Northern Europe. It is<br />
hoped that the lessons learned in Tarland can be used in the development of other<br />
community and catchment b<strong>as</strong>ed action plans elsewhere.<br />
ACKNOWLEDGEMENTS<br />
The author gratefully acknowledges the invaluable <strong>as</strong>sistance and help given by<br />
the MacRobert Trust, Scottish Water, SEPA, SNH, Aberdeenshire Council and the<br />
farmers and community of Tarland and Howe of Cromar. Funding for the work h<strong>as</strong><br />
been from SEERAD, SNH and Aberdeenshire Council.<br />
229
REFERENCES<br />
EC (2000). Directive 2000/60/EC of the European Parliament and of the Council of<br />
23 October 2000 establishing a framework for Community action in the field of water<br />
policy. Official Journal L 327, 0001–0073.<br />
Hawkes HA (1997). Origin and development of the Biological Monitoring Working<br />
Party (BMWP) score system. Water Research 32, 964–968.<br />
Hilton J (2002). A dictionary of BMPs for the reduction of silt, phosphorus and other<br />
pollutants emanating from diffuse sources into surface waters. NERC report, URL<br />
http://www.nerc.ac.uk.<br />
Langan SJ, Wade AJ, Smart R, Edwards AC, Soulsby C, Billett MF, Jarvie HP, Cresser<br />
MS, Owen R and Ferrier RC (1997). The prediction and management of water quality<br />
in a relatively unpolluted catchment: current issues and experimental approaches.<br />
The Science of the Total Environment 194/195, 419–435.<br />
Scottish Executive (2005) Prevention of Environmental Pollution From Agricultural<br />
Activity: A Code of Good Practice. Scottish Executive, Edinburgh.<br />
SEPA (2000). The Dee Catchment Management Plan Issues Consultation document.<br />
SEPA, Aberdeen.<br />
SEPA (2005). Scotland River B<strong>as</strong>in District: Characterisation and impact analyses<br />
required by Article 5 of the Water Framework Directive, summary report. SEPA<br />
230
CAN WE IMPROVE PREDICTION OF P CONCENTRATION<br />
IN LUNAN LOCHS BY CHANGING THE PLUS MODEL?<br />
I Papadopoulou 1 , A Vinten 2 and J DeGroote 2<br />
1<br />
Miaouli 24, Kordelio 56334, Thessaloniki, Greece, E-mail: ioanna.papadopoulou@<br />
gmail.com; 2 The Macaulay Institute, Craigiebuckler, Aberdeen, AB15 8QH, UK<br />
SUMMARY<br />
This project involves changing different factors of the PLUS model in order to test<br />
how sensitive the model is to these parameters. The first factor examined w<strong>as</strong><br />
whether modifying export coefficients to better reflect land use (spring–winter cereals)<br />
improved prediction of P loading. After checking the impact of crop choice, another<br />
scenario w<strong>as</strong> set aimed at investigating how sensitive the model is to changes in<br />
the P export coefficient table used in previous PLUS application. In addition, an<br />
attempt w<strong>as</strong> made to represent structural Best Management Practices (BMPs) in the<br />
GIS framework and predict potential reduction in phosphorus in-loch concentrations<br />
resulting from installing buffer strips.<br />
INTRODUCTION<br />
PLUS is a manageable model, constructed to predict the loss of phosphorus from<br />
a complex catchment to its drainage system. The model uses an export coefficient<br />
approach, calculating the total phosphorus (TP) load delivered annually to a water<br />
body <strong>as</strong> the sum of the individual loads exported from each nutrient source in its<br />
catchment.<br />
The catchment of the Lunan Burn, in Scotland, w<strong>as</strong> selected <strong>as</strong> the study site for the<br />
present project. The Lunan chain of Lochs in Perthshire is of high conservation status<br />
and requires informed and targeted environmental protection.<br />
A study comparing predictions of PLUS with monthly observations of P status<br />
of the Lunan chain of Lochs (SEPA, 2004) found a marked discrepancy between<br />
observations and predictions. This discrepancy could be attributed to a number of<br />
factors, but the most likely issues identified were the inadequacy of the land cover<br />
data, the use of inappropriate loss coefficients and imperfect knowledge of septic<br />
tank outputs.<br />
Comparison of the resulting predictions for in-loch concentrations of TP with<br />
observed values for the lochs showed re<strong>as</strong>onably good agreement for the upper<br />
three lochs in the Lunan chain. However, for Lochs Clunie and Marlee the predictions<br />
of the model were significantly higher than the observed values (SEPA, 2004).<br />
SCENARIOS APPLIED<br />
Two scenarios were applied to Lunan catchment, with the aim of determining which<br />
of the model parameters exert greatest influence over model output. For the purpose<br />
of these scenarios, the year of 1999 w<strong>as</strong> chosen <strong>as</strong> the control year. This decision<br />
w<strong>as</strong> taken because among the sets of years for which data are available, 1999 w<strong>as</strong><br />
closer to the initial PLUS application during which water chemistry data from January<br />
2000 w<strong>as</strong> used.<br />
231
A third scenario w<strong>as</strong> applied to Clunie subcatchment with the aim of investigating<br />
any potential reduction in phosphorus in-loch concentrations, resulting from installing<br />
buffer strips on both sides of Lunan Burn in the Clunie subcatchment.<br />
First Scenario’s Description and Assumptions<br />
The aim of this scenario w<strong>as</strong> to check how sensitive the model is to the proportions<br />
of winter and spring cereals. Three sets of data were used: 1989, 1994 and 2004. The<br />
<strong>as</strong>sumptions made for this scenario are listed below:<br />
• First <strong>as</strong>sumption: P loss coefficients for arable land, in the P export rates table<br />
provided by MLURI for the purpose of this project, are representative of the<br />
proportion of winter and spring cereals in Lunan catchment for 1999 (control<br />
year).<br />
• Second <strong>as</strong>sumption: The model works for all five subcatchments, so the final<br />
outputs are not to be questioned. The numbers used in order to draw conclusions<br />
are not the actual output numbers for P loads in the lochs but the difference in the<br />
values between 1999 and 1989, 1994, 2004.<br />
• Third <strong>as</strong>sumption: Relative P loss coefficient for winter cereals is equal to 1<br />
and for spring cereals is equal to 0.39 b<strong>as</strong>ed on literature. Winter cereals were<br />
considered to be the same <strong>as</strong> having no best management practice applied and<br />
spring cereals were considered the same <strong>as</strong> conservation tillage.<br />
Applying this scenario involved modifying the export coefficients to better reflect<br />
land use (spring/winter cereals). In order for this to be accomplished the following<br />
steps were followed:<br />
a. A formula that calculated correction factors for P export rates b<strong>as</strong>ed on relative<br />
are<strong>as</strong> of winter/ spring crops w<strong>as</strong> created. The relative are<strong>as</strong> were calculated<br />
using agricultural census data per parish.<br />
b. P export table w<strong>as</strong> transformed according to the correction factors and a different<br />
table for each application (1989, 1994, 2004) w<strong>as</strong> produced.<br />
S<br />
TA . S + e<br />
W<br />
TA . W e<br />
Formula used to calculate P export coefficients: A e<br />
=<br />
(1)<br />
Where:<br />
A e is the P export coefficient for arable land.<br />
S and W are the are<strong>as</strong> of spring and winter cereals, respectively.<br />
TA is the area of total arable land.<br />
S e and W e are the P loss exports for spring and winter cereals,<br />
respectively.<br />
B<strong>as</strong>ed on the third <strong>as</strong>sumption: S e<br />
- 0.39 . W e (2)<br />
232
A e<br />
= 0.39 . S W S<br />
TA + TA ) W (0.39 . W +<br />
e<br />
W TA TA )<br />
e<br />
From (1) and (2): =<br />
(3)<br />
A e<br />
S<br />
TA<br />
For 1999 (default year): = 0.954 and for flat slope the minimum A e = 0.40.<br />
So, from (3) we get W e = 0.957 and from (2) S e = 0.373.<br />
Using W e and S e , <strong>as</strong> they were calculated b<strong>as</strong>ed on 1999’s data, and the relative<br />
are<strong>as</strong> of winter and spring cereals for 1989, 1994 and 2004 we get from (1) A e * for<br />
each of the previous years.<br />
A e<br />
*<br />
A correction factor = is used in order to reproduce the series of export<br />
A e<br />
coefficients according to land slope.<br />
Where: A e<br />
is the export coefficient for the default year, and<br />
A e<br />
* is the export coefficient for arable land representative of the proportion of winter–<br />
spring cereals of the year that data are used in the equation (1).<br />
Second Scenario’s Description and Assumptions<br />
This scenario investigated how sensitive the model is to changes in the P export<br />
coefficients table used in the PLUS application. Specifically, the P loss coefficients<br />
that correspond to arable land, which is one of the biggest contributors to TP in the<br />
lochs, were improved and afterwards the effect that this change had on the model’s<br />
TP calculation, w<strong>as</strong> examined.<br />
Table 1 summarizes export coefficients for arable land, <strong>as</strong> they were collected from<br />
literature research. B<strong>as</strong>ed on the figures listed in Table 1, P export coefficients for<br />
cereals are lower compared with other arable crops.<br />
Table 1:<br />
Summary of P export coefficients from literature review<br />
Land cover type<br />
P (kg/ha)<br />
Min<br />
max<br />
Location<br />
PLUS Arable 0.4 2.0 -<br />
Agriculture (general) 0.1 1.0 Scotland<br />
0.1 6.8 UK<br />
Arable (general) 0.8 2.5 Scotland<br />
0.5 5 UK<br />
Cereals 0.22 0.9 Scotland<br />
0.06 0.9 UK<br />
233
B<strong>as</strong>ed on a detailed distribution of the different land uses in Lunan catchment and<br />
according to agricultural census data per parish for 1999, 52.8% of the total arable<br />
land in Lunan catchment w<strong>as</strong> under cereals crops. This fact combined with the<br />
conclusion that cereal crops have lower export coefficients compared with other<br />
arable crops allowed us to accept the <strong>as</strong>sumption that P export coefficients for<br />
arable land used for the default application could be reduced by 40% and still be<br />
representative of the Lunan catchment.<br />
So, applying this scenario involved reducing arable land P export rates by 40% and<br />
creating a new P export table for the application.<br />
Third scenario’s description and <strong>as</strong>sumptions<br />
This scenario w<strong>as</strong> b<strong>as</strong>ed on two main <strong>as</strong>sumptions:<br />
• First <strong>as</strong>sumption: Buffer strip efficacy concerning prevention of phosphorus<br />
losses is 40%, b<strong>as</strong>ed on literature search (Vinten et al., 2004).<br />
• Second <strong>as</strong>sumption: In order for the buffer strip to be effective, the slope should<br />
be less than seven degrees (Vinten et al., 2004).<br />
The only way to implement a BMP, like a buffer strip, in the PLUS model, is by trying<br />
to include the effect of such practice in the P loss coefficients. Figure 1 shows the<br />
fields that were <strong>as</strong>sumed to be influenced by the installation of the buffer strip.<br />
Figure 1: Fields that were <strong>as</strong>sumed to be influenced from the installation of<br />
the buffer strip (dotted area across both sides of the Lunan Burn<br />
depicts buffered fields)<br />
After identifying the buffered fields, P loss coefficients that corresponded with those<br />
fields were reduced by 40% from their initial value, according to the first <strong>as</strong>sumption.<br />
This new P export table w<strong>as</strong> then used in order to run the PLUS model.<br />
234
RESULTS<br />
Figure 2 shows the estimates of TP concentration for Clunie loch from all the three<br />
scenarios applied to Lunan catchment compared with the default application.<br />
The outputs from the first scenario suggest that taking into account the change into<br />
winter/spring cereals distribution h<strong>as</strong> some positive effect on estimating TP in loch<br />
concentration, but the difference is not statistically significant at 95% confidence.<br />
The outcome of the second scenario applied, demonstrates that model calibration<br />
by inspecting and adjusting the export coefficients is required and h<strong>as</strong> the potential<br />
to result in a more accurate estimation of the total in-loch concentrations.<br />
The descriptive statistics support the conclusion that the residuals of the second<br />
scenario are better behaved compared with the default application. The mean of the<br />
residuals is closer to zero and furthermore the standard deviation of the residuals is<br />
smaller compared with the one of the control year. So, the notion that the scenario<br />
application is more efficient is verified, since the high values of the residuals in the<br />
c<strong>as</strong>e of the default application could mean that the independent variables used did<br />
not explain satisfactory the variance of the dependent variable. It should be stated<br />
though that the limited number of observations available diminishes the credibility of<br />
the results.<br />
Figure 2: Comparison of predicted range of Clunie loch mean TP<br />
concentration with control year (all in µg/L)<br />
The results of the third scenario, compared with the results of the default application<br />
suggest that potential installation of buffer strip would have positive effect on holding<br />
of TP to Clunie Loch. Specifically, minimum in loch TP concentration w<strong>as</strong> estimated<br />
to decre<strong>as</strong>e from 22.9 to 13.2 µg/L, while the maximum w<strong>as</strong> estimated to decre<strong>as</strong>e<br />
from 39.3 to 20.3 µg/L.<br />
DISCUSSION<br />
The conclusion that when the different proportions of winter and spring crops were<br />
taken into consideration did not have any significant difference in the model outputs<br />
235
could be misleading. The results of the first scenario can be attributed to the following<br />
factors:<br />
• The proportion of winter crops in the Lunan catchment is very low, and specifically<br />
winter crops in the catchment are limited to winter cereals, which compose just<br />
6.7% of the overall cereal crops, b<strong>as</strong>ed on 1999 agricultural census data;<br />
• The amount of potatoes could also be considered <strong>as</strong> winter crop, given that<br />
potatoes incre<strong>as</strong>e the risk of run-off;<br />
• Finally, the third <strong>as</strong>sumption that w<strong>as</strong> made could be questioned.<br />
The range of P export coefficient used by PLUS for arable land is 0.40–2.00 kg/ha/<br />
year, while the range of P export coefficient for arable land used for the purpose of the<br />
second scenario is 0.24–1.20 kg/ha/year. In order for this <strong>as</strong>sumption to be justified,<br />
results of P export studies that were carried out on two main subcatchments/ farms<br />
in the Lunan Lochs chain are used:<br />
• Craigie Burn/ Hillocks of Gourdie Farm<br />
• Cattymill Burn/ Meadows of Ballied Farm<br />
B<strong>as</strong>ed on the samples (Table 2), the exports are higher than 1 kg/ha in specific<br />
are<strong>as</strong> in the catchment. This figure weakens the argument that the PLUS exports<br />
(0.40–2.00 kg/ha) are too high. It h<strong>as</strong> to be kept in mind though that the ditch that<br />
drains the field where repeated applications of poultry manure takes place drains<br />
afterwards into Black Loch. So, the high value of P loss could be attributed to the<br />
poultry manure application. However, the Cattymill catchment is mainly arable. More<br />
accurate conclusions regarding the range of P exports could be drawn if a series of<br />
samples well distributed across the whole Lunan catchment w<strong>as</strong> available.<br />
Table 2:<br />
Craigie<br />
Burn<br />
Cattymill<br />
Burn<br />
Summary of P export from three catchment are<strong>as</strong><br />
Catchment<br />
area (ha)<br />
Sampling period<br />
Mean [TP]<br />
(mg/L)<br />
P loss<br />
(kg/ha)<br />
Ditch draining a field 18 13/10/04 to 13/3/05 0.27 0.86<br />
with poultry manure<br />
Black Loch outlet 60 8/4/05 to 30/7/05 0.49 1.17<br />
Meadows of Ballied 13/10/04 to 1/2/05 0.34 0.99<br />
Chapelton 2453 13/10/04 to 19/1/05 0.22 0.60<br />
CONCLUSIONS – FUTURE WORK<br />
Taking under consideration the change into winter/spring cereals distribution h<strong>as</strong><br />
some positive effect on estimating TP in loch concentration, but the difference is not<br />
statistically significant at 95% confidence. However, this is attributed to a number of<br />
factors related to Lunan catchment and to the <strong>as</strong>sumptions of the scenario.<br />
Changing P export coefficients for arable land, b<strong>as</strong>ed on literature search, resulted<br />
in a decre<strong>as</strong>e of the calculated TP in the lochs by up to 20%. This demonstrates<br />
that model calibration by inspecting and adjusting the export coefficients is required<br />
and h<strong>as</strong> the potential to result in more accurate estimation of the total in-loch<br />
concentrations.<br />
236
It is worth considering ways to represent BMP’s in GIS framework, <strong>as</strong> it can be a<br />
useful tool when it comes to catchment management.<br />
Input data refinement is one of the are<strong>as</strong> for future improvement. Updated land cover<br />
theme is required <strong>as</strong> the land cover theme used at the present project depicts year<br />
1988 (LCS88) and questions the comparison of the model’s output with 2000 water<br />
chemistry data.<br />
ACKNOWLEDGEMENTS<br />
I would like to acknowledge SEPA, SEERAD and MLURI for providing me with the<br />
data I needed for the present project.<br />
REFERENCES<br />
SEPA (2004). The Lunan Chain of Lochs: Review and Development of Phosphorus<br />
Budgets (Action plan: F113). Internal report of SEPA.<br />
Vinten AJA, Towers W, King JA, McCracken DI, Crawford C, Cole LJ, Duncan A, Sym<br />
G, Aitken M, Avdic K, Lilly A, Langan S and Jones M (2005). Appraisal of Rural BMP’s<br />
for Controlling Diffuse Pollution and Enhancing Biodiversity. Final Report of SNIFFER<br />
project WFD13.<br />
237
TACKLING DIFFUSE NITRATE POLLUTION: SWAPPING<br />
EUTROPHICATION FOR CLIMATE CHANGE?<br />
D Reay<br />
University of Edinburgh, School of Geosciences, Crew Building, West Mains Road,<br />
Edinburgh, EH9 3JG, UK, E-mail: david.reay@ed.sac.uk<br />
SUMMARY<br />
Large are<strong>as</strong> of the UK have now been designated ‘Nitrate Vulnerable Zones’ (NVZs)<br />
<strong>as</strong> a result of the high levels of nitrate in surface and groundwaters. Where nitrate<br />
is lost from the fields through drainage there are two main remediation strategies<br />
available. The first involves the creation of strips of uncultivated land, known <strong>as</strong><br />
‘buffer strips’ to intercept the leached nitrate before it gets into drainage waters. The<br />
other is designed to intercept any nitrate already in drainage waters by diverting the<br />
water through natural or constructed denitrifying wetlands.<br />
The use of both buffer strips, often in riparian zones, and denitrifying wetlands, h<strong>as</strong><br />
become incre<strong>as</strong>ingly widespread in the p<strong>as</strong>t few years (Mitch et al., 2001; Sabater et<br />
al., 2003), but doubts remain over their suitability in many are<strong>as</strong> (Dosskey, 2002). As<br />
well <strong>as</strong> the potential problem of leached nitrate by-p<strong>as</strong>sing the buffer strip and wetland<br />
soils, there is also a danger that denitrification in their soils - the primary process of<br />
nitrate removal – will lead to greatly incre<strong>as</strong>ed nitrous oxide (N2O) emissions (Hefting<br />
et.al., 2003), so swapping a water pollution problem for a climate change issue (Reay,<br />
2004). Here we present a synthesis of N pollution swapping studies to date and<br />
introduce a wide-ranging project aimed at addressing this key issue.<br />
REFERENCES<br />
Mitsch WJ, Day Jr JW, Gilliam JW, Groffman PM, Hey DL, Randall, GW and Wang N<br />
(2001). Reducing nitrogen loading to the Gulf of Mexico from the Mississippi River<br />
b<strong>as</strong>in: strategies to counter a persistent ecological problem. BioScience, 51(5), 373-<br />
388.<br />
Sabater S et al. (2003). Nitrogen removal by riparian buffers along a European climatic<br />
gradient: Patterns and factors of variation. Ecosystems, 6(1), 20-30.<br />
Dosskey MG (2002). Setting priorities for research on pollution reduction functions of<br />
agricultural buffers. Environmental Management, 30(5), 641-650.<br />
Hefting MM, Bobbink R and de Caluwe H (2003). Nitrous oxide emission and<br />
denitrification in chronically nitrate-loaded riparian buffer zones. Journal of<br />
Environmental. Quality, 32(4).<br />
Reay DS (2004). Fertilizer “solution” could turn local problem global. Nature, 427,<br />
485.<br />
238
CATCHMENT SENSITIVE FARMING ON THE HAMPSHIRE<br />
AVON<br />
MC Robson 1 , R Curtis 1 , J Swain 2 and C Routh 3<br />
1<br />
Environment Agency, Rivers House, Sunrise Business Park, Blandford, DT11 8ST,<br />
UK, E-mail: melissa.robson@environment-agency.gov.uk; 2 English Nature, Prince<br />
Maurice Court, Hambleton Avenue, Devizes, SN10 2RT, UK; 3 RDS Defra, Block 3,<br />
Government Buildings, Burghill Road, Westbury-on-Trym, Bristol, BS10 6NJ, UK<br />
SUMMARY<br />
The Hampshire Avon Multi-Agency Catchment Sensitive Farming (MACSF) pilot,<br />
started in 2005, takes much of its local lead from the ‘Landcare’ project, which h<strong>as</strong><br />
been running since 1997. However, the MACSF project is farther reaching than its<br />
local forerunner. It focuses not only on the local reduction of diffuse pollution from<br />
agriculture but also on a robust evaluation strategy, effective communication and<br />
providing key information, lessons learned and support for the, soon to be appointed,<br />
CSFOs.<br />
Delivery of CSF on the Avon is in the form of soil management planning workshops<br />
and follow-ups surgery, cultivation trials on demonstration farms, 1:1 field-specific<br />
specialist advice, farm visits and agronomy newsletters. Monitoring and evaluation<br />
strategies vary over the four MACSF pilots, the Avon strategy focuses on changes<br />
in actual behaviour and land management, changes in soil structural degradation<br />
and storm inspection surveys. Less emph<strong>as</strong>is h<strong>as</strong> been placed on water quality<br />
monitoring due the impact of weather patterns on the me<strong>as</strong>ured parameters and<br />
the short duration of the project. Issues being addressed include raising general<br />
and farmer awareness of diffuse pollution, stakeholder expectation management and<br />
designing an evaluation strategy that will produce high quality data independent of<br />
the weather.<br />
If the pilot catchments succeed, they will not only reduce diffuse pollution locally,<br />
and inform other catchments of best practice, but importantly, they will be used in<br />
<strong>as</strong>sessing whether the voluntary approach can reduce diffuse pollution from agriculture<br />
sufficiently for the demands of the Water Framework Directive. In an industry where<br />
the general perception is one of over-regulation, a successful voluntary approach to<br />
reducing diffuse pollution is an attractive idea.<br />
239
AMMONIA VOLATILISATION FROM CATTLE SLURRY<br />
APPLIED TO GRASSLAND: EFFECTS OF APPLICATION<br />
TECHNIQUE AND RATE<br />
E Sagoo 1 , JR Williams 1 , BJ Chambers 2 , J Lapworth 3 and T Misselbrook 4<br />
1<br />
ADAS Boxworth, Battlegate Road, Boxworth, Cambridge, CB3 8NN, UK, E-mail: Lizzie.<br />
Sagoo@ad<strong>as</strong>.co.uk; 2 ADAS Gleadthorpe, Meden Vale, Mansfield, Nottinghamshire,<br />
NG20 9PF, UK; 3 ADAS Wolverhampton, Wergs Road, Wolverhampton, WV6 8TQ,<br />
UK; 4 IGER North Wyke, Okehampton, Devon, EX20 2SB, UK<br />
SUMMARY<br />
The effects of slurry application rate (20–80 m 3 /ha) and method (broadc<strong>as</strong>ting vs.<br />
bandspreading/shallow injection) on ammonia (NH 3<br />
) emissions were studied at a<br />
clay loam gr<strong>as</strong>sland site in Cheshire. Shallow injection reduced NH 3<br />
emissions by c.<br />
60% compared with surface broadc<strong>as</strong>t application, because the slurry w<strong>as</strong> retained<br />
within the shallow injection slot, which reduced the exposed surface area that w<strong>as</strong><br />
susceptible to NH 3<br />
loss. However, the trailing shoe application did not reduce NH 3<br />
emissions compared with surface broadc<strong>as</strong>ting, which w<strong>as</strong> due to a combination of<br />
the high hydraulic loading rate from the trailing shoe slurry application (c. five times<br />
greater than the surface broadc<strong>as</strong>t) and the moist soil conditions, which delayed the<br />
rate of slurry infiltration into the soil. There were no relationships between broadc<strong>as</strong>t,<br />
shallow injected or trailing shoe slurry application rates and NH 3<br />
emissions. This<br />
work indicates that factors which affect the infiltration rate of slurry into the soil (i.e.<br />
hydraulic loading rate, soil moisture, slurry dry matter content) are important factors<br />
in controlling NH 3<br />
losses from slurry applications.<br />
INTRODUCTION<br />
Ammonia (NH 3<br />
) emissions from UK agriculture were estimated at 218,000 tonnes<br />
NH 3<br />
-N per year in 2000, with losses after the land spreading of farm manures<br />
responsible for c. 36% of total emissions (Defra, 2002). In order to protect sensitive<br />
habitats, the UK h<strong>as</strong> signed a number of international agreements to reduce NH 3<br />
emissions, including the UNECE Gothenburg Protocol, the EC National Emission<br />
Ceilings Directive (NECD) and the EC Integrated Pollution Prevention and Control<br />
(IPPC) Directive.<br />
Previous work in the UK h<strong>as</strong> shown that at application rates of 30–35 m 3 /ha slurry<br />
bandspreading and shallow injection on gr<strong>as</strong>sland can reduce ammonia emissions<br />
compared with surface broadc<strong>as</strong>ting by c. 40% and 70%, respectively (Smith et al.,<br />
2000). In addition, bandspreading techniques (i.e. trailing shoe and hose) allow slurry<br />
to be spread on growing crops in the spring, with much reduced slurry contamination.<br />
However, the effectiveness of band spreading and shallow injection techniques<br />
in reducing NH 3<br />
emissions can be variable, with factors such <strong>as</strong> application rate<br />
(which can be controlled by the farmer) and the retention of slurry in a band (for<br />
bandspreading) or slot (for shallow injection), likely to be important in controlling NH 3<br />
emissions.<br />
The aim of this study w<strong>as</strong> to evaluate the effects of slurry application rate and method<br />
on NH 3<br />
emissions from cattle slurry applied to gr<strong>as</strong>sland.<br />
240
MATERIALS AND METHODS<br />
Cattle slurry w<strong>as</strong> applied to a clay loam textured gr<strong>as</strong>sland soil in Cheshire using<br />
broadc<strong>as</strong>t and shallow injection application techniques in November 2003, and<br />
broadc<strong>as</strong>t and trailing shoe application techniques in March 2004. Slurry w<strong>as</strong> applied<br />
at five application rates (20, 35, 50, 65 and 80 m 3 /ha), with each treatment replicated<br />
three times. Each plot w<strong>as</strong> 6 m wide x 12 m long, and w<strong>as</strong> arranged in a randomised<br />
block design. Slurry w<strong>as</strong> applied using a specialist plot applicator (Plate 1, B<strong>as</strong>ford<br />
et al., 1996), which w<strong>as</strong> representative of commercial practice, with the slots/bands<br />
20 cm apart. Ammonia emissions were me<strong>as</strong>ured from each plot for 7 days after<br />
application, using wind tunnels (Plate 1) b<strong>as</strong>ed on the design of Lockyer (1984). The<br />
depth of the injection slots (after slurry injection) and width of the slurry bands (after<br />
both the shallow injected and trailing shoe slurry application) were me<strong>as</strong>ured, and<br />
visual <strong>as</strong>sessments were made of the time taken for the slurry to infiltrate into the<br />
soil.<br />
Plate 1:<br />
Shallow injection slurry application using specialist plot applicator<br />
(left) and me<strong>as</strong>urement of NH 3 emissions with wind tunnels (right)<br />
RESULTS AND DISCUSSION<br />
In November 2003, shallow injection reduced (P < 0.001) NH 3<br />
emissions by an overall<br />
mean of 59% compared with surface broadc<strong>as</strong>t application (Figure 1). The cattle<br />
slurry (5.2% dry matter, 3.1 kg/m 3 total N) w<strong>as</strong> effectively retained in the 7–8 cm<br />
deep injection slots at the application rates between 20 and 50 m 3 /ha (c. 20% soil<br />
surface occupied by slurry), although there w<strong>as</strong> some ‘overspill’ of the injection slots<br />
at the two higher application rates (65 and 80 m 3 /ha; 25–30% soil surface occupied<br />
by slurry). Ammonia emissions were equivalent to a mean of 14% of the total N<br />
applied (range 10–18%) from the broadc<strong>as</strong>t application and a mean of 6% of the<br />
total N applied (range 3–7%) from the shallow injected application. The reduction<br />
in NH 3<br />
emissions achieved by the shallow injection technique reflected the smaller<br />
emitting surface area compared with the surface broadc<strong>as</strong>t applications. There w<strong>as</strong><br />
no relationship (P > 0.05) between broadc<strong>as</strong>t or shallow injected slurry application<br />
rates and NH 3<br />
emissions in November 2003.<br />
In March 2004, the trailing shoe application did not reduce NH 3<br />
emissions compared<br />
with the surface broadc<strong>as</strong>t application, even though the high dry matter slurry (8.9%<br />
dry matter) remained in a band, covering 18% of the soil surface area at 20 m 3 /ha<br />
241
and 27% of the soil surface at 80 m 3 /ha. Ammonia emissions were equivalent to a<br />
mean of 10% of the total N applied (range 7–14%) from the broadc<strong>as</strong>t application<br />
and a mean of 12% of the total N applied (range 7–20%) from the trailing shoe<br />
application (Figure 2).<br />
NH 3 loss (% N applied)<br />
30<br />
20<br />
10<br />
0<br />
20 35 50 65 80<br />
Application rate (m 3 /ha)<br />
Broadc<strong>as</strong>t<br />
Shallow injection<br />
Figure 1: Ammonia losses after shallow injection and broadc<strong>as</strong>t slurry<br />
applications to gr<strong>as</strong>sland in November 2003<br />
The higher hydraulic loading from the trailing shoe slurry application (11–30 mm per<br />
unit of surface area occupied by the slurry) compared with the surface broadc<strong>as</strong>t<br />
application (2–8 mm), meant that while the slurry stayed in a band, infiltration into<br />
the moist clay soil w<strong>as</strong> restricted (Table 1). Hence, the NH 3<br />
emission patterns and<br />
rates were similar from the two techniques, even though the emitting surface of the<br />
trailing shoe application w<strong>as</strong> only 18–30% that of the surface broadc<strong>as</strong>t application.<br />
Again, there w<strong>as</strong> no relationship (P > 0.05) between broadc<strong>as</strong>t or trailing shoe slurry<br />
application rates and NH 3<br />
emissions in March 2004.<br />
NH 3 loss (% N applied)<br />
30<br />
20<br />
10<br />
0<br />
Broadc<strong>as</strong>t<br />
Trailing shoe<br />
20 35 50 65 80<br />
Application rate (m 3 /ha)<br />
Figure 2: Ammonia losses after bandspread and broadc<strong>as</strong>t slurry applications<br />
to gr<strong>as</strong>sland in March 2004<br />
242
Table 1: Broadc<strong>as</strong>t and trailing shoe slurry application details (March 2004)<br />
Application<br />
rate (m3/ha)<br />
N applied<br />
(kg/ha)<br />
Surface area occupied<br />
by band spread slurry<br />
(%)<br />
Hydraulic loading rate (mm)<br />
Broadc<strong>as</strong>t Trailing shoe<br />
20 91 18 2.0 11<br />
35 159 22 3.5 16<br />
50 227 26 5.0 19<br />
65 295 30 6.5 22<br />
80 363 27 8.0 30<br />
CONCLUSIONS<br />
Shallow injection of slurry into the clay loam gr<strong>as</strong>sland soil (at application rates<br />
between 20 and 80 m 3 /ha) reduced NH 3<br />
emissions by c. 60% compared with<br />
surface broadc<strong>as</strong>t application, largely <strong>as</strong> a result of the smaller emitting surface area.<br />
Although there w<strong>as</strong> some ‘overspill’ from the injection slots at the higher application<br />
rates, the majority of the slurry remained within the slot and this did not affect NH3<br />
emissions <strong>as</strong> a % of the total N applied.<br />
Slurry application using a trailing shoe did not reduce NH 3<br />
emissions compared with<br />
surface broadc<strong>as</strong>t application. Although the slurry remained within a band (surface<br />
area occupied 18–30%), the combination of a high hydraulic loading rate (11–30 mm)<br />
and wet soil conditions restricted the rate of slurry infiltration into the soil, which<br />
resulted in similar NH 3<br />
losses to the broadc<strong>as</strong>t application.<br />
These data indicate that for slurry shallow injection and bandspreading techniques to<br />
successfully reduce NH 3<br />
emissions, slurry needs to be retained in a band/slot (to give<br />
a smaller emitting surface area) and to rapidly infiltrate into the soil. If both conditions<br />
are not satisfied, the NH 3<br />
reduction benefit of bandspread/shallow injection spreading<br />
techniques will not be realised.<br />
ACKNOWLEDGEMENTS<br />
Funding of this work by Defra is gratefully acknowledged.<br />
REFERENCES<br />
B<strong>as</strong>ford WD, Briggs W, Jackson DR and Smith KA (1996). Equipment for the improved<br />
precision application of animal w<strong>as</strong>te slurries and liquid effluents to field plots. In:<br />
Proceedings of the International Conference on Mechanisation of Field Experiments<br />
(IAMFE ‘96), IAMFE, Paris/Versailles, France, pp. 161-166.<br />
Defra (2002). Ammonia in the UK. Defra Publications, London.<br />
Lockyer DR (1984) A system for the me<strong>as</strong>urement in the field of losses of ammonia<br />
through volatilisation. Journal of the Science of Food and Agriculture 35, 837–848.<br />
Smith KA, Jackson DR, Misselbrook TH, Pain BF and Johnson RA (2000). Reduction<br />
of ammonia emissions by slurry application techniques. Journal of Agricultural<br />
Engineering Research 77, 277–287.<br />
243
FIELD TESTING OF MITIGATION OPTIONS FOR<br />
PHOSPHORUS AND SEDIMENT (MOPS)<br />
CJ Stevens and JN Quinton<br />
Department of Environmental Science, Lanc<strong>as</strong>ter University, Lanc<strong>as</strong>ter, LA1 1PZ, UK,<br />
E-mail: C.Stevens@lanc<strong>as</strong>ter.ac.uk<br />
SUMMARY<br />
Diffuse phosphorus (P) pollution contributes to the eutrophication of surface waters<br />
and is a serious problem in the UK. Losses of P <strong>as</strong>sociated with soil particles are<br />
often linked to soil erosion. There are already a wide range of options for reducing<br />
soil erosion and the subject h<strong>as</strong> received considerable research effort. However, less<br />
is known about the effectiveness of these methods for reducing P losses. To address<br />
this gap, the Mitigation Options for Phosphorus and Sediment (MOPS) project<br />
focuses on a range of treatments with potential for mitigating P losses <strong>as</strong>sociated<br />
with combinable crops. Field experiments have been established at three contr<strong>as</strong>ting<br />
sites in the UK. At each site a number of different treatments are being investigated<br />
including cultivation techniques, tramline management, cover crops and vegetative<br />
barriers. These treatments reflect different levels of intervention. The project will<br />
also consider the financial costs <strong>as</strong>sociated with adopting these different mitigation<br />
options.<br />
INTRODUCTION<br />
Diffuse P pollution, predominantly from agricultural sources (including fertiliser and<br />
animal w<strong>as</strong>te), is a serious problem in the UK and contributes to the eutrophication of<br />
waterways and standing water bodies. Surface waters in the UK are strongly limited<br />
by P and even small additions can cause eutrophication. P occurs naturally within<br />
soils, but high inputs in the form of organic and inorganic fertilisers from agricultural<br />
crops have resulted in considerably higher levels of soil P than are utilised by the<br />
crop plants. Inputs in the form of fertiliser and manure are between 20 and 50 kg ha/<br />
year (Haygarth et al., 1998) and (Haygarth et al., 2005) have shown that total losses<br />
of P from soils are estimated to be approximately 1 kg/ha/year.<br />
Phosphorus binds to soil particles and losses of P <strong>as</strong>sociated with soil particles are<br />
often linked to soil erosion. As a result of the research effort since the 1930s there<br />
are a wide range of effective mitigation options for reducing soil erosion. However,<br />
much less is known about how effective these mitigation options are for reducing the<br />
P losses <strong>as</strong>sociated with sediment.<br />
The Mitigation Options for Phosphorus and Sediment (MOPS) project focuses on a<br />
range of treatments with potential for reducing P losses <strong>as</strong>sociated with combinable<br />
crops. The treatments being investigated reflect different levels of intervention and<br />
are suitable for inclusion under Cross Compliance and the Entry Level Stewardship<br />
scheme or Higher Tier options. All the treatments have the aim of reducing sediment<br />
losses by reducing overland flow velocity, protecting the soil surface or managing<br />
soil structure.<br />
244
MATERIALS AND METHODS<br />
Field Experiment<br />
Field experiments have been established at three contr<strong>as</strong>ting sites (Figure 1). The<br />
soils at Loddington in Leicestershire consist of Hanslope and Denchworth series<br />
clays on an erodible slope. The site is run by the Allerton Trust which seeks to<br />
demonstrate means of farming profitably with minimal environmental impact. The<br />
soil at the Moorfield site at ADAS Rosemaund consists of a silty clay loam of the<br />
Bromyard/Middleton series. The site at Old Hattons, near Wolverhampton is owned<br />
and operated by Seven Trent Water plc. The soils here are of a sandy loam texture,<br />
have a high P content and are prone to erosion. They are poorly structured sandy<br />
loam soils overlying compacted glacial till. A number of different treatments with the<br />
potential to reduce P losses will be investigated at each site.<br />
Figure 1: The location of the Loddington, Moorfield and Rosemaund field<br />
sites<br />
At each field site run-off from unbounded plots (12 m wide and the length of the hill<br />
slope) will be collected in troughs towards the b<strong>as</strong>e of the slope and will run through<br />
pipes to sample splitters. The sample splitters will enable the collection of between<br />
50% and 12.5% of run-off depending on conditions. The collected run-off will be<br />
stored in tanks for subsequent sub-sampling and analysis.<br />
TREATMENTS<br />
Cultivation Techniques<br />
Minimum tillage is currently being promoted <strong>as</strong> an erosion control tool and experiments<br />
in Bedfordshire have shown that cultivation across the slope and minimum tillage<br />
245
techniques can significantly reduce soil erosion on sandy soils (Quinton and Catt,<br />
2004). Unpublished data by the same authors h<strong>as</strong> indicated that it can also reduce<br />
losses of total P. We will trial minimum tillage (at Loddington and Rosemaund) and<br />
across slope cultivation (at Loddington) to determine the effects on P losses.<br />
Tramline Management<br />
Tramlines are a key conduit for the transfer of sediment and P at the field scale<br />
and previous work (DEFRA project number PE0111 – ADAS, 2003) h<strong>as</strong> shown that<br />
concentrations of total P in run-off from fields with no tramlines were half of those with<br />
tramlines. However, tramlines are an important component of modern agriculture so<br />
methods (e.g. tramline disruption and vegetative techniques) to reduce run-off on<br />
tramlines will be investigated. .<br />
Cover Crops<br />
The use of cover crops is recommended in Nitrate Vulnerable Zones (NVZs) but there<br />
is little data available to demonstrate whether they are suitable for reducing P loses.<br />
Cover crops rely on establishing rapid canopy cover to prevent raindrop impact and<br />
reduce the velocity of surface run-off therefore reducing P losses in sediment. Crops<br />
to be investigated in this project include wheat and barley.<br />
Crop Residue Management<br />
Widely used in the United States to control soil erosion, crop residue management<br />
involves the use of residues of the previous year’s crops to protect the soil surface<br />
and maintain an open soil structure so water can infiltrate. This will potentially be a<br />
key technique to use on the weakly structured soils.<br />
Vegetative Barriers<br />
Long slopes were identified <strong>as</strong> important for the transport of P in a previous<br />
investigation (ADAS, 2003). In this project we will reduce slope length will be reduced<br />
by introducing live vegetative barriers across slopes in the form of beetle banks.<br />
These are already funded under the Environmental Stewardship scheme to enhance<br />
biodiversity and introduce natural predators.<br />
Laboratory Analysis<br />
The run-off samples collected will be analysed for total P and total P < 0.45 mm using<br />
acid molybdate/antinomy with <strong>as</strong>corbic acid reduction (Department of Environment,<br />
1992; USEPA, 1985) and determined spectrophotometrically (880 nm) using a Seal<br />
Analytical AQ2 analyser. Total nitrogen will be determined using high temperature<br />
catalytic oxidation and chemoluminescence. Total suspended solids in the run-off<br />
samples will be determined using a standard filtration and drying technique (Bartram<br />
and Balance, 1996).<br />
DISCUSSION<br />
This project will allow the development and testing of recommendations for mitigating<br />
P losses with consideration of pollution swapping. Me<strong>as</strong>ures taken to reduce the<br />
losses of one pollutant to the environment can cause other pollutants to incre<strong>as</strong>e.<br />
This project is primarily looking at the impact of the selected mitigation option on<br />
246
P losses but will also consider losses of N and sediment in order to recommend<br />
management practices that can provide maximum environmental benefit.<br />
The testing of the mitigation me<strong>as</strong>ures examined in this project will provide evidence<br />
to help farmers select the most suitable methods for mitigating losses of P from<br />
their land. It will also help bodies such <strong>as</strong> DEFRA to target funding for farmers to<br />
undertake mitigation me<strong>as</strong>ures. If mitigation me<strong>as</strong>ures are to be adopted by farmers<br />
they need to be at worst cost-neutral. Analyses will consider the costs <strong>as</strong>sociated<br />
with introducing and maintaining the mitigations practices and the effect of adopting<br />
mitigation options upon economic land management. These analyses will also<br />
consider whether any cost shortfall may be met from other funding sources.<br />
ACKNOWLEDGEMENTS<br />
The authors are grateful to DEFRA for funding this project.<br />
REFERENCES<br />
ADAS Consulting Ltd (2003). Towards understanding factors controlling transfer of<br />
phosphorus within and from agricultural fields. DEFRA project number PE0111. URL<br />
http://www.defra.gov.uk/science/project_data/DocumentLibrary/PE0111/PE0111_<br />
1490_FRP.doc<br />
Bartram J and Balance R (1996). Water Quality Monitoring: A Practical Guide to<br />
the Design and Implementation of Freshwater Quantitative Studies and Monitoring<br />
Programmes. E and FN Spon, London.<br />
Department of Environment (1992). Phosphorus and Silicon in Waters, Effluents<br />
and Sludges Department of Environment Standing Committee of Analysts, HMSO,<br />
London.<br />
Haygarth PM, Condron LM, Heathwaite AL, Turner BL and Harris GP (2005). The<br />
phosphorus transfer continuum: Linking source to impact with an interdisciplinary<br />
and multi-scaled approach. Science of the Total Environment 344, 5–14.<br />
Haygarth PM and Jarvis SC (1999). Transfer of phosphorus from agricultural soils.<br />
Advances in Agronomy 66, 195–249.<br />
Haygarth PM, Chapman PJ, Jarvis SC and Smith RV (1998). Phosphorus budgets<br />
for two contr<strong>as</strong>ting gr<strong>as</strong>sland farming systems in the UK. Soil Use and Management<br />
14, 160–67.<br />
Quinton JN and Catt JA (2004). The effects of minimal tillage and contour cultivation<br />
on surface run-off, soil loss and crop yield in the long-term Woburn Soil Erosion<br />
Experiment on a sandy soil in England. Soil Use and Management 20, 343–49.<br />
USEPA (1985). Methods for Chemical Analysis of Water and W<strong>as</strong>tes. US Environmental<br />
Protection Agency Environmental Monitoring Support Laboratory, Cincinnati, Ohio.<br />
247
NITRATE CONTAMINATION OF GROUNDWATER FROM<br />
AGRICULTURE IN CANTERBURY, NEW ZEALAND:<br />
MEASUREMENT AND MANAGEMENT OF A HIDDEN<br />
PROBLEM<br />
KJW Taylor<br />
Environment Canterbury, 58 Kilmore Street, PO Box 345, Christchurch, New Zealand<br />
8001, E-mail: Ken.Taylor@ecan.govt.nz<br />
SUMMARY<br />
Nitrate contamination of groundwater from agriculture is an incre<strong>as</strong>ingly important<br />
issue for resource management in Canterbury. Most people in the region are<br />
dependent on untreated groundwater for drinking, and although communities<br />
place a high value on groundwater quality, over much of the plains the resource is<br />
unconfined and therefore at risk from nitrate contamination. While samples from<br />
only a small proportion of wells in the monitoring network (2-6%) have nitrate-N<br />
concentrations in excess of NZ Drinking Water Standards, the data show a trend<br />
of incre<strong>as</strong>ing concentrations (up to 0.7 mgL -1 yr -1 ) across large parts of the alluvial<br />
aquifer system. This is particularly marked in those are<strong>as</strong> where the primary source<br />
of recharge is rainfall, <strong>as</strong> opposed to seepage from rivers. Agricultural development<br />
on the Canterbury Plains h<strong>as</strong> been ongoing for many years, but there h<strong>as</strong> been a<br />
shift in production systems over the l<strong>as</strong>t decade in particular, from mixed cropping<br />
and dry-land sheep grazing to more intensive irrigated p<strong>as</strong>toral and arable farming,<br />
driven in part by developments in irrigation technology. Dairying h<strong>as</strong> emerged <strong>as</strong><br />
a major land use in formerly dry-land are<strong>as</strong>. This intensification h<strong>as</strong> the potential<br />
to contribute to further incre<strong>as</strong>es in nitrate concentrations in groundwater. The<br />
management response to the nitrate trend h<strong>as</strong> included: incre<strong>as</strong>ed research effort<br />
to quantify N contributions from multiple sources over time and at a range of spatial<br />
scales, more stringent regulation of point-source discharges, and the promotion of<br />
best management practices. The most important new initiative is a proposed rule<br />
requiring landowners to estimate nitrate-leaching losses, and to undertake nutrient<br />
budgeting and other me<strong>as</strong>ures if leaching thresholds are exceeded.<br />
248
RAPID INCORPORATION OF SOLID MANURE AS A BEST<br />
MANAGEMENT PRACTICE?<br />
RE Thorman 1 , J Webb 2 and S Yamulki 3<br />
1<br />
ADAS Boxworth, Battlegate Road, Boxworth, Cambridge, CB3 8NN, UK, E-mail:<br />
rachel.thorman@ad<strong>as</strong>.co.uk; 2 ADAS Wolverhampton, Wergs Road, Wolverhampton,<br />
WV6 8TQ, UK; 3 IGER North Wyke, Okehampton, Devon, EX20 2SB, UK<br />
SUMMARY<br />
After solid manure spreading, rapid incorporation by ploughing h<strong>as</strong> been recognised<br />
<strong>as</strong> a successful technique to reduce ammonia (NH 3<br />
) emissions. However, the reduced<br />
NH 3<br />
loss conserves nitrogen which may subsequently be emitted from the soil <strong>as</strong> the<br />
greenhouse g<strong>as</strong>, nitrous oxide (N 2<br />
O). Emissions of N 2<br />
O were monitored at two UK<br />
sites (central and south west England) after application of cattle manure, pig manure,<br />
layer manure and broiler litter to arable land. At both sites, ploughing reduced NH 3<br />
emissions compared with those from plots where manure remained on the soil surface<br />
(P < 0.001). However, the effect of incorporation on N 2<br />
O loss w<strong>as</strong> inconsistent. In the<br />
warm and wet south west, incorporation had no effect on N 2<br />
O emissions (P > 0.05),<br />
but at the cooler and drier central site, N 2<br />
O losses incre<strong>as</strong>ed (P < 0.001), suggesting<br />
that rapid incorporation may be considered <strong>as</strong> a best management practice (BMP)<br />
for both N 2<br />
O and NH 3<br />
abatement only under site-specific conditions.<br />
INTRODUCTION<br />
Around 43 million tonnes of solid manure are handled annually in the UK (Williams et al.,<br />
2000), with 36% of agricultural ammonia (NH 3<br />
) emissions (82 kt N) estimated to arise<br />
from the management of solid manures (Misselbrook et al., 2000). After land spreading,<br />
ammonia emissions of manures represent both a large loss of potential crop available<br />
nitrogen and a considerable environmental risk. Deposition of NH 3<br />
can lead to soil<br />
acidification and nitrogen (N) enrichment of sensitive habitats, consequently the UK<br />
h<strong>as</strong> signed a number of international agreements [UNECE Gothenburg Protocol, EC<br />
Integrated Pollution Prevention and Control (IPPC) Directive, EC National Emission<br />
Ceilings Directive] to reduce NH 3<br />
emissions. After the application of solid manures<br />
to arable land, rapid incorporation h<strong>as</strong> been identified <strong>as</strong> an effective me<strong>as</strong>ure to<br />
abate NH 3<br />
emissions (Webb et al., 2005). However, the reduced NH 3<br />
loss conserves<br />
N incre<strong>as</strong>ing the mineral N pool in the soil, which may subsequently be available<br />
for microbial nitrification and denitrification and the production of the greenhouse<br />
g<strong>as</strong>, nitrous oxide (N 2<br />
O). Nitrous oxide is a potent greenhouse g<strong>as</strong> with a global<br />
warming potential 310 times that of carbon dioxide (IPCC, 1996). The current UK<br />
emissions inventory (2003) shows that 67% of N 2<br />
O is produced from agriculture with<br />
the majority emitted from agricultural soils (Baggott et al., 2005). As a result of the<br />
Kyoto protocol, the UK h<strong>as</strong> agreed to a legally binding reduction of greenhouse g<strong>as</strong><br />
emissions of 12.5% of 1990 levels by the period 2008–12. It is, therefore, important<br />
that me<strong>as</strong>ures implemented <strong>as</strong> a BMP to reduce NH 3<br />
emissions do not result in an<br />
incre<strong>as</strong>ed loss of N 2<br />
O.<br />
249
MATERIALS AND METHODS<br />
At two UK sites: site 1 at ADAS Gleadthorpe, Central England and site 2 at IGER North<br />
Wyke, south west England, N 2<br />
O and NH 3<br />
emissions were monitored from replicated<br />
(x 4) plots (6 x 10 m) after a spring (February/March) application of solid manure. The<br />
plots were established on cereal stubble on a loamy sand soil (site 1) and on bare<br />
arable ground on a coarse sandy loam soil (site 2). Cattle farm yard manure (FYM), pig<br />
FYM, layer manure or broiler litter were spread at a target application rate of 250 kg<br />
N/ha and either left on the surface or immediately incorporated (to 20–25 cm depth)<br />
by ploughing. Control treatments were included where no manure w<strong>as</strong> added.<br />
Me<strong>as</strong>urements of N 2<br />
O were made from two static flux chambers (40 cm wide x 40 cm<br />
long x 25 cm high), that were placed in random positions on each plot after the<br />
incorporation treatment had been completed. Chambers were pushed into the soil<br />
up to a depth of 5 cm to ensure an airtight seal and headspace samples analysed<br />
<strong>as</strong> soon <strong>as</strong> possible after collection by g<strong>as</strong> chromatography. The N 2<br />
O flux w<strong>as</strong><br />
calculated b<strong>as</strong>ed on the linear incre<strong>as</strong>e in N 2<br />
O concentration inside the chamber<br />
over a 40-minute enclosure period. Nitrous oxide emission me<strong>as</strong>urements were<br />
carried out immediately after manure application and at regular intervals over a c.<br />
60-day period.<br />
Ammonia emissions were monitored for up to 2 weeks after manure application<br />
using a modified wind tunnel technique (one per plot) b<strong>as</strong>ed on the design of Lockyer<br />
(1984). Each wind tunnel consisted of two parts; a transparent polycarbonate canopy<br />
(2.0 x 0.5 m) which covered the plot area, and a stainless-steel duct housing a<br />
fan which drew air through the canopy at a speed of 1 m/s. A sub-sample of the<br />
air entering and leaving the tunnel w<strong>as</strong> drawn through fl<strong>as</strong>ks containing 0.02 M<br />
orthophosphoric acid, which absorbed NH 3<br />
present in the air stream. The acid w<strong>as</strong><br />
subsequently analysed for ammonium-N concentration by automated colorimetry.<br />
The NH 3<br />
emission w<strong>as</strong> calculated <strong>as</strong> the product of air that flowed through the tunnel<br />
and the difference between the concentrations of NH 3<br />
in the air entering and leaving<br />
the tunnel.<br />
RESULTS AND DISCUSSION<br />
Ploughing reduced mean NH3 emissions (P < 0.001) by 97-98%, with losses from<br />
the ploughed treatments at –0.3% and 0.4% of total-N applied compared with losses<br />
of 15.5% and 19.0% of total-N applied from the plots where manure w<strong>as</strong> left on the<br />
surface. However, at site 1 ploughing incre<strong>as</strong>ed N 2<br />
O losses (P < 0.001) compared<br />
with those from surface application (Figure 1). Mean N 2<br />
O losses from the ploughed<br />
treatments were a factor of 4´ larger at 1.39% of total-N applied compared with losses<br />
of 0.36% of total-N applied from the plots where manure w<strong>as</strong> left on the surface. In<br />
contr<strong>as</strong>t, at site 2, there w<strong>as</strong> no effect of incorporation on N 2<br />
O emissions (P > 0.05),<br />
although there w<strong>as</strong> a suggestion that ploughing reduced N 2<br />
O losses compared with<br />
surface application. Losses were 0.54% of total-N applied and 1.44% of total-N<br />
applied from ploughed and surface applied treatments respectively. The discrepancy<br />
in the effect of ploughing on N 2<br />
O emissions between sites is probably related to<br />
differences in soil conditions.<br />
The mean soil temperature (5-cm depth) over the monitoring period at site 2 w<strong>as</strong><br />
10.7ºC with 19% of the mean daily temperatures 8ºC or less. At site 1, the mean<br />
250
soil temperature w<strong>as</strong> 9.3ºC, but with 41% of the mean daily temperatures ≤ 8ºC.<br />
Site 2 w<strong>as</strong> wetter than site 1 with twice <strong>as</strong> much rain (174.4 mm) falling over the N 2<br />
O<br />
monitoring period compared with site 1 (85.8 mm). Numerous studies in the literature<br />
have shown that N 2<br />
O production incre<strong>as</strong>es with temperature and can be stimulated<br />
with a rise in soil moisture (Dobbie et al., 1999; Scott et al., 2000). Ploughing is likely<br />
to incre<strong>as</strong>e the length of the diffusion pathway from the site of N 2<br />
O production (the<br />
FYM) to the soil surface. Soil texture and structure would influence this diffusion<br />
rate. So at site 2, although conditions were more favourable for N 2<br />
O production than<br />
at site 1, the rate of N 2<br />
O diffusion through the soil w<strong>as</strong> probably slower due to the<br />
heavier textured and wetter soil. This would provide a greater opportunity for N 2<br />
O<br />
reduction to N 2<br />
and hence lower N 2<br />
O emissions.<br />
Later work from this project at a site with a clay soil in central England h<strong>as</strong> shown<br />
similar results to those at site 2. Despite no effect of ploughing (P > 0.05) on N 2<br />
O losses<br />
calculated over c. 60 days, surface application resulted in mean losses 4x larger than<br />
from ploughing. Evidence from the literature also indicates an uncertain effect of<br />
ploughing/simulated incorporation of solid/liquid manures such that, depending on<br />
site conditions, the impact on N 2<br />
O may be neutral, or result in enhanced or reduced<br />
emissions (Velthof et al., 2003; Thorman et al., 2005a, b).<br />
Figure 1: Total N 2<br />
O emission (% total-N applied) calculated over c. 60 days<br />
after application of solid manure to cereal stubble (site 1) and bare<br />
arable ground (site 2) in spring. CM, cattle manure; PM, pig manure;<br />
LM, layer manure; BL, broiler litter; surf, surface application; plo,<br />
plough. Error bars represent ± one standard error of the mean<br />
CONCLUSIONS<br />
This study shows that the effect of rapid incorporation by ploughing on N 2<br />
O loss w<strong>as</strong><br />
inconsistent. In the wet, south west ploughing had no effect on N 2<br />
O emissions, but<br />
at the drier, central site N 2<br />
O losses incre<strong>as</strong>ed, suggesting that rapid incorporation by<br />
ploughing <strong>as</strong> a best management practice for NH 3<br />
abatement may only be used <strong>as</strong> a<br />
‘win–win’ technique under site specific conditions.<br />
251
ACKNOWLEDGEMENTS<br />
Funding of this work by the UK Department for the Environment Food and Rural<br />
Affairs (Defra) is gratefully acknowledged.<br />
REFERENCES<br />
Baggott SL, Brown L, Mike R, Murrells TP, P<strong>as</strong>sant N and Thistlethwaite DG (2005).<br />
Greenhouse G<strong>as</strong> Inventories, for England, Scotland, Wales and Northern Ireland:<br />
990-2003. National Technology Centre, AEA Technology, Harwell.<br />
Dobbie KE, McTaggart IP and Smith KA (1999). Nitrous oxide emissions from intensive<br />
agricultural systems: variations between crops and se<strong>as</strong>ons, key driving variables,<br />
and mean emission factors. Journal of Geophysical Research 104, 26891–26899.<br />
IPCC (1996). Climate Change 1995. The Science of Climate Change. Contribution of<br />
Working Group 1 to the Second Assessment Report of the Intergovernmental Panel<br />
on Climate Change (JT Houghton, ed.) Cambridge University Press, Cambridge.<br />
Lockyer DR (1984). A system for the me<strong>as</strong>urement in the field of losses of ammonia<br />
through volatilisation. Journal of the Science of Food and Agriculture 35, 837–848.<br />
Misselbrook TH, van der Weerden TJ, Pain BF, Jarvis SC, Chambers BJ, Smith KA,<br />
Phillips V R and Demmers TGM. (2000). Ammonia emission factors for UK agriculture.<br />
Atmospheric Environment 34, 871–880.<br />
Scott A, Ball BC, Crichton IJ, Aitken MN. (2000). Nitrous oxide and carbon dioxide<br />
emissions from gr<strong>as</strong>sland amended with sewage sludge. Soil Use and Management<br />
16, 36–41.<br />
Thorman RE, Harrison R, Boyles LO, Chadwick DR and Matthews R (2005a). The<br />
effect of storage and rapid incorporation on N2O emissions following the application<br />
of pig and cattle FYM to land. In: P Bernal, R Moral, R Clemente, C Paredes (eds),<br />
Proceedings of the 11th International Conference of the FAO ESCORENA RAMIRAN;<br />
Sustainable Organic W<strong>as</strong>te Management for Environmental Protection and Food<br />
Safety. FAO and CSIC, Murcia, Spain, pp.329-332.<br />
Thorman RE, Chadwick DR, Boyles LO, Matthews R, Sagoo E and Harrison R (2005b).<br />
Nitrous oxide emissions during storage of solid manure and following application to<br />
arable land. In: CR Soliva, J Takah<strong>as</strong>hi and M Kreuzer (eds.), Proceedings of the 2nd<br />
International Conference on Greenhouse G<strong>as</strong>es and Animal Agriculture GGAA2005.<br />
ETH Zurich, Zurich, Switzerland, pp.278-281.<br />
Velthof GL, Kuikman PJ and Oenema O (2003). Nitrous oxide emission from animal<br />
manures applied to soil under controlled conditions. Biology and Fertility of Soils 37,<br />
221-230.<br />
Webb J, Menzi H, Pain BF, Misselbrook TH, Dämmgen U, Hendriks H and Döhler<br />
H (2005). Managing ammonia emissions from livestock production in Europe.<br />
Environmental Pollution 135, 399–406.<br />
Williams JR, Chambers BJ, Smith KA and Ellis S (2000). Farm manure land application<br />
strategies to conserve nitrogen within farming systems. In: Proceedings of the SAC/<br />
SEPA Conference; Agriculture and W<strong>as</strong>te Management for a Sustainable Future. The<br />
Scottish Agriculture College, Aberdeen, pp. 167-179.<br />
252
METHODS TO IMPROVE POLLUTION CONTROL<br />
POTENTIAL OF WOODCHIP CORRALS<br />
AJA Vinten 1 , D Merrilees 2 , G Sym 2 , J Parker 2 and C Crawford 2<br />
1<br />
Macaulay Land Use Research Institute, Craigiebuckler, Aberdeen, AB15 8QH, UK,<br />
E-mail: a.vinten@macaulay.ac.uk; 2 SAC, West Mains Road, Edinburgh, EH9 3JG,<br />
UK<br />
SUMMARY<br />
This project investigated the efficacy of different potential sublayers for removal of<br />
some key residual pollutants after p<strong>as</strong>sing slurry through woodchip corrals. Pollutants<br />
studied were: ammonium, nitrate, Escherichia coli, mineral phosphate and organic<br />
carbon (TOC). The sublayers investigated were loamy sand subsoil, sandy loam<br />
topsoil, iron ochre granules (to remove P by adsorption) and straw (to remove N by<br />
immobilisation). Good pollutant removal w<strong>as</strong> obtained by all sublayer treatments,<br />
with the exception of the straw treatment. This suffered from problems with packing<br />
the straw between woodchips and subsoil, leading to uneven flow conditions.<br />
Nitrate concentrations in leachate rose to > 40 mg/L but results suggest significant<br />
denitrification w<strong>as</strong> occurring. The value of the iron ochre and straw w<strong>as</strong> demonstrated<br />
in a laboratory column experiment, in which removal of nutrients equivalent to 188 kg<br />
N/ha and 92 kg P/ha w<strong>as</strong> achieved by straw and ochre layers.<br />
INTRODUCTION<br />
In Scotland, woodchip corrals are being widely used <strong>as</strong> a means of overwintering<br />
beef cattle. The leachate from corrals still h<strong>as</strong> a considerable pollution potential<br />
(Vinten et al., 2006), some of which can be mitigated if it h<strong>as</strong> the chance to p<strong>as</strong>s<br />
through suitable sublayers before rele<strong>as</strong>e to ground or surface waters. The idea of<br />
this project w<strong>as</strong> to investigate the efficacy of different sublayers for removal of the key<br />
pollutants: ammonium, nitrate, E. coli, suspended solids, phosphate and dissolved<br />
organic carbon (DOC). The sublayers investigated were sandy subsoil, sandy loam<br />
topsoil, iron ochre granules (to remove P by adsorption) and straw (to remove N by<br />
immobilisation).<br />
MATERIALS AND METHODS<br />
Eight lysimeters (1.1 x 0.9 x 1 m) were set up at SAC Auchincruive (Figure 1). There<br />
were four sublayer treatments (each in duplicate): control (40 cm of sandy subsoil<br />
of Dreghorn series from the site area), topsoil (40 cm of sandy loam topsoil of<br />
Dreghorn series, from the site area), iron ochre (10 cm of dried granular iron ochre<br />
from w<strong>as</strong>te lagoons at Polkemmet open c<strong>as</strong>t coal mine, underlain by sandy subsoil)<br />
and straw (20 cm of barley straw coarsely chopped, underlain by sandy subsoil).<br />
Overlying these sublayers were 20-cm depth of medium-size woodchips (approx.<br />
15 x 5 x 5 cm chips) and 20 cm of large woodchips (20 x 10 x 10cm). Weekly inputs<br />
of slurry (14 mm equivalent depth) containing 1800 mg/L NH 4<br />
-N, 33,000 mg/L<br />
total organic C (TOC), 3.4 x 10⁷ colony forming units (cfu) E. coli/100 mL and with<br />
electrical conductivity of 14 mS, along with natural rainfall were applied from January<br />
to September 2004. Weekly accumulated samples of leachate were analysed for<br />
ammonium, nitrate, phosphate, dissolved organic (DOC), and electrical conductivity<br />
253
y standard methods and fresh, end of week samples were analysed for E. coli using<br />
the Colilert method (IDEXX, 2001). Volume of flow w<strong>as</strong> also noted.<br />
Two laboratory columns were also set up: control (w<strong>as</strong>hed sand) and straw/iron ochre<br />
overlaying sand to demonstrate the nutrient removal concept for these materials.<br />
Dilute slurry (50 mm/day) containing on average 90 mg/L NH 4<br />
-N, 107 mg/L DOC,<br />
5.9 mg/L soluble reactive P (SRP) and with electrical conductivity of 343 mS w<strong>as</strong><br />
applied to these columns from 29 October to 12 December 2003.<br />
RESULTS<br />
Figure 2 shows the breakthrough curves of EC, DOC, E. coli, NH 4<br />
-N, NO 3<br />
-N and PO 4<br />
-<br />
P for control (40 cm subsoil) and ochre (10 cm ochre and 30 cm subsoil) lysimeters.<br />
In the interests of clarity, results for the topsoil and straw treatments are not shown<br />
in Figure 1, but the average leachate concentrations in the period from May to<br />
September 2004 are given in Table 1. Over the time course of the experiment, the<br />
results show that removal of all pollutants w<strong>as</strong> good for all sublayers except straw.<br />
The straw treatment w<strong>as</strong> the le<strong>as</strong>t effective, probably because the water did not<br />
move uniformly through this layer due to difficulties in packing of the straw layer<br />
between subsoil and chips.<br />
1A 2A 3A 4A<br />
Top<br />
20cm large woodchips 20cm large woodchips 20cm large woodchips 20cm large woodchips<br />
20cm small woodchips 20cm small woodchips 20cm small woodchips 20cm small woodchips<br />
10cm ochre<br />
20cm wheat s traw<br />
20cm top s oil<br />
40cm s ub s oil 30cm s ub s oil 20cm s ub s oil 20cm s ubs oil<br />
B ottom 10 cm Pea Gravel 10 cm Pea Gravel 10 cm Pea Gravel 10 cm Pea Gravel<br />
4B 3B 1B 2B<br />
Top<br />
20cm large woodchips 20cm large woodchips 20cm large woodchips 20cm large woodchips<br />
20cm small woodchips 20cm small woodchips 20cm small woodchips 20cm small woodchips<br />
10cm ochre<br />
20cm top s oil<br />
20cm wheat s traw<br />
20cm s ubs oil 20cm s ub s oil 40cm s ub s oil 30cm s ub s oil<br />
B ottom 10 cm Pea Gravel 10 cm Pea Gravel 10 cm Pea Gravel 10 cm Pea Gravel<br />
Figure 1: Summary of lysimeter layout and design<br />
254
Table 1:<br />
Concentrations of pollutants in leachate from lysimeters, compared<br />
with slurry input {mean and SD of samples taken from 3rd May [after<br />
cumulative input of rainfall (403 mm) + slurry (224 mm)] to 30 August<br />
[after further cumulative rainfall input of 344 mm]}<br />
Mean<br />
slurry<br />
value*<br />
Material below woodchips<br />
Control Ochre Straw Topsoil<br />
Leachate concentration mg/L<br />
EC<br />
(mS)<br />
DOC 33,000<br />
(TOC)<br />
NH 4<br />
-N<br />
(mg/L)<br />
NO 3<br />
-N<br />
(mg/L)<br />
PO 4<br />
-P<br />
(mg/L)<br />
Log E. coli<br />
(cfu/100 ml)<br />
14.0 2.0<br />
(0.3)<br />
22.46<br />
(19.3)<br />
1,800 0.60<br />
(0.48)<br />
0 31.0<br />
(6.7)<br />
225 0.02<br />
(0.02)<br />
7.5 2.3<br />
(0.5)<br />
2.9<br />
(0.3)<br />
12.6<br />
(7.8)<br />
0.32<br />
(0.01)<br />
36.2<br />
(2.5)<br />
0.03<br />
(0.01)<br />
2.3<br />
(0.2)<br />
2.5<br />
(0.03)<br />
125.6<br />
(69.7)<br />
0.72<br />
(0.22)<br />
37.6<br />
(3.2)<br />
0.57<br />
(0.04)<br />
3.0<br />
(0.05)<br />
1.9<br />
(0.17)<br />
17.4<br />
(1.9)<br />
0.32<br />
(0.19)<br />
31.2<br />
(0.4)<br />
0.07<br />
(0.05)<br />
2.4<br />
(0.3)<br />
*Mean input slurry dilution factor with rainfall = 2.8.<br />
The EC relative to the average EC value of the rainfall + slurry inputs (EC/EC input<br />
)<br />
until slurry application ce<strong>as</strong>ed (after 166 mm of drainage, 403 mm rainfall and 224<br />
mm of slurry, 12 January to 3 May 2004) incre<strong>as</strong>ed to a maximum of 0.62 in the<br />
control treatment. If we <strong>as</strong>sume the EC is controlled primarily by transport of weakly<br />
sorbed ions such <strong>as</strong> Cl-, this line is indicative of the behaviour of a conservative,<br />
non-reactive, non-adsorbed tracer. The initial EC in leachate from both the ochre<br />
and straw lysimeters w<strong>as</strong> significantly higher than from the other treatments, but it<br />
is not clear why at present. The DOC concentrations began to rise at the same time<br />
<strong>as</strong> the EC, but values were much lower, relative to input, showing that microbial<br />
degradation and/or sorption occurred. The NH 4<br />
-N showed a similar pattern to DOC,<br />
and the DOC/NH 4<br />
-N ratios were similar to the input values, suggesting that oxidation<br />
and sorption of organic C and NH 4<br />
-N follow similar patterns. Nitrate concentrations<br />
rose steadily in the drainage water with time, to a maximum of approximately 40 mg/<br />
L and there w<strong>as</strong> no delay relative to EC, suggesting that rapid nitrification of NH 4<br />
-N<br />
occurred. However, NH 4<br />
-N concentrations relative to input values were much lower<br />
than EC/EC input<br />
. This suggests either that for a large part of the NH 4<br />
-N added,<br />
nitrification is slow, and/or that denitrification is occurring. Given the time course<br />
of nitrate breakthrough, the latter explanation is more likely, but the two alternatives<br />
cannot be properly distinguished without further work, for example by comparison<br />
of the d15N content of input and output N (e.g. Krapac et al., 2002) and <strong>as</strong>sessment<br />
of ammonium adsorption, which will delay the pollutant transport. The E. coli<br />
concentrations in the leachate rose before the EC showing that there w<strong>as</strong> significant<br />
exclusion of bacterial cells from smaller soil pores. Except for the straw treatment,<br />
E. coli concentrations were very low relative to input values, showing that most of<br />
the E. coli w<strong>as</strong> inactivated during transport through the soil. The concentrations were<br />
255
comparable to those in water draining slurry treated or sheep-grazed drained plots<br />
(Vinten et al., 2004). The PO 4<br />
-P concentrations draining from all treatments were<br />
very low, comparable to those draining from arable fields, but the values were lowest<br />
from the ochre treatment. The ratio of P to NH 4<br />
-N in the drainage water w<strong>as</strong> similar<br />
to that in the input slurry.<br />
0.8<br />
EC/ECinput<br />
160<br />
DOC mg/L<br />
EC/EC in<br />
0.6<br />
0.4<br />
0.2<br />
DOC (mg/L)<br />
120<br />
80<br />
40<br />
0.0<br />
0 100 200 300<br />
mm drainage<br />
0<br />
0 100 200 300<br />
mm drainage<br />
log [E.coli]<br />
cfu/100mL<br />
5<br />
4<br />
3<br />
2<br />
1<br />
log [E.coli] cfu/100mL<br />
0 100 200 300<br />
mm drainage<br />
ammonium-N (mg/L)<br />
8<br />
6<br />
4<br />
2<br />
0<br />
NH 4-N mg/L<br />
0 100 200 300<br />
mm drainage<br />
NO 3-N mg/L<br />
PO 4-P mg/L<br />
nitrate-N (mg/L)<br />
80<br />
60<br />
40<br />
20<br />
0<br />
0 100 200 300<br />
mm drainage<br />
phosphate-P (mg/L)<br />
0.4<br />
0.3<br />
0.2<br />
0.1<br />
0.0<br />
subsoil<br />
Ochre<br />
0 100 200 300<br />
mm drainage<br />
Figure 2: Lysimeter leachate concentrations of EC, DOC, E. coli, NH 4<br />
-N,<br />
NO 3<br />
-N and PO 4<br />
-P for control (40 cm of subsoil) and ochre (10 cm of<br />
ochre and 30 cm of subsoil) lysimeters<br />
256
The results of the column experiment are summarised in Figure 3. These show that<br />
P removal by the ochre/straw w<strong>as</strong> nearly complete (equivalent to 92 kg P/ha), and N<br />
removal equivalent to 188 kg N/ha during addition of 450 kg N/ha occurred, relative<br />
to the sand only column. This confirms that the ochre and straw treatments have the<br />
potential to remove substantial quantities of P and N respectively, if the hydraulic<br />
properties are suitable.<br />
40<br />
mg/L NH4-N or SRP in leachate<br />
35<br />
30<br />
25<br />
20<br />
15<br />
10<br />
5<br />
column conditioning period<br />
( approx 6 days)<br />
mineral N, ochre+straw column<br />
mineral N, sand only column<br />
S oluble P, ochre+straw column<br />
S oluble P , s and only column<br />
188 kg N/ha removed<br />
92 kg P/ha removed<br />
0<br />
0 50 100 150 200 250 300 350 400 450 500<br />
cumulative N input kg/ha equivalent<br />
Figure 3: Mineral N and P in leachate of control column (sand) and ochre +<br />
straw column, receiving dilute slurry, showing removal of nutrients<br />
equivalent to 188 kg N/ha and 92 kg P/ha of slurry nutrients by the<br />
ochre + straw layers<br />
DISCUSSION<br />
The results show that the subsoil and ochre sublayers are both effective ways of<br />
attenuating pollutants (NH 4<br />
-N, TOC, faecal indicator organisms, P) from the leachate<br />
from corrals, at le<strong>as</strong>t in the short term. The mineralization and oxidation of N from<br />
the slurry leads to a rise in the nitrate concentration, which could create problems<br />
with Nitrate Vulnerable Zone compliance. However, the results also suggest that<br />
nitrate removal through denitrification is occurring; this will be greater than would<br />
occur where the faecal and urinary nitrogen w<strong>as</strong> deposited at lower rates (e.g. during<br />
overwintering in fields).<br />
The results interface closely with work on full-scale woodchip corrals (Vinten et al.,<br />
2006) which shows that freely drained sandy soil is working <strong>as</strong> an effective mitigator to<br />
prevent groundwater pollution by ammonium, organic carbon and faecal indicators,<br />
but that high nitrate concentrations below corrals occur. Further work to <strong>as</strong>sess the<br />
amount of denitrification under corrals is ongoing. It should be borne in mind that the<br />
nitrate leaching per unit area from such an installation can be very high, although the<br />
nitrate leaching per animal will be lower than where animals are more spread out in<br />
fields over winter.<br />
257
Results may be influential in determining whether attenuation through infiltration can<br />
be considered an acceptable method of pollution prevention under corrals on freely<br />
drained sites, <strong>as</strong> an alternative to lining. The leachate pollutant concentrations are at<br />
levels that would be considered indicative of very effective treatment, for example,<br />
from constructed wetlands.<br />
ACNOWLEDGEMENTS<br />
We acknowledge the support of SEERAD in funding the research.<br />
REFERENCES<br />
IDEXX Laboratories Inc. (2001). http://www.idexx.com/Water/Products/Colilert/<br />
index.cfm<br />
Krapac IG, Dey WS, Roy WR, Smyth CA, Storment E, Sarget SL and Steele JD (2002).<br />
Impacts of swine manure pits on groundwater quality. Environmental Pollution 120,<br />
475–492.<br />
Vinten AJA, Dougl<strong>as</strong> JT, Lewis DR, Aitken MN and Fenlon DR (2004). Relative risk of<br />
surface water pollution by E. coli derived from faeces of grazing animals compared<br />
to slurry application. Soil Use and Management 20, 13–22.<br />
Vinten AJA, Donnelly S, Ball BC, Crawford CE, Sym G, Ritchie RM and Parker<br />
JP (2006). A field trial to evaluate the pollution potential to ground and surface<br />
waters from woodchip corrals for overwintering livestock outdoors. Soil Use and<br />
Management (in press).<br />
258
RESPONSES TO WATER QUALITY PROBLEMS IN THE<br />
LEET CATCHMENT<br />
PE Widdison, TP Burt, DNM Donoghue and R Hudson<br />
Department of Geography, Durham University, Science Site, South Road, Durham,<br />
DH1 3LE, UK, E-mail: p.e.widdison@durham.ac.uk<br />
SUMMARY<br />
The study focuses on the Leet Water catchment, a left-bank tributary of the River<br />
Tweed, Berwickshire, south-e<strong>as</strong>t Scotland. The Leet Water and its subcatchment,<br />
the Lambden Burn, cover an area of approximately 114 km 2 within the Lothian<br />
and Borders Nitrate Vulnerable Zone (designated in 2002). Pollution impacts were<br />
modelled using a modified export coefficient approach by integrating land cover<br />
with available chemical and fertiliser data. Results of modelling scenarios of simple<br />
land use changes found that reducing fertiliser use by 10% can reduce the number<br />
of fields in the ‘very high-risk’ group from 191 to 16, equivalent to reducing the highrisk<br />
area from ~3255 ha (29% of the catchment) to ~428 ha (3.3% of the catchment).<br />
This method of water quality modelling provides a means of integrating field research<br />
on water quality with the results of socio-economic surveys.<br />
INTRODUCTION<br />
The study area, the Leet Water catchment, is a left-bank tributary of the River Tweed<br />
having its confluence at Coldstream, Berwickshire (NGR 3844 6395). The Leet Water<br />
and its subcatchment, the Lambden Burn, together cover an area of approximately<br />
114 km 2 . The area is largely rural, of low population and mainly agricultural. In contr<strong>as</strong>t<br />
to the f<strong>as</strong>ter flowing, upland streams in the Tweed B<strong>as</strong>in, the Leet and Lambden Burn<br />
are small and relatively slow flowing. These watercourses have been significantly<br />
altered in the p<strong>as</strong>t, in particular during land drainage schemes of the 1970s. This h<strong>as</strong><br />
contributed to problems of poor water quality in the catchment.<br />
Previous water quality monitoring by SEPA h<strong>as</strong> found high concentrations of nitrate<br />
and phosphate. Levels of N have often been above the EU Nitrate Directive permitted<br />
level (50 mg/L NO 3<br />
; 11.3 mg/L NO 3<br />
-n). Phosphate levels have been found to range<br />
from < 0.1 to 1 mg/L. Leet Water and the Lambden Burn have been cl<strong>as</strong>sed <strong>as</strong><br />
eutrophic (Institute of Hydrology, 1996).<br />
The export coefficient approach h<strong>as</strong> previously been applied to intensive lowland<br />
agricultural systems in the UK (Johnes, 1996; Johnes and Heathwaite, 1997). This<br />
model predicts the nutrient loading at any site in the drainage network of a catchment<br />
<strong>as</strong> a function of the export of nutrients from each source in the catchment above that<br />
site.<br />
MODELLING LAND USE CHANGE IN THE LEET WATER CATCHMENT<br />
In this study, the export coefficient model w<strong>as</strong> constructed using readily available<br />
data including:<br />
• spatial distribution of land use and fertilisers applied to each land use type;<br />
259
• numbers and distribution of livestock in the catchment;<br />
• input of nutrients to the catchments through nitrogen fixation and atmospheric<br />
deposition; and<br />
• export coefficients derived from literature sources to determine the rate of loss of<br />
nutrients from each source to the surface drainage network.<br />
This research had produced a land cover map for 2002 cl<strong>as</strong>sified from multispectral<br />
remote sensed data and aerial photography (Widdison, 2005). This w<strong>as</strong> used <strong>as</strong> the<br />
b<strong>as</strong>e map to calculate the extent of risk of N loss using the equation:<br />
n<br />
L = ∑Ei[Ai(Ii)]+ p<br />
(Johnes, 1996)<br />
i=1<br />
where: L is loss of nutrients; E is export coefficient for nutrient source I; A is the area<br />
occupied by land use type, number of livestock type i; I is the input of nutrients to<br />
source; p is the input of nutrients from precipitation.<br />
ArcGIS software w<strong>as</strong> used to calculate total N loss kg/ha/year on a per-field b<strong>as</strong>is.<br />
Using the 2002 land cover <strong>as</strong> a b<strong>as</strong>e map provided a spatial dimension of predicted<br />
output relevant to the main stakeholder group (i.e. the farming community). Results<br />
of the preliminary modelling found the agricultural area within the Leet catchment to<br />
be 11,213 hectares. Calculated total nutrient input (organic and inorganic fertilisers)<br />
w<strong>as</strong> a little over 2 million kg resulting in a total loss of nitrogen from the catchment<br />
of 285,540 kg, an average of 25.5 kg/ha/year. Table 1 summarises the results for<br />
land cover <strong>as</strong>sociated with the main farming activities. Cereal crops are the most<br />
significant land cover in terms of area, input and losses of total nitrogen, accounting<br />
for approximately 74% of the total land use and nitrogen input in the catchment but<br />
approximately 92% of the nutrient losses.<br />
Table 1:<br />
Nutrient export from agricultural sources in the Leet catchment<br />
(2002)<br />
Land cover source<br />
~Area<br />
ha<br />
% land<br />
cover<br />
Fertiliser<br />
inputs (kg)<br />
Total export of<br />
nitrogen (kg)<br />
% of the total<br />
loss of nutrients<br />
P<strong>as</strong>ture 1403 12.52 264017 17622 6.17<br />
Rough grazing 121 1.08 381 0.13<br />
Cereal crops* 8302 74 1743427 263168 92.2<br />
Wood & Hedge 530 4.73 1670 0.6<br />
Fallow & Set-<strong>as</strong>ide 333 2.97 1050 0.4<br />
*Includes three fields of potatoes (9.37 ha) which accounted for nutrient loss of 377kg.<br />
Furthermore, when the impacts of winter sown wheat and oilseed rape are examined,<br />
these account for approximately 47% of the total area and ~59% of nutrient losses<br />
(Table 2).<br />
260
Table 2: Nutrient export from winter wheat and winter oilseed rape (2002)<br />
Land cover source<br />
~Area<br />
Ha<br />
% land<br />
cover<br />
Fertiliser<br />
Inputs (kg)<br />
Total export of<br />
nutrients (kg)<br />
W. wheat 4763 42.5 1000261 135736 47.5<br />
W. oilseed rape 549 4.9 115296 35091 12.3<br />
% of total loss of<br />
nutrients<br />
These results illustrate the significance of cereal cropping, and in particular the<br />
significance of winter sown crops to the problems of nutrient export in the catchment<br />
<strong>as</strong> a whole.<br />
In the monitored sub-catchments, the average annual loss of N ranged from 18.25<br />
to 164 mg/L. The highest N losses (> 146 mg/L p.a.) occur in are<strong>as</strong> contributing to<br />
gauging stations in sub-catchments where arable land use is more than 80% so this<br />
can be seen to be one of the contributing factors to such high losses. Potential risk<br />
of N loss w<strong>as</strong> attributed to each field plot by establishing which plots lie within 50 m<br />
of the watercourses and therefore pose the greatest threat to water quality. Using a<br />
combination of factors, the spatial distribution of N loss w<strong>as</strong> presented in ArcGIS <strong>as</strong><br />
risk maps to be used by stakeholders <strong>as</strong> part of a suite of land use decision-making<br />
tools.<br />
The Nutrient Export Risk Maps for the Leet Water Catchment<br />
Relative risk w<strong>as</strong> <strong>as</strong>signed using weighted values for a range of criteria; when<br />
these are combined with a weighting for proximity to a water-course, a combined<br />
risk score can be calculated. Weighting values ranging from 1–5 were given to the<br />
parameters shown in Table 3 below. For land use, nutrient input and export the full<br />
range of weighted values were available for each field. However, for distance from<br />
watercourse, the weight range w<strong>as</strong> restricted to reflect the significant contribution of<br />
field drains to potential nutrient loss.<br />
Table 3:<br />
Weighted values for parameters in risk <strong>as</strong>sessment<br />
Land use<br />
Nutrient input<br />
kg/ha/year<br />
Daily nutrient<br />
export N<br />
(mg/L)<br />
Distance from<br />
water course (m)<br />
Woodland 0 0–0.09 1<br />
Fallow/set-<strong>as</strong>ide 1–99 0.1–0.19 > 50 2<br />
Grazing 100–199 0.2–0.29 3<br />
Spring cereals 200–249 0.3–0.39 11–50 4<br />
Winter cereals > 250 > 0.4 0–10 5<br />
Weighted<br />
value for each<br />
variable<br />
This enabled a total risk <strong>as</strong>sessment score of up to a maximum of 20 points to be<br />
<strong>as</strong>signed to each field plot. Risk w<strong>as</strong> then cl<strong>as</strong>sified into five categories b<strong>as</strong>ed on<br />
the following intervals:<br />
Very low risk<br />
Low risk<br />
Medium risk<br />
High risk<br />
Very high risk<br />
1 – 4 points<br />
5 – 8 points<br />
9 – 12 points<br />
13 – 16 points<br />
17 – 20 points.<br />
261
Using this method of cl<strong>as</strong>sification allowed a much more realistic <strong>as</strong>sessment of the<br />
level of risk that each field plot contributed to water quality in the catchment. These<br />
results, Figure 1 and summarised in Table 4 below, show there were no fields in the<br />
very low risk category. This is because the proximity to water course weighting<br />
forces a minimum possible score of 5 points.<br />
Table 4:<br />
Summary results of risk <strong>as</strong>sessment of 2002 land use<br />
Number of field plots<br />
in category<br />
Approximate area Approximate<br />
(ha)<br />
N loss (mg/l)<br />
Very low risk 0 0 0<br />
Low risk 922 3120 184<br />
Medium risk 414 2219 101<br />
High risk 569 3717 363<br />
Very high risk 191 3256 345<br />
Modelling Land Use Change Scenarios<br />
Although it is not possible to predict a precise moment when nutrient loss will exceed<br />
the EU limit, the export coefficient model can be applied to predict the impact of<br />
changing land use on nutrient losses at the field scale. This modelling will be useful<br />
to the farming community <strong>as</strong> it can provide information to be used in their decision<br />
making processes. Currently the catchment includes 74% arable land use which is<br />
responsible for 87% of total fertiliser input and 92% of the total predicted nutrient<br />
loss. The four scenarios described below involve changing the way in which arable<br />
farming is practised.<br />
The predicted impacts of the scenario modelling are shown in Table 5 below. The<br />
first land use change scenario involves the installation of fixed width gr<strong>as</strong>sland<br />
buffers at 5 or 10 m, to all water courses in the catchment. These buffers would<br />
remove approximately 150–320 ha of land from production, of which approximately<br />
90–190 ha are currently used for arable production. As part of the management of<br />
these buffers, it is <strong>as</strong>sumed that fencing is installed to prevent livestock accessing the<br />
stream; application of chemicals including fertilisers ce<strong>as</strong>es; and most importantly, all<br />
field drains discharging to streams are blocked to prevent nutrient losses by-p<strong>as</strong>sing<br />
the buffer. In the short-term, vegetation would return to rough gr<strong>as</strong>sland, although<br />
further management of the buffer could include planting native species woodland<br />
which would incre<strong>as</strong>e nitrate removal in these zones. In these two scenarios nitrogen<br />
input is limited to that from atmospheric deposition (3.15 kg/ha/year) therefore the<br />
total N loss is recalculated using the export coefficient for land in set-<strong>as</strong>ide/woodland.<br />
Installing fixed width buffers results in N losses being reduced by 0.16–0.25% for the<br />
whole catchment. In terms of benefits for the farming community, fertiliser usage<br />
is reduced by 1.17% to 2.47% of the existing use and this would reduce the cost.<br />
However, this would have to be balanced by the loss in income from grain sales on<br />
these buffers.<br />
The buffer scenario w<strong>as</strong> further investigated by changing the buffer to 50 m. In<br />
an intensive arable regime, the land within 50 m of the water course can make a<br />
significant contribution to nutrient loss. Under current farming practices, there are a<br />
262
significant number of arable fields adjacent to the water course without any buffers.<br />
Therefore the majority of fields are cl<strong>as</strong>sified <strong>as</strong> high or very high risk. With the<br />
implementation of a 50-m buffer, risk is reduced to low. When applied to the whole<br />
of the catchment there is a net reduction of total N losses of 1.86%. However,<br />
implementing such large buffers may not be acceptable to farmers with smaller<br />
farming units <strong>as</strong> this will remove a greater proportion of their land from economic<br />
production.<br />
The second scenario investigated reducing fertiliser use (by 10% or 20%) on the<br />
existing land use regime. The results found that nutrient losses for the whole of<br />
the catchment were 8.8% and 17.5% respectively. The third scenario examined<br />
the impact of a radical change in land use. Table 5 shows that if all arable land use<br />
w<strong>as</strong> changed to permanent p<strong>as</strong>ture (i.e. only livestock farming is practiced), nutrient<br />
losses are predicted to be 55% less than they would be under the current intensive<br />
arable regime. However, a livestock-dominated farming system is not popular. This<br />
is because cereal production is seen to be more profitable than livestock farming.<br />
But more importantly to the farming community, the recent outbreak of foot and<br />
mouth dise<strong>as</strong>e and previous impacts of BSE have shown how vulnerable livestock<br />
can be to contagious or infectious dise<strong>as</strong>es and farmers would be very reluctant to<br />
specialise.<br />
The final scenario is the most radical model, requiring all agricultural land (including<br />
p<strong>as</strong>ture land) to be taken out of production and converted to woodland. Although this<br />
would reduce the current annual nutrient loss from approximately 902 to 111 mg/L,<br />
the economic, social and environmental impacts are extreme. Assuming plantation<br />
woodland takes over, this takes upward of 30 years to mature before felling takes<br />
place and an economic return made, so this would not be economically viable for<br />
the current farming community. In terms of social change, the range of employment<br />
activities in the local area would alter <strong>as</strong> the specialised skills of forestry workers<br />
and the number of workers required change. In environmental terms, although<br />
nitrate losses would reduce, there would be incre<strong>as</strong>ed acidification of water courses,<br />
leading to a decline of aquatic biodiversity. Terrestrial biodiversity would also change<br />
<strong>as</strong> existing wildlife habitats were destroyed.<br />
263
Table 5:<br />
Results of land use scenario modelling (catchment scale)<br />
Land use scenario<br />
Land removed from<br />
production (ha)<br />
Arable land removed (ha)<br />
Existing land<br />
use contributes<br />
annual<br />
N loss of<br />
Scenario land<br />
use contributes<br />
N losses<br />
kg/year mg/L kg/year mg/L<br />
% net reduction N loss<br />
5m buffer 152.7 90.6 3257.1 10.3 480.6 1.48 0.16<br />
10m buffer 317.3 192.7 6896.9 21.3 9985.9 2.28 0.25<br />
50m buffer 1685.9 1112.3 39158.1 123.6 5310.4 16.24 1.86<br />
10%reduction<br />
of fertiliser<br />
0 0 285540 902.3 260518.6 823.22 8.8<br />
20% reduction<br />
of fertiliser<br />
0 0 285540 902.3 235496.9 744.15 17.5<br />
Convert all<br />
arable land<br />
to permanent<br />
0 8635.9 285540 902.3 126567.7 400.4 55.6<br />
p<strong>as</strong>ture<br />
Convert all<br />
agricultural<br />
land to wood<br />
10160.9 8635.9 285540 902.3 35323.6 110.9 87.7<br />
264
In terms of the risk <strong>as</strong>sessment for each field, Table 6 shows that even a 10% reduction<br />
in fertiliser use can have a significant impact on each field. Under the current farming<br />
practice of using the maximum recommended fertiliser rates, 191 fields are cl<strong>as</strong>sified<br />
<strong>as</strong> very high risk (Figure 1) but this number is reduced to 16 with a 10% reduction in<br />
fertiliser use (Figure 2) and to 13 fields with a 20% reduction in fertiliser. This also h<strong>as</strong><br />
a knock-on effect on fields cl<strong>as</strong>sified <strong>as</strong> high or medium risk.<br />
Table 6:<br />
Impact of fertiliser reduction to the extent of risk (number of field<br />
plots)<br />
Very low<br />
risk<br />
Low risk<br />
Medium<br />
risk<br />
High risk<br />
Land use 2002 0 922 414 569 191<br />
10% reduction in<br />
fertiliser use<br />
0 922 642 516 16<br />
20% reduction in<br />
fertiliser use<br />
0 922 646 515 13<br />
Very high<br />
risk<br />
However, farmers believe this scenario would affect the grain outputs from arable<br />
production and the number of livestock units per hectare and therefore farm income.<br />
On the other hand, farm expenditure on chemical fertilisers and grain seed would be<br />
less. For example, at 2002 figures, fertiliser costs were £79–£105 ha depending on<br />
the chemical mix required for the range of crops grown.<br />
265
CONCLUSIONS<br />
As a decision support tool, the export coefficient approach h<strong>as</strong> many advantages.<br />
These include: simplicity in calculating nutrient loss; relatively few data requirements;<br />
use of a spreadsheet (datab<strong>as</strong>e) system; and coupling with GIS mapping, to provide a<br />
visual interpretation. Most importantly, it provides a robust and relatively inexpensive<br />
means of evaluating the impact of land use and management on water quality. The<br />
export coefficient approach enables a risk <strong>as</strong>sessment to be applied to each field<br />
plot in the catchment, and modelling land use change in a range of scenarios h<strong>as</strong><br />
shown that significant changes can be made to the risk <strong>as</strong>sociated with each field.<br />
ACKNOWLEDGEMENTS<br />
This research w<strong>as</strong> part of a joint ESRC/NERC PhD studentship [R42200134149]<br />
at Durham University. We gratefully acknowledge support from SEPA, Gal<strong>as</strong>hiels,<br />
including the provision of water quality data.<br />
REFERENCES<br />
Institute of Hydrology (1996). The water quality of the Tweed and its tributaries.<br />
Report no.128.<br />
Johnes PJ (1996). Evaluation and management of the impact of land use change on<br />
the nitrogen and phosphorus load delivered to ground waters: the export coefficient<br />
modelling approach. Journal of Hydrology 183, 323–349.<br />
Johnes PJ and Heathwaite AL (1997). Modelling the impact of land use change on<br />
water quality in agricultural catchments. Hydrological Processes 11, 269–286.<br />
Widdison P E (2005). Evaluating the impact of land use and policy on water quality in<br />
an agricultural catchment: the Leet Water, south-e<strong>as</strong>t Scotland, (Unpublished PhD)<br />
University of Durham, Durham, 305 pp.<br />
266
NITROGEN LOSSES AFTER CATTLE SLURRY<br />
APPLICATIONS TO A DRAINED CLAY SOIL<br />
JR Williams 1 , E Sagoo 1 , BJ Chambers 2 , RB Cross 1 , J Short 1 and<br />
RA Hodgkinson 2<br />
1<br />
ADAS Boxworth, Battlegate Road, Boxworth, Cambridge, CB3 8NN, UK,<br />
E-mail: john.williams@ad<strong>as</strong>.co.uk; 2 ADAS Gleadthorpe, Meden Vale, Mansfield,<br />
Notts., NG20 9PF, UK<br />
SUMMARY<br />
Nitrogen losses in drainage water were me<strong>as</strong>ured after autumn, winter and spring<br />
cattle slurry applications to a drained clay soil under arable and gr<strong>as</strong>sland farming<br />
over winter 2003/04. Mean nitrate losses were greatest (P
types. This paper reports results from the first year of a 3-year study to quantify the<br />
effects of different timings of cattle slurry application on nitrogen losses in water from<br />
a drained clay soil under arable and gr<strong>as</strong>sland management.<br />
MATERIALS AND METHODS<br />
The experiment w<strong>as</strong> carried out on a heavy clay textured (60% clay) soil of<br />
the Denchworth Association, at the Brimstone Farm experimental facility, near<br />
Faringdon in Oxfordshire. The site consists of 18 hydrologically isolated plots (each<br />
40 m x 48 m), which had been in arable production for over 20 years until autumn<br />
2001 when gr<strong>as</strong>sland w<strong>as</strong> established on nine plots. The soils are drained with pipe<br />
drains at 1 m depth and 48 m spacing, and have gravel backfill to within 30 m of the<br />
surface, with secondary mole drains at 2 m spacing and 50 cm depth at right angles<br />
to the pipe drains. Cattle slurry (c. 40 m 3 /ha, 120 kg/ha total N) w<strong>as</strong> applied to the<br />
arable and gr<strong>as</strong>sland plots in September and December 2003, and March 2004,<br />
using an 11-m 3 Joskin tanker fitted with a 12-m trailing hose boom. There were<br />
three replicates of each application timing. Inorganic nitrogen fertiliser w<strong>as</strong> applied<br />
all plots in early and late April 2004, using standard recommended rates, to ensure<br />
that subsequent crop growth w<strong>as</strong> representative of commercial practice.<br />
Drainage and surface run-off volumes were me<strong>as</strong>ured continuously using V-notch<br />
weirs. Drainage water samples were collected on a flow proportional b<strong>as</strong>is using<br />
automatic water samplers and analysed for nitrate-N, ammonium-N and soluble<br />
organic N (SON).<br />
RESULTS AND DISCUSSION<br />
Drainage Volumes<br />
Low rainfall volumes during autumn 2003 (70% of long-term average between 1st<br />
September and 30th November 2003) meant that drainage did not begin until the end<br />
of November 2003 on the arable plots, and mid-December on the gr<strong>as</strong>sland plots.<br />
A wet April, when rainfall w<strong>as</strong> 60% greater than the long-term average, meant that<br />
drainage continued until mid-May 2004. Mean drainflow volumes during the whole<br />
drainage period (up to mid-May 2004) were 77 mm from the gr<strong>as</strong>sland compared with<br />
130 mm from the arable plots (long-term arable mean drainage at Brimstone = 204<br />
mm). The lower drainage volumes and later return to field capacity on the gr<strong>as</strong>sland<br />
plots reflected the greater soil moisture deficit that had developed <strong>as</strong> the gr<strong>as</strong>s grew<br />
during the summer and early autumn. Surface run-off volumes were less than 7 mm<br />
on all plots.<br />
N Concentrations in Drainage Water<br />
On the arable plots, nitrate concentrations in drainage water up to late March 2004<br />
(until inorganic fertiliser N w<strong>as</strong> applied) were greatest (P0.05) on nitrate concentrations in drainage waters,<br />
probably <strong>as</strong> a result of the cold and wet soil conditions delaying the nitrification of<br />
slurry ammonium-N to nitrate-N. Nitrate concentrations declined on all the treatments<br />
to between 30–50 mg/L NO 3<br />
-N after c. 30 mm of drainage (Figure 1a), but remained<br />
above the EC limit of 11.3 mg/L NO 3<br />
-N throughout the drainage period.<br />
268
In contr<strong>as</strong>t, on the arable reversion gr<strong>as</strong>sland plots nitrate concentrations in drainage<br />
waters were low and generally below the EC limit throughout the drainage se<strong>as</strong>on.<br />
On these plots, there w<strong>as</strong> no effect (P>0.05) of slurry application timing (Figure 1b)<br />
on drainage water nitrate concentrations.<br />
a. Arable<br />
b. Gr<strong>as</strong>sland<br />
140<br />
140<br />
120<br />
120<br />
Nitrate-N concentration (mg/l)<br />
100<br />
80<br />
60<br />
40<br />
20<br />
Autumn<br />
Winter<br />
Spring<br />
EC limit 11.3 mg/l NO 3 -N<br />
Nitrate-N concentration (mg/l)<br />
100<br />
80<br />
60<br />
40<br />
20<br />
E C limit 11.3 mg/l NO3-N<br />
Autumn<br />
Winter<br />
Spring<br />
0<br />
20-Nov-03 09-Jan-04 28-Feb-04 18-Apr-04<br />
Date<br />
0<br />
20-Nov-03 09-Jan-04 28-Feb-04 18-Apr-04<br />
Date<br />
Figure 1: Mean nitrate-N concentrations in drainage water at Brimstone Farm<br />
(2003/04)<br />
The autumn and winter slurry applications had no effect on ammonium-N<br />
concentrations in drainage waters from either the arable or gr<strong>as</strong>s plots. In both<br />
instances, these remained below the EC Freshwater Fish Directive limit of 0.78 mg/L<br />
NH 4<br />
-N throughout the drainage se<strong>as</strong>on (Figure 2a and b). However, after the spring<br />
slurry application timing, when c. 20 mm of rain fell 9–12 days after the slurry w<strong>as</strong><br />
applied, ammonium-N concentrations peaked at 4.5 and 3.9 mg/L NH 4<br />
-N on the<br />
gr<strong>as</strong>sland and arable plots, respectively. These me<strong>as</strong>urements suggest that the<br />
rainfall soon after application had caused slurry nitrogen to move rapidly through the<br />
soil profile, via macropores (‘by-p<strong>as</strong>s’ flow), to the drains.<br />
a. Arable<br />
5<br />
b. Gr<strong>as</strong>sland<br />
5<br />
Ammonium-N concentration (mg/l)<br />
4<br />
3<br />
2<br />
1<br />
FFD limit 0.78 mg/l NH4-N<br />
Autumn<br />
Winter<br />
Spring<br />
Ammonium-N concentration (mg/l)<br />
4<br />
3<br />
2<br />
1<br />
FFD limit 0.78 mg/l NH4-N<br />
Autumn<br />
Winter<br />
Spring<br />
0<br />
20-Nov-03 09-Jan-04 28-Feb-04 18-Apr-04<br />
Date<br />
0<br />
20-Nov-03 09-Jan-04 28-Feb-04 18-Apr-04<br />
Date<br />
Figure 2: Mean ammonium-N concentrations in drainage water at Brimstone<br />
Farm (2003/04)<br />
269
N Losses in Drainage Water<br />
Mean nitrate losses up to the end of March 2004 (until fertiliser N w<strong>as</strong> applied) were<br />
greatest (P0.05) on nitrate leaching losses up to the end of March 2004. Losses from<br />
the autumn and winter applications were equivalent to 2% and 4% of the total N<br />
applied, respectively. The low nitrate leaching losses from the gr<strong>as</strong>sland system were<br />
probably a reflection of the recently established gr<strong>as</strong>s sward accumulating N within<br />
organic reserves and greater crop uptake of slurry N (c. 20 kg/ha N compared with<br />
less than 5 kg/ha N on the arable plots) in the period between application and the<br />
start of drainage.<br />
60<br />
50<br />
NO 3 -N<br />
NH 4 -N<br />
SON<br />
40<br />
N (kg/ha)<br />
30<br />
20<br />
10<br />
0<br />
Autumn Winter S pring Autumn Winter S pring<br />
Arable<br />
Gr<strong>as</strong>s<br />
Figure 3: Nitrogen leaching losses Brimstone Farm (2003/04)<br />
Ammonium-N losses were less than 0.2 kg/ha N from all the treatments. Soluble<br />
organic N losses ranged from 2.5 to 3.6 kg/ha N on the arable plots and 0.6 to<br />
0.8 kg/ha N on the gr<strong>as</strong>sland plots.<br />
CONCLUSIONS<br />
The data from the first year of this study indicate that drained arable clay soils may<br />
not be <strong>as</strong> retentive of slurry N <strong>as</strong> had previously been thought, although the arable<br />
reversion gr<strong>as</strong>sland plots were very nitrate retentive. Moving the timing of the slurry<br />
application to arable land from autumn to spring reduced nitrate leaching losses.<br />
However, applying slurry to ‘wet’ drained soils, where rainfall follows soon afterwards,<br />
can result in elevated drainflow ammonium-N concentrations (so called ‘pollution<br />
swapping’). This is particularly likely where there is good connectivity between the<br />
soil surface and drainage system via cracks/mole channels.<br />
270
ACKNOWLEDGEMENT<br />
Funding of this work by the UK Department for Environment, Food and Rural Affairs<br />
is gratefully acknowledged.<br />
REFERENCES<br />
Beckwith CP, Cooper RJ, Smith KA and Shepherd MA (1998). Nitrate leaching losses<br />
following application of organic manures to sandy soils in arable cropping. I. Effects<br />
of application time manure type over-winter crop cover and nitrification inhibition.<br />
Soil Use and Management 14, 123–130.<br />
Chambers BJ and Smith KA (1995). Management of farm manures: Economics and<br />
environmental considerations. Soil Use and Management 11, 150–151.<br />
Williams JR, Chambers BJ, Smith KA and Ellis S (2000). Farm manure land application<br />
strategies to conserve nitrogen within farming systems. In: Proceedings of the SAC/<br />
SEPA Conference, Agriculture and W<strong>as</strong>te Management for a Sustainable Future, The<br />
Scottish Agricultural College, Aberdeen AB21 9TR, pp. 167-179.<br />
Withers PJA, Davidson IH and Foy RH (2000). Prospects for controlling non-point<br />
phosphorus losses to water: a UK perspective. Journal of Environmental Quality 29,<br />
167–175.<br />
271
SOIL AND CROP MANAGEMENT EFFECTS ON<br />
SEDIMENT AND PHOSPHORUS CONCENTRATIONS IN<br />
RUN-OFF FROM AGRICULTURAL LAND<br />
PJA Withers, RA Hodgkinson and A Bates<br />
Catchment Management Group, ADAS Gleadthorpe, Meden Vale, Mansfield,<br />
Nottinghamshire NG20 9PF, UK, E-mail: paul.withers@ad<strong>as</strong>.co.uk<br />
SUMMARY<br />
To encourage the adoption of best management practices in a priority catchment<br />
(Hampshire Avon) in south-west England suffering diffuse pollution, surface runoff<br />
from field demonstration plots on different soil types and land management<br />
treatments w<strong>as</strong> monitored over two winter se<strong>as</strong>ons. Late drilling incre<strong>as</strong>ed run-off<br />
up to fivefold, and mobilisation of sediment and phosphorus (P) by up to an order<br />
of magnitude, compared with early drilling using traditional cultivation techniques.<br />
Tramlines running up-and-down slope generated significantly greater run-off, and<br />
often incre<strong>as</strong>ed run-off sediment and P concentrations, than where tramlines were<br />
absent, or running across-slope. Adopting reduced cultivations (minimum tillage)<br />
either decre<strong>as</strong>ed run-off, the mobilisation of sediment and P in run-off, or lessened<br />
the impact of tramlines. The results support the uptake of early drilling, timeliness of<br />
cultivations to avoid soil compaction, better tramline management and non-inversion<br />
cultivation techniques to help reduce agriculture’s impact on water quality.<br />
INTRODUCTION<br />
Sediment and phosphorus (P) concentrations in land run-off, and loads of these<br />
diffuse pollutants entering surface waters, are a major environmental concern and<br />
need to be controlled to acceptable levels in order to preserve or improve good water<br />
quality. Much of the agriculturally-derived P entering waterbodies via surface and subsurface<br />
run-off is <strong>as</strong>sociated with fine topsoil particles that have been enriched with<br />
P from previous P fertilisation (Edwards and Withers, 1998). Combinations of erosion<br />
vulnerable soils, over-cultivation presence of tramlines and lack of crop cover during<br />
storm events significantly incre<strong>as</strong>e the risk of sediment and P transport, and off-site<br />
impacts (Chambers et al., 2000). Control over run-off initiation and mobilisation of<br />
sediment is therefore an important part of the integrated approach to catchment<br />
management required for diffuse pollution control.<br />
In 1999, a catchment management initiative called Landcare w<strong>as</strong> started in the<br />
Hampshire Avon river b<strong>as</strong>in upstream of Salisbury, England to help reduce the<br />
agriculturally-derived loads of pollutants, particularly sediment and P entering the<br />
major tributaries (Huggins, 1999). As part of this initiative, farmer demonstration<br />
plots organised by the Environment Agency (EA) for farmers and their advisers were<br />
established at field sites on the three major lithologies that dominate the catchment:<br />
Upper Chalk (Wilton), Upper Greensand (Pewsey) and Kimmeridge Clay (E<strong>as</strong>t Knoyle).<br />
To supplement this demonstration activity, the plots were monitored over two winter<br />
periods (2002/03 and 2003/04) to provide supporting data that would encourage the<br />
adoption of more sensitive land management practices.<br />
272
MATERIALS AND METHODS<br />
The field sites contr<strong>as</strong>ted strongly in their soil characteristics, hydrology and P<br />
fertility. At Pewsey, the moderately sloping (5°), fine sandy soil (67% sand, Ardington<br />
Association) had been in arable cropping for many years with low levels of organic<br />
matter (c. 2.3% OM) and good levels of soil P fertility (c. 30 mg/kg Olsen-extractable<br />
P). The arable soil at Wilton w<strong>as</strong> a shallow, highly calcareous and free draining silty<br />
clay loam (Upton Association, 4.1% OM), but with steep slopes (8°) and very low<br />
levels of Olsen-extractable P (c.10 mg/kg). The heavy clay soil (28% clay, Whickham<br />
Association) at E<strong>as</strong>t Knoyle w<strong>as</strong> underdrained and contained a higher level of OM<br />
(5.1–8.6% OM) and soil P fertility (46–67 mg/kg Olsen-extractable P) than the other<br />
two sites, reflecting a history of gr<strong>as</strong>s-b<strong>as</strong>ed dairy farming including forage maize<br />
and frequent manure application.<br />
The demonstration plots were cultivated and drilled either early (E) or late (L), and<br />
adopted either traditionally cultivations (TC) or reduced cultivations (RC), providing<br />
four treatment combinations: E-TC, E-RC, L-TC and L-RC. The plots were not<br />
replicated but were large in size (20 x 20 m) <strong>as</strong> required for demonstration purposes.<br />
Site management w<strong>as</strong> under the control of the farmer using local cultivation practices.<br />
At Wilton in 2002/03, the farmer did not establish the late drilled treatments due to<br />
very wet weather, and at E<strong>as</strong>t Knoyle in 2003/04 the L-TC treatment w<strong>as</strong> replaced<br />
with an E-RC headland plot (hereafter referred to <strong>as</strong> ‘headland’) due to field size<br />
restrictions. Early drilling w<strong>as</strong> usually at the end of September (range 20 Sept. to 2<br />
Oct.), but late drilling varied from late October to early January depending on the<br />
weather.<br />
Traditional cultivation included ploughing (with or without a press), and either tine<br />
harrowing or power harrowing before drilling. For the reduced cultivation treatment,<br />
the farmers adopted either heavy discs (Pewsey and Wilton), or a heavy harrow<br />
(E<strong>as</strong>t Knoyle) instead of the plough (Table 1). The field at E<strong>as</strong>t Knoyle h<strong>as</strong> also been<br />
regularly subsoiled. At Wilton and Pewsey, the plots were drilled up-and-down slope<br />
and tramlines established after drilling by one or more tractor p<strong>as</strong>ses. At E<strong>as</strong>t Knoyle,<br />
the plots were drilled across-slope, except for the headland plot which w<strong>as</strong> drilled<br />
up-and-down slope. Residues from the previous crop were returned to the soil and<br />
all sites grew winter cereals in both years.<br />
On each demonstration plot, three run-off traps each me<strong>as</strong>uring 15 m long by<br />
2 m wide were installed to monitor sediment and P in surface run-off generated<br />
by successive storm events. At E<strong>as</strong>t Knoyle in 2002/03, prolonged wet weather<br />
prevented the installation of any run-off traps. The traps were hydrologically isolated<br />
using 30 cm deep stainless-steel dividers driven into the ground, and each trap<br />
contained a tramline. A collecting tray w<strong>as</strong> cemented in place at the bottom of<br />
each trap, and angled to direct the run-off to a 110-mm-diameter pipe, which fed<br />
directly into a 500 litre covered fibre gl<strong>as</strong>s tank. After each major rainfall event, the<br />
run-off that had collected in the tanks w<strong>as</strong> me<strong>as</strong>ured and recorded, and a 250-mL<br />
sub-sample taken for determination of suspended sediment (SS), total P (TP) and<br />
dissolved P (DP, < 0.45 mm).<br />
The traps were installed <strong>as</strong> soon <strong>as</strong> w<strong>as</strong> practicable after drilling and removed in<br />
April to allow fertilizer and spraying operations on the field. For the early-drilled<br />
273
treatments, typically 10 storm events were monitored, while c. five events were<br />
monitored for the late-drilled treatments. To investigate the effect of tramlines, three<br />
additional replicate traps without a tramline were installed on selected treatments at<br />
Pewsey, including an off-plot area where the tramlines were running across the slope<br />
instead of up and down slope. Rainfall amount and intensity were me<strong>as</strong>ured at each<br />
site with an automatic rain gauge, supplemented <strong>as</strong> necessary with data from the<br />
nearest meteorological station. As there w<strong>as</strong> no replication of the four main treatment<br />
combinations, data from the individual run-off traps were taken <strong>as</strong> independent<br />
treatment replicates and treatment effects analysed using one-way ANOVA using<br />
Genstat.<br />
RESULTS<br />
Cultivation Effects<br />
Prolonged heavy rain fell approximately 2 weeks after early drilling in 2002/03<br />
causing surface compaction (capping) of the soil surface on the E-TC treatment at<br />
Pewsey, which generated twice <strong>as</strong> much run-off compared to the E-RC treatment<br />
where surface straw residues gave some protection from raindrop impact (Figure 1).<br />
The greater run-off mobilised significantly more sediment and P, with twofold greater<br />
flow-weighted SS and TP concentrations on the ploughed soil (Figure 1). Cumulative<br />
exports of SS and TP over the whole monitoring period were consequently incre<strong>as</strong>ed<br />
fivefold (up to 0.5 t/ha) and fourfold (up to and 0.4 kg/ha), respectively on the E-TC<br />
treatment compared with the E-RC treatment. In contr<strong>as</strong>t on the chalk soil, where<br />
run-off volumes were much lower, there w<strong>as</strong> no effect of cultivation method on runoff,<br />
although sediment and P mobilisation w<strong>as</strong> significantly lower on the reduced<br />
cultivated treatments due to the presence of crop cover (Figure 1). Hence, the<br />
exports of SS and TP were still fivefold and twofold, respectively greater on the E-<br />
TC treatment than on the E-RC treatment. The late-drilled treatments were installed<br />
only at Pewsey in 2002/03 and little rain fell afterwards, resulting in no significant<br />
treatment effects.<br />
Figure 1: Effect of cultivation method on run-off and flow-weighted TP<br />
concentrations in run-off at Pewsey and Wilton in 2002/03<br />
274
In 2003/04, heavy rain fell after the late-drilled treatments were established, again<br />
causing capping of the soil surface on the sandy soil at Pewsey with rill erosion down<br />
the tramlines. This rain also caused gushing of run-off down the tramlines on some<br />
traps on the L-RC treatment at Wilton, and incre<strong>as</strong>ed run-off from the headland area<br />
at E<strong>as</strong>t Knoyle (Table 1). Consequently, run-off volumes were up to c. fivefold greater<br />
on the late-drilled treatments than on the early-drilled treatments. As in the first year,<br />
the incre<strong>as</strong>ed run-off mobilised significantly more sediment and P on the ploughed<br />
soil compared with the reduced cultivated soil at Pewsey (Table 1). At Wilton, flowweighted<br />
SS and TP concentrations were incre<strong>as</strong>ed on the L-RC treatment but not<br />
significantly so. However at E<strong>as</strong>t Knoyle, flow-weighted SS and P concentrations<br />
were significantly lower in the run-off on the headland area, perhaps reflecting a more<br />
consolidated surface that w<strong>as</strong> more resistant to sediment entrainment. Sufficient<br />
crop cover had developed on the early drilled treatments at all sites in 2003/04 to<br />
prevent accelerated sediment and P mobilisation, and there were no significant soil<br />
cultivation treatment effects. Mean cumulative sediment and TP export ranged up<br />
to 0.8 t/ha and 0.6 kg/ha in 2003/04, with the majority (60-97%) of the TP export in<br />
particulate (> 0.45 mm) form at all three sites (Table 1).<br />
Table 1:<br />
Treatment effects on cumulative run-off volume, and loads of SS, TP<br />
and DP at each site in 2003/04. Flow-weighted concentrations (g/L<br />
for SS and mg/L for TP and DP) are given in brackets<br />
Site Run-off SS TP DP<br />
Treatment (mm) (kg/ha) (g/ha) (g/ha)<br />
Pewsey<br />
E-TC 3.2 77 (2.3) 48 (1.5) 3 (0.08)<br />
E-RC 3.2 57 (1.8) 38 (1.1) 4 (0.12)<br />
L-TC 15.8 650 (4.3) 548 (3.6) 31 (0.18)<br />
L-RC 14.1 184 (1.3) 183 (1.3) 23 (0.16)<br />
Significance *** *** *** **<br />
l.s.d. 129 107 17<br />
E<strong>as</strong>t Knoyle<br />
E-TC 1.5 49 (3.2) 47 (3.0) 5 (0.32)<br />
E-RC 2.5 75 (3.3) 72 (3.2) 9 (0.39)<br />
Headland 9.7 70 (0.7) 148 (1.4) 19 (0.22)<br />
L-RC 1.8 32 (1.7) 30 (1.6) 5 (0.28)<br />
Significance NS NS *<br />
l.s.d. 9<br />
Wilton<br />
E-TC 2.0 63 (2.8) 51 (2.3) 3 (0.12)<br />
E-RC 2.4 43 (1. 8) 39 (1.6) 2 (0.07)<br />
L-TC 5.0 150 (3.0) 97 (2.0) 12 (0.06)<br />
L-RC 13.2 787 (4.6) 583 (3.4) 3 (0.10)<br />
Significance NS NS NS NS<br />
*, ** and *** denotes significance at the 5%, 1% and 0.1% level, respectively. NS, not<br />
significant; l.s.d., le<strong>as</strong>t significant difference.<br />
275
Tramline Effects<br />
In both years, observations of flow rates from the traps during storm events indicated<br />
that the tramlines might be having a significant impact on run-off, sediment and P<br />
export. Run-off w<strong>as</strong> being initiated sooner in the tramlines than in the surrounding<br />
soil, and me<strong>as</strong>urements at Pewsey in both 2002/03 and 2003/04 showed significantly<br />
(P < 0.001) more run-off (on average +46%, or 1–2 mm in total over the monitoring<br />
period) from tramlined than from non-tramlined are<strong>as</strong> (Figure 2). The greater run-off<br />
down the tramlines also incre<strong>as</strong>ed flow-weighted concentrations of SS and TP twoto<br />
threefold (up to 4 g SS/L and 4 mg TP/L) on the ploughed soils, but there w<strong>as</strong><br />
no significant effect of tramlines on sediment and P concentrations in run-off from<br />
the reduced-cultivated soils. Greatest entrainment of sediment and P w<strong>as</strong> obtained<br />
where the tramline w<strong>as</strong> more indented by the tractor tyres, and when the tyre lugs<br />
were pointing in a downward Ú rather than in an upward Ù direction. For example in<br />
2002/03, tramlines were 10 mm deeper and more incised on the E-TC treatment than<br />
on the E-RC treatment.<br />
Figure 2: Rainfall-run-off relationships for traps on the early-drilled<br />
treatments with and without tramlines at Pewsey<br />
DISCUSSION<br />
Treatment effects on run-off and subsequent entrainment of soil particles and<br />
<strong>as</strong>sociated P were site specific depending on soil and site characteristics, and were<br />
variable between years depending on weather patterns. At Pewsey, the inherent<br />
vulnerability of the fine sandy soil to capping when there w<strong>as</strong> little crop cover w<strong>as</strong> the<br />
main factor causing incre<strong>as</strong>ed run-off and erosion. There w<strong>as</strong> little the farmer could<br />
have done to prevent this in 2002/03 using traditional ploughing, whilst in 2003/04 it<br />
did not rain appreciably until after the late-drilled treatments were established, and<br />
under these circumstances, the beneficial effects of early drilling were considerable.<br />
These data provide the first quantitative evidence of the effects of capping and late<br />
drilling on run-off, and the resulting impacts on the mobilisation of sediment and P.<br />
276
The soils at Wilton and E<strong>as</strong>t Knoyle were not <strong>as</strong> erosion vulnerable <strong>as</strong> at Pewsey<br />
probably due to the more stable soil structure resulting from their higher clay, organic<br />
matter and/or calcium carbonate contents. The key factors influencing run-off rates<br />
on the chalkland site were timeliness of cultivation and the presence of tramlines<br />
running up-and-down slope, which concentrated the flow. The comparatively low<br />
run-off volumes and export of SS and P at E<strong>as</strong>t Knoyle reflect the beneficial effects<br />
of subsoiling, and drilling across-slope, even though the site w<strong>as</strong> relatively flat. The<br />
consistent beneficial effects of non-inversion cultivation methods in reducing run-off,<br />
and/or SS and P mobilisation under heavy rain at Pewsey and Wilton support earlier<br />
work (Carter, 1998). These benefits reflect both better crop cover and improved<br />
resilience to trafficking after drilling. The lack of any effect of reduced cultivation on<br />
the heavier clay soil at E<strong>as</strong>t Knoyle can be related to the lack of crop residue cover<br />
afforded by maize stubble.<br />
In our study, run-off volumes were incre<strong>as</strong>ed by up to 65% and SS and TP loads<br />
were incre<strong>as</strong>ed up to five- and fourfold, respectively, where tramlines were present.<br />
Earlier initiation of run-off, the lack of any crop cover to protect the soil and the<br />
channelling effect created by the depth and pattern of indentation left by the lugs<br />
of the tractor tyre were key contributory factors. Variation in the impact of tramlines<br />
will depend on the extent to which these key factors are represented. These data<br />
strongly suggest that the timing of tramline establishment in relation to antecedent<br />
soil moisture conditions can have an important influence on the risk of incre<strong>as</strong>ed runoff<br />
and erosion from these soils.<br />
ACKNOWLEDGEMENTS<br />
This work w<strong>as</strong> jointly funded by the European Commission (DESPRAL project EVK1-<br />
CT-1999-00007), Defra and the Environment Agency (EA). The authors also thank<br />
Mr. A. Drake, Mr. T. Goodman and Mr R. Butler for hosting the demonstration plots<br />
on their land, and to Mr. C. Westcott (EA) for organising catchment stakeholder<br />
discussion.<br />
REFERENCES<br />
Carter MR (1998). Conservation tillage practices and diffuse pollution. In: T Petchey,<br />
B D’Arcy and A Frost (eds.) Non-Point Pollution II, pp. 51-60. The Scottish Agricultural<br />
College, Aberdeen, UK.<br />
Chambers BJ, Garwood TWD and Unwin RJ (2000). Controlling soil water erosion and<br />
phosphorus losses from arable land in England and Wales. Journal of Environmental<br />
Quality 29, 145–150.<br />
Edwards AC and Withers PJA (1998). Soil phosphorus management and water<br />
quality: a UK perspective. Soil Use and Management 14, 124–130.<br />
Huggins R (1999). The Landcare project. In: T Petchey, B D’Arcy and A Frost (eds.)<br />
Non-Point Pollution II, pp. 145-152. The Scottish Agricultural College, Aberdeen,<br />
UK.<br />
277
Notes<br />
278
www.sac.ac.uk<br />
www.sepa.org.uk<br />
ISBN 1-901322-63-7 £35.00