Optical and energy-loss spectra of the antiferromagnetic transition ...
Optical and energy-loss spectra of the antiferromagnetic transition ...
Optical and energy-loss spectra of the antiferromagnetic transition ...

You also want an ePaper? Increase the reach of your titles
YUMPU automatically turns print PDFs into web optimized ePapers that Google loves.
PHYSICAL REVIEW B 86, 235122 (2012)<br />
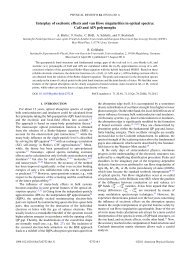
<strong>Optical</strong> <strong>and</strong> <strong>energy</strong>-<strong>loss</strong> <strong>spectra</strong> <strong>of</strong> <strong>the</strong> <strong>antiferromagnetic</strong> <strong>transition</strong> metal oxides<br />
MnO, FeO, CoO, <strong>and</strong> NiO including quasiparticle <strong>and</strong> excitonic effects<br />
Claudia Rödl <strong>and</strong> Friedhelm Bechstedt<br />
Institut für Festkörper<strong>the</strong>orie und -optik, Friedrich-Schiller-Universität <strong>and</strong> European Theoretical Spectroscopy Facility (ETSF),<br />
Max-Wien-Platz 1, 07743 Jena, Germany<br />
(Received 12 October 2012; published 17 December 2012)<br />
We calculate <strong>the</strong> frequency-dependent dielectric function for <strong>the</strong> series <strong>of</strong> <strong>antiferromagnetic</strong> <strong>transition</strong> metal<br />
oxides (TMOs) from MnO to NiO using many-body perturbation <strong>the</strong>ory. Quasiparticle, excitonic, <strong>and</strong> localfield<br />
effects are taken into account by solving <strong>the</strong> Be<strong>the</strong>-Salpeter equation in <strong>the</strong> framework <strong>of</strong> collinear spin<br />
polarization. The optical <strong>spectra</strong> are based on electronic structures which have been obtained using densityfunctional<br />
<strong>the</strong>ory with a hybrid functional containing screened exchange (HSE03) <strong>and</strong> a subsequent quasiparticle<br />
calculation in <strong>the</strong> GW approximation to describe exchange <strong>and</strong> correlation effects adequately. These sophisticated<br />
quasiparticle b<strong>and</strong> structures are mapped to electronic structures resulting from <strong>the</strong> computationally less expensive<br />
GGA+U+ scheme that includes an on-site interaction U <strong>and</strong> a scissors shift <strong>and</strong> allows us to calculate <strong>the</strong><br />
large number <strong>of</strong> electronic states that is necessary to construct <strong>the</strong> Be<strong>the</strong>-Salpeter Hamiltonian. For an accurate<br />
description <strong>of</strong> <strong>the</strong> optical <strong>spectra</strong>, an appropriate treatment <strong>of</strong> <strong>the</strong> strong electron-hole attraction is m<strong>and</strong>atory<br />
to obtain agreement with <strong>the</strong> experimentally observed absorption-peak positions. The itinerant s <strong>and</strong> p states as<br />
well as <strong>the</strong> localized <strong>transition</strong> metal 3d states have to be considered on an equal footing. We find that a purely<br />
atomic picture is not suitable to underst<strong>and</strong> <strong>the</strong> optical absorption <strong>spectra</strong> <strong>of</strong> <strong>the</strong> TMOs. Reflectivity <strong>spectra</strong>,<br />
absorption coefficients, <strong>and</strong> <strong>loss</strong> functions at vanishing momentum transfer are computed in a wide <strong>spectra</strong>l range<br />
<strong>and</strong> discussed in light <strong>of</strong> <strong>the</strong> available experimental data.<br />
DOI: 10.1103/PhysRevB.86.235122<br />
PACS number(s): 71.35.Cc, 71.45.Gm, 78.20.Bh, 75.50.Pp<br />
I. INTRODUCTION<br />
The series <strong>of</strong> <strong>transition</strong> metal (TM) oxides (TMOs) from<br />
MnO to NiO possesses a unique variety <strong>of</strong> physical properties. 1<br />
The partially filled 3d shells which energetically overlap<br />
with <strong>the</strong> oxygen 2p <strong>and</strong> TM 4s states evoke an intricate<br />
interplay between lattice, orbital, <strong>and</strong> spin degrees <strong>of</strong> freedom.<br />
All four materials crystallize in rock-salt structure in <strong>the</strong>ir<br />
paramagnetic phase. However, below <strong>the</strong>ir respective Néel<br />
temperatures, <strong>the</strong>y become <strong>antiferromagnetic</strong>. The magnetic<br />
phase <strong>transition</strong> is accompanied by structural distortions that<br />
are not yet fully understood from a <strong>the</strong>oretical point <strong>of</strong> view. 2–4<br />
Despite <strong>the</strong>ir only partially filled 3d shells, <strong>the</strong> TMOs are<br />
insulating above as well as below <strong>the</strong> Néel temperature. This<br />
surprising behavior has puzzled <strong>the</strong>oretical physicists since <strong>the</strong><br />
early days <strong>of</strong> solid-state physics. 5,6 To describe <strong>the</strong> peculiar<br />
electronic structures <strong>of</strong> <strong>the</strong> TMOs, <strong>the</strong>oretical approaches that<br />
treat both <strong>the</strong> itinerant s <strong>and</strong> p <strong>and</strong> <strong>the</strong> strongly localized d<br />
states with <strong>the</strong> same accuracy are indispensable. Historically,<br />
two lines <strong>of</strong> research emerged. One approach started from <strong>the</strong><br />
atomic states <strong>of</strong> <strong>the</strong> TM ions <strong>and</strong> incorporated <strong>the</strong> effects <strong>of</strong> <strong>the</strong><br />
crystalline environment in a perturbational way, first in cluster<br />
approximations, 7 <strong>and</strong> later by means <strong>of</strong> a bath in dynamical<br />
mean-field <strong>the</strong>ory. 8,9 The second line <strong>of</strong> research has its<br />
origins in semiconductor physics. B<strong>and</strong>-structure calculations<br />
in density-functional <strong>the</strong>ory 10,11 (DFT) using (semi-)local<br />
exchange-correlation functionals were carried out for <strong>the</strong><br />
TMOs. 12 It turned out that a more advanced treatment <strong>of</strong><br />
exchange <strong>and</strong> correlation is necessary to obtain b<strong>and</strong> gaps <strong>and</strong><br />
densities <strong>of</strong> states in agreement with spectroscopic data, e.g.,<br />
from photoemission. Nowadays, various approaches that differ<br />
in accuracy <strong>and</strong> computational workload are available: an<br />
on-site interaction term U is added to <strong>the</strong> exchange-correlation<br />
functional, 13,14 generalized Kohn-Sham equations with hybrid<br />
functionals are solved, 15,16 or many-body perturbation <strong>the</strong>ory<br />
in Hedin’s GW approximation 17 is applied ei<strong>the</strong>r in a selfconsistent<br />
scheme 18 or perturbationally on top <strong>of</strong> an advanced<br />
starting electronic structure. 19–21 The two lines <strong>of</strong> research<br />
basically meet again <strong>and</strong> describe <strong>the</strong> electronic structures <strong>of</strong><br />
<strong>the</strong> TMOs with comparable precision. However, <strong>the</strong> TMOs<br />
are still considered a stringent test bed for new methods in<br />
electronic-structure <strong>the</strong>ory.<br />
Considering <strong>the</strong> strong research activity to underst<strong>and</strong> <strong>the</strong><br />
one-particle excitation properties <strong>of</strong> <strong>the</strong> TMOs, in particular<br />
<strong>the</strong> b<strong>and</strong> gaps <strong>and</strong> photoemission <strong>spectra</strong>, it is ra<strong>the</strong>r surprising<br />
how little attention has been paid to <strong>the</strong> calculation <strong>of</strong> <strong>the</strong>ir<br />
optical properties. The absorption <strong>spectra</strong> <strong>of</strong> <strong>the</strong>se materials<br />
have been measured decades ago, 22–24 but have not yet been<br />
explained satisfactorily by means <strong>of</strong> state-<strong>of</strong>-<strong>the</strong>-art <strong>the</strong>oretical<br />
simulations, even though <strong>the</strong>y provide useful information<br />
about both <strong>the</strong> electronic structure <strong>and</strong> <strong>the</strong> excitonic pair<br />
excitations in <strong>the</strong>se materials. With <strong>the</strong> present paper, we want<br />
to overcome this lack <strong>of</strong> knowledge.<br />
In a recent article, 20 we discussed <strong>the</strong> one-particle excitation<br />
<strong>spectra</strong> <strong>of</strong> <strong>the</strong> TMOs MnO, FeO, CoO, <strong>and</strong> NiO extensively.<br />
Quasiparticle electronic structures were calculated within <strong>the</strong><br />
G 0 W 0 approximation on top <strong>of</strong> a generalized Kohn-Sham<br />
b<strong>and</strong> structure that was obtained using <strong>the</strong> HSE03 hybrid<br />
functional. 25 Here, we go one step fur<strong>the</strong>r <strong>and</strong> compute<br />
<strong>the</strong> macroscopic dielectric functions, which provide insight<br />
into both <strong>the</strong> optical absorption properties <strong>of</strong> <strong>the</strong> TMOs<br />
<strong>and</strong> <strong>the</strong> <strong>energy</strong>-<strong>loss</strong> <strong>spectra</strong> at vanishing momentum transfer.<br />
Apart from individual quasiparticle excitations, <strong>the</strong> optical<br />
absorption is governed by excitonic states. The screened<br />
electron-hole attraction, which is responsible for <strong>the</strong> formation<br />
<strong>of</strong> excitons, is fully taken into account in our calculations by<br />
1098-0121/2012/86(23)/235122(11) 235122-1<br />
©2012 American Physical Society
CLAUDIA RÖDL AND FRIEDHELM BECHSTEDT PHYSICAL REVIEW B 86, 235122 (2012)<br />
solving <strong>the</strong> Be<strong>the</strong>-Salpeter equation 26,27 (BSE). This approach,<br />
which has been proven to be highly successful for simple sp<br />
semiconductors, 28–30 has recently been extended to magnetic<br />
systems. 31 The resulting optical <strong>spectra</strong> provide insight into<br />
<strong>the</strong> electronic structures <strong>of</strong> <strong>the</strong> TMOs in a large frequency<br />
range. Moreover, we are able to analyze <strong>the</strong> origin <strong>of</strong> <strong>the</strong><br />
absorption peaks in <strong>the</strong> experimental data. We observe striking<br />
similarities in <strong>the</strong> response functions <strong>of</strong> all four oxides, which<br />
allows us to derive general trends for <strong>the</strong> dominating excitation<br />
<strong>and</strong> screening mechanisms in <strong>the</strong>se materials.<br />
The paper is organized as follows: In Sec. II, we introduce<br />
<strong>the</strong> <strong>the</strong>oretical methods <strong>and</strong> summarize <strong>the</strong> computational<br />
details. The electronic quasiparticle b<strong>and</strong> structures <strong>of</strong> <strong>the</strong><br />
TMOs are discussed briefly in Sec. III. In Sec. IV, <strong>the</strong><br />
optical properties, i.e., dielectric functions, reflectivities, <strong>and</strong><br />
absorption coefficients, are presented, <strong>and</strong> a detailed analysis<br />
<strong>of</strong> <strong>the</strong> <strong>spectra</strong> is given. Fur<strong>the</strong>r, we compare our results to<br />
<strong>the</strong> available experimental data. In Sec. V, <strong>the</strong> <strong>loss</strong> functions<br />
<strong>of</strong> <strong>the</strong> TMOs are calculated <strong>and</strong> compared to electron-<strong>energy</strong><br />
<strong>loss</strong> (EEL) <strong>and</strong> inelastic x-ray scattering (IXS) measurements.<br />
Finally, a short summary is given <strong>and</strong> conclusions are drawn<br />
in Sec. VI.<br />
II. METHODS AND COMPUTATIONAL DETAILS<br />
The macroscopic frequency-dependent dielectric function<br />
ε(ω) is <strong>the</strong> key quantity for various spectroscopies. Its real <strong>and</strong><br />
imaginary parts describe <strong>the</strong> dispersion <strong>and</strong> absorption <strong>of</strong> light<br />
in matter <strong>and</strong> can be directly linked to <strong>the</strong> Fresnel reflectivity<br />
at normal incidence,<br />
√ ∣ R(ω) =<br />
ε(ω) − 1∣∣∣<br />
∣√ 2, (1)<br />
ε(ω) + 1<br />
<strong>and</strong> <strong>the</strong> optical absorption coefficient which is given by <strong>the</strong><br />
relation<br />
α(ω) = 2ω c Im√ ε(ω), (2)<br />
with c being <strong>the</strong> vacuum speed <strong>of</strong> light. EEL or IXS<br />
experiments, on <strong>the</strong> o<strong>the</strong>r h<strong>and</strong>, probe <strong>the</strong> imaginary part <strong>of</strong> <strong>the</strong><br />
inverse frequency- <strong>and</strong> wave-vector-dependent microscopic<br />
dielectric function. 32 However, in <strong>the</strong> limit <strong>of</strong> vanishing<br />
momentum transfer, <strong>the</strong> <strong>loss</strong> function −Im ε −1 (ω) can be<br />
derived from <strong>the</strong> macroscopic dielectric function according<br />
to <strong>the</strong> Adler-Wiser relation. 33,34<br />
The most essential prerequisite for <strong>the</strong> accurate calculation<br />
<strong>of</strong> <strong>the</strong> dielectric function is a reliable description <strong>of</strong> <strong>the</strong><br />
electronic states, taking exchange <strong>and</strong> correlation effects into<br />
account. This holds, in particular, for materials that contain<br />
both itinerant s <strong>and</strong> p states <strong>and</strong> strongly localized d states,<br />
where <strong>the</strong> most simple (semi-)local exchange-correlation<br />
functionals fail <strong>and</strong> more advanced approaches have to be<br />
employed. To capture <strong>the</strong> one-particle excitation properties,<br />
e.g., <strong>the</strong> quasiparticle b<strong>and</strong> gap, <strong>of</strong> <strong>the</strong> TMOs correctly, <strong>the</strong><br />
GW method is applied. In a second step, we solve <strong>the</strong> BSE to<br />
take into account excitonic effects, i.e., <strong>the</strong> screened Coulomb<br />
interaction between <strong>the</strong> electrons <strong>and</strong> holes that are created<br />
in <strong>the</strong> optical excitation process. The Be<strong>the</strong>-Salpeter ansatz<br />
permits us to include also <strong>the</strong> local-field effects to account for<br />
<strong>the</strong> inhomogeneity <strong>of</strong> <strong>the</strong> crystals.<br />
A. Electronic structure<br />
The electronic structures <strong>of</strong> <strong>the</strong> TMOs are computed using<br />
DFT <strong>and</strong> many-body calculations in <strong>the</strong> GW approximation as<br />
implemented in VASP. 35–37 The TM 3d <strong>and</strong> 4s orbitals as well<br />
as <strong>the</strong> oxygen 2s <strong>and</strong> 2p orbitals are considered as valence<br />
states. The electronic wave functions are exp<strong>and</strong>ed in plane<br />
waves up to cut<strong>of</strong>fs <strong>of</strong> 315 eV (MnO), 400 eV (FeO), 400 eV<br />
(CoO), <strong>and</strong> 325 eV (NiO), whereas <strong>the</strong> projector-augmented<br />
wave method is used to describe <strong>the</strong> electronic states in <strong>the</strong><br />
vicinity <strong>of</strong> <strong>the</strong> ions.<br />
In <strong>the</strong> calculations performed here, <strong>the</strong> small experimentally<br />
observed rhombohedral <strong>and</strong> tetragonal distortions 2,3,38 <strong>of</strong> <strong>the</strong><br />
cubic rock-salt structure, which occur in <strong>the</strong> TMOs below<br />
<strong>the</strong> Néel temperature, are neglected. The resulting changes in<br />
<strong>the</strong> electronic structure, i.e., b<strong>and</strong> splittings due to <strong>the</strong> lower<br />
symmetry <strong>of</strong> <strong>the</strong> distorted unit cells, are small <strong>and</strong> cannot be<br />
resolved in <strong>the</strong> optical absorption <strong>spectra</strong>. We assume lattice<br />
constants <strong>of</strong> 8.863 Å (MnO), 8.666 Å (FeO), 8.499 Å(CoO),<br />
<strong>and</strong> 8.341 Å (NiO), chosen such that <strong>the</strong> volume <strong>of</strong> <strong>the</strong> cubic<br />
cell coincides with <strong>the</strong> volume that is experimentally observed<br />
for <strong>the</strong> distorted structures. 2,3,39<br />
As demonstrated earlier, 20,31 <strong>the</strong> electronic structures <strong>of</strong><br />
<strong>the</strong>se materials can be well described by GW calculations<br />
in <strong>the</strong> perturbative G 0 W 0 one-shot approach, starting from a<br />
generalized Kohn-Sham electronic structure that is computed<br />
self-consistently in DFT using <strong>the</strong> HSE03 (Ref. 25) hybrid<br />
density functional. For fur<strong>the</strong>r details as well as for an elaborate<br />
discussion <strong>of</strong> <strong>the</strong> resulting b<strong>and</strong> gaps, quasiparticle b<strong>and</strong> structures,<br />
densities <strong>of</strong> states, <strong>and</strong> comparison to photoemission<br />
measurements, we refer to Ref. 20.<br />
For <strong>the</strong> computation <strong>of</strong> <strong>the</strong> optical absorption <strong>and</strong> <strong>energy</strong><strong>loss</strong><br />
<strong>spectra</strong> in a wide frequency range, <strong>the</strong> electronic states<br />
have to be calculated for a large number <strong>of</strong> b<strong>and</strong>s <strong>and</strong><br />
symmetry-inequivalent k points. However, <strong>the</strong> HSE03+G 0 W 0<br />
approach is too computer-time dem<strong>and</strong>ing to provide such<br />
a huge number <strong>of</strong> electronic states. To render this task<br />
computationally feasible, we mimic <strong>the</strong> sophisticated manybody<br />
calculation by <strong>the</strong> computationally less expensive<br />
GGA+U+ approach, where <strong>the</strong> b<strong>and</strong> structure is calculated<br />
in <strong>the</strong> generalized-gradient approximation (GGA) with an<br />
additional on-site interaction U that acts only on d states. 14 The<br />
many-body effects which open <strong>the</strong> b<strong>and</strong> gap are approximately<br />
taken into account by a scissors shift . The two fitting<br />
parameters U <strong>and</strong> are determined such that <strong>the</strong> best<br />
possible agreement (concerning <strong>the</strong> positions <strong>and</strong> intensities<br />
<strong>of</strong> <strong>the</strong> characteristic peaks in <strong>the</strong> density <strong>of</strong> states) with <strong>the</strong><br />
HSE03+G 0 W 0 electronic structure is obtained. Under <strong>the</strong>se<br />
assumptions, we have derived values <strong>of</strong> U = 2.0 eV(MnO),<br />
3.0 eV (FeO, CoO, NiO), <strong>and</strong> = 3.0 eV (MnO), 1.5 eV<br />
(FeO), 2.5 eV (CoO), <strong>and</strong> 2.0 eV (NiO). A detailed discussion<br />
<strong>of</strong> <strong>the</strong>se values <strong>and</strong> <strong>the</strong> resulting electronic structures can<br />
be found in Ref. 20. It has already been proven that <strong>the</strong><br />
GGA+U+ approach as described above provides reliable<br />
optical absorption <strong>spectra</strong> for a wide range <strong>of</strong> materials with<br />
d electrons, reaching from <strong>the</strong> open-shell system MnO 31 to<br />
ZnO 40 ,CdO 40 , SnO 41 2 , <strong>and</strong> InN 42 with fully occupied d states.<br />
235122-2
OPTICAL AND ENERGY-LOSS SPECTRA OF THE ... PHYSICAL REVIEW B 86, 235122 (2012)<br />
B. Dielectric function<br />
For solving <strong>the</strong> BSE to obtain <strong>the</strong> dielectric function,<br />
we first set up <strong>the</strong> electron-hole pair Hamiltonian, which is<br />
determined by <strong>the</strong> quasiparticle states from <strong>the</strong> electronic b<strong>and</strong><br />
structure, <strong>the</strong> matrix elements <strong>of</strong> <strong>the</strong> screened electron-hole<br />
attraction, <strong>and</strong> <strong>the</strong> matrix elements <strong>of</strong> <strong>the</strong> bare Coulomb<br />
interaction to account for local-field effects. 28–30<br />
Since we are studying <strong>antiferromagnetic</strong> materials, <strong>the</strong><br />
inclusion <strong>of</strong> <strong>the</strong> spin degree <strong>of</strong> freedom requires special care:<br />
(i) Singlet <strong>and</strong> triplet excitations are no longer well defined. 31<br />
(ii) <strong>Optical</strong> excitations do not flip spins in <strong>the</strong> electric dipole<br />
approximation <strong>and</strong> <strong>the</strong> framework <strong>of</strong> collinear magnetism.<br />
Therefore, only vertical excitations from a valence b<strong>and</strong> v<br />
to a conduction b<strong>and</strong> c with <strong>the</strong> same spin quantum number<br />
m can take place, i.e., all independent electron-hole pair<br />
states can be labeled by |cvkm〉. 31 This is crucial for <strong>the</strong><br />
interpretation <strong>of</strong> absorption <strong>spectra</strong> <strong>of</strong> magnetic materials.<br />
(iii) The combination <strong>of</strong> both effects leads to an increase <strong>of</strong><br />
<strong>the</strong> rank <strong>of</strong> <strong>the</strong> electron-hole pair Hamiltonian by a factor <strong>of</strong><br />
2, which renders computations even more expensive than for<br />
nonmagnetic materials.<br />
Instead <strong>of</strong> diagonalizing <strong>the</strong> Hamiltonian, <strong>the</strong> eigenvalue<br />
problem is transformed into an initial-value problem which<br />
is solved my means <strong>of</strong> a time-evolution scheme. 43 This<br />
approach, which scales only quadratically with <strong>the</strong> rank <strong>of</strong><br />
<strong>the</strong> Hamiltonian, yields <strong>the</strong> frequency-dependent dielectric<br />
function but does not provide access to individual excitonic<br />
eigenvalues or oscillator strengths.<br />
The static dielectric screening that enters <strong>the</strong> matrix<br />
elements <strong>of</strong> <strong>the</strong> electron-hole attraction is calculated by means<br />
<strong>of</strong> an analytical expression that was suggested by Bechstedt<br />
et al. 44 It models <strong>the</strong> behavior <strong>of</strong> <strong>the</strong> dielectric screening in<br />
reciprocal space <strong>and</strong> depends on <strong>the</strong> electronic static dielectric<br />
constant ε ∞ <strong>and</strong> <strong>the</strong> average valence-electron density in <strong>the</strong><br />
system. The values for ε ∞ = 4.95 (MnO), 45 5.3 (CoO), 46,47<br />
<strong>and</strong> 5.7 (NiO) 47 are taken from experiment. For FeO, a<br />
value <strong>of</strong> 5.0 is chosen following <strong>the</strong> chemical trend <strong>of</strong> <strong>the</strong><br />
o<strong>the</strong>r materials, since <strong>the</strong> only available experimental result<br />
<strong>of</strong> 11.1 has been obtained for Fe x O with a large iron deficit<br />
<strong>of</strong> several percent. 48 In order to consolidate <strong>the</strong> results, <strong>the</strong><br />
optical absorption <strong>spectra</strong> have also been calculated using<br />
merely <strong>the</strong> dielectric constant, i.e., omitting <strong>the</strong> variation <strong>of</strong><br />
<strong>the</strong> screening in reciprocal space completely, <strong>and</strong> no significant<br />
change in <strong>the</strong> <strong>spectra</strong> was observed. Fur<strong>the</strong>r, <strong>the</strong> validity <strong>of</strong> <strong>the</strong><br />
Tamm-Danc<strong>of</strong>f approximation, which is usually utilized for<br />
calculating optical <strong>spectra</strong> <strong>of</strong> bulk insulators, has been checked<br />
carefully <strong>and</strong> found to hold also for <strong>the</strong> TMOs.<br />
In <strong>the</strong> two-particle Hamiltonian, <strong>transition</strong>s with<br />
independent-particle (GGA+U) energies up to 20 eV are<br />
included. The Brillouin zone is sampled with a regular<br />
8 × 8 × 8 k-point mesh that is shifted by 0.2 × 0.3 × 0.5 times<br />
<strong>the</strong> distance between adjacent k points out <strong>of</strong> <strong>the</strong> symmetric<br />
positions. To ensure also <strong>the</strong> convergence <strong>of</strong> <strong>the</strong> real part <strong>of</strong><br />
<strong>the</strong> dielectric function, which is linked to <strong>the</strong> imaginary part<br />
by a Kramers-Kronig transformation, <strong>the</strong> dielectric function<br />
above 20 eV is evaluated in <strong>the</strong> independent-quasiparticle<br />
approximation (IQPA) up to 80 eV <strong>and</strong> <strong>the</strong> contributions <strong>of</strong><br />
<strong>the</strong> corresponding excitations to <strong>the</strong> real part below 20 eV<br />
are added to <strong>the</strong> BSE spectrum. A Lorentzian broadening <strong>of</strong><br />
0.15 eV is applied to <strong>the</strong> dielectric functions. The absorption<br />
coefficients <strong>of</strong> <strong>the</strong> TMOs are derived from <strong>the</strong> macroscopic<br />
dielectric functions according to Eq. (2).<br />
Since <strong>the</strong> resolution <strong>of</strong> EEL <strong>spectra</strong> is generally lower <strong>and</strong><br />
we are not interested in <strong>the</strong> fine structure <strong>of</strong> <strong>the</strong> edge, we can<br />
reduce <strong>the</strong> Brillouin-zone sampling to obtain <strong>the</strong> <strong>loss</strong> function<br />
−Im ε −1 (ω) <strong>and</strong> take into account <strong>the</strong> electron-hole interaction<br />
up to higher <strong>transition</strong> energies instead. Hence, we use a mesh<br />
<strong>of</strong> 4 × 4 × 4 shifted k points <strong>and</strong> solve <strong>the</strong> two-particle Hamiltonian<br />
up to <strong>transition</strong>s <strong>of</strong> 80 eV. For <strong>the</strong> <strong>loss</strong> <strong>spectra</strong>, a broadening<br />
<strong>of</strong> 0.5 eV is used. The reflectivity <strong>spectra</strong> are calculated<br />
according to Eq. (1) with <strong>the</strong> same set <strong>of</strong> convergence parameters<br />
as <strong>the</strong> <strong>loss</strong> <strong>spectra</strong>, since experimental data are available<br />
in a large <strong>spectra</strong>l range, albeit with limited resolution.<br />
III. QUASIPARTICLE BAND STRUCTURE<br />
In order to demonstrate <strong>the</strong> reliability <strong>of</strong> <strong>the</strong> electronic<br />
structures which constitute <strong>the</strong> starting point <strong>of</strong> our responsefunction<br />
calculations, we compare <strong>the</strong> HSE03+G 0 W 0 quasiparticle<br />
b<strong>and</strong> structures from Ref. 20 with <strong>the</strong> quasiparticle<br />
b<strong>and</strong> structures resulting from <strong>the</strong> GGA+U+ approach in<br />
Fig. 1. It is clearly visible that <strong>the</strong> GGA+U+ method reproduces<br />
all main features <strong>of</strong> <strong>the</strong> more sophisticated quasiparticle<br />
b<strong>and</strong> structure with an accuracy that might be surprising for<br />
two methods that seem to be so different at first glance.<br />
However, <strong>the</strong> main driving force that opens <strong>the</strong> gap between<br />
<strong>the</strong> occupied <strong>and</strong> unoccupied d states is <strong>the</strong> screened exchange<br />
which is inherent in both approaches. The HSE03 <strong>energy</strong><br />
functional contains a screened-exchange contribution, as does<br />
<strong>the</strong> GW self-<strong>energy</strong> operator. Even though inspired by <strong>the</strong><br />
Hubbard model to treat <strong>the</strong> physics <strong>of</strong> correlated systems,<br />
<strong>the</strong> way in which on-site corrections to (semi-)local <strong>energy</strong><br />
functionals are implemented in DFT functionals corresponds<br />
to a screened exchange interaction (see, e.g., <strong>the</strong> functional<br />
introduced by Dudarev et al. 14 ). Fur<strong>the</strong>rmore, <strong>the</strong> scissors<br />
operator is a first approximation to <strong>the</strong> gap opening caused<br />
by <strong>the</strong> self-<strong>energy</strong> in <strong>the</strong> GW approximation.<br />
The general agreement between both approaches in <strong>the</strong><br />
valence-b<strong>and</strong> region is excellent. Only for FeO <strong>and</strong> CoO, <strong>the</strong><br />
total width <strong>of</strong> <strong>the</strong> valence b<strong>and</strong>s is slightly underestimated.<br />
The influence <strong>of</strong> this effect on <strong>the</strong> optical <strong>spectra</strong> is discussed<br />
in Sec. IV A3. For all four TMOs, <strong>the</strong> energetic positions <strong>of</strong><br />
<strong>the</strong> O 2s states around −20 eV are slightly <strong>of</strong>f compared to<br />
<strong>the</strong> HSE03+G 0 W 0 approach. However, this is <strong>of</strong> minor importance<br />
for <strong>the</strong> optical <strong>spectra</strong>, since <strong>the</strong>se states contribute only<br />
at energies above 20 eV to <strong>the</strong> absorption where <strong>the</strong> total oscillator<br />
strength is already very low. Also <strong>the</strong> conduction-b<strong>and</strong><br />
positions <strong>and</strong> dispersions obtained within <strong>the</strong> GGA+U+ approach<br />
match well those from <strong>the</strong> HSE03+G 0 W 0 calculations,<br />
in particular with regard to <strong>the</strong> ordering <strong>of</strong> sp <strong>and</strong> d states. The<br />
scissors shifts are chosen to yield <strong>the</strong> best overall agreement<br />
with all conduction b<strong>and</strong>s <strong>and</strong> not to reproduce <strong>the</strong> b<strong>and</strong> gap<br />
as well as possible. This makes a slight overestimation <strong>of</strong> <strong>the</strong><br />
b<strong>and</strong> gaps in <strong>the</strong> GGA+U+ approach inevitable. As we<br />
are not interested in <strong>the</strong> fine details <strong>of</strong> <strong>the</strong> absorption edge,<br />
but in <strong>the</strong> <strong>spectra</strong> in a large frequency range, this is not a<br />
critical issue. Moreover, <strong>the</strong> absorption onsets, in contrast to<br />
o<strong>the</strong>r oxides (cf., e.g., Ref. 40 for MgO <strong>and</strong> ZnO), do not give<br />
235122-3
CLAUDIA RÖDL AND FRIEDHELM BECHSTEDT PHYSICAL REVIEW B 86, 235122 (2012)<br />
(a) MnO<br />
24<br />
20<br />
16<br />
12<br />
8<br />
4<br />
0<br />
-4<br />
-8<br />
-12<br />
-16<br />
-20<br />
F Γ T K L Γ<br />
Energy (eV)<br />
(c) CoO<br />
24<br />
20<br />
16<br />
12<br />
8<br />
4<br />
0<br />
-4<br />
-8<br />
-12<br />
-16<br />
-20<br />
F Γ T K L Γ<br />
Energy (eV)<br />
(b) FeO<br />
24<br />
20<br />
16<br />
12<br />
8<br />
4<br />
0<br />
-4<br />
-8<br />
-12<br />
-16<br />
-20<br />
F Γ T K L Γ<br />
Energy (eV)<br />
(d) NiO<br />
24<br />
20<br />
16<br />
12<br />
8<br />
4<br />
0<br />
-4<br />
-8<br />
-12<br />
-16<br />
-20<br />
F Γ T K L Γ<br />
Energy (eV)<br />
FIG. 1. (Color online) Quasiparticle b<strong>and</strong> structures for MnO, FeO, CoO, <strong>and</strong> NiO. The solid lines represent <strong>the</strong> GGA+U+ b<strong>and</strong>s,<br />
whereas <strong>the</strong> red dots denote <strong>the</strong> HSE03+G 0 W 0 reference b<strong>and</strong> structures from Ref. 20. The valence-b<strong>and</strong> maximum is set to zero. The<br />
high-symmetry points <strong>of</strong> <strong>the</strong> Brillouin zone are labeled as in Ref. 49.<br />
rise to prominent features such as strong exciton series in <strong>the</strong><br />
absorption spectrum, since <strong>the</strong> densities <strong>of</strong> states in <strong>the</strong> vicinity<br />
<strong>of</strong> <strong>the</strong> conduction-b<strong>and</strong> minima are comparably low 20 <strong>and</strong> <strong>the</strong><br />
corresponding <strong>transition</strong>s are symmetry forbidden at <strong>the</strong> Ɣ<br />
point (see Sec. IV A2).<br />
Eventually, it has to be stressed that <strong>the</strong> choice <strong>of</strong> <strong>the</strong> parameters<br />
U <strong>and</strong> is not empirically motivated. They are derived<br />
by comparison to a parameter-free ab initio calculation <strong>and</strong><br />
constitute a computationally cheap <strong>and</strong> accurate alternative to<br />
<strong>the</strong> full many-body calculation.<br />
IV. OPTICAL PROPERTIES<br />
A. Dielectric functions<br />
1. General properties<br />
In Fig. 2, <strong>the</strong> real <strong>and</strong> imaginary parts <strong>of</strong> <strong>the</strong> frequencydependent<br />
dielectric function ε(ω) are shown for a wide<br />
frequency range up to 20 eV. They have been calculated in<br />
two approximations: (i) IQPA, where excitonic <strong>and</strong> local-field<br />
effects are neglected <strong>and</strong> <strong>the</strong> contributions to <strong>the</strong> optical<br />
absorption that arise from individual quasiparticle <strong>transition</strong>s<br />
in <strong>the</strong> GGA+U+ approach are merely summed up weighted<br />
by <strong>the</strong>ir respective oscillator strength, (ii) solving <strong>the</strong> BSE,<br />
taking additionally into account <strong>the</strong> influence <strong>of</strong> <strong>the</strong> local<br />
crystal fields <strong>and</strong> <strong>the</strong> static electron-hole attraction, i.e., <strong>the</strong><br />
dominating many-body effect which is responsible for <strong>the</strong><br />
occurrence <strong>of</strong> excitons.<br />
The dielectric functions <strong>of</strong> <strong>the</strong> four TMOs in <strong>the</strong> IQPA<br />
have many features in common, which is due to <strong>the</strong>ir similar<br />
electronic structure. The low-<strong>energy</strong> part <strong>of</strong> Im ε(ω) isgoverned<br />
by a more or less structured absorption peak that dominates<br />
<strong>the</strong> whole spectrum. It mainly originates from <strong>transition</strong>s<br />
with d b<strong>and</strong>s as initial <strong>and</strong>/or final states (see Sec. IV A2)<br />
<strong>and</strong> constitutes basically <strong>the</strong> only characteristic absorption<br />
feature. Above ∼8 eV, <strong>the</strong> <strong>spectra</strong> are continued by a ra<strong>the</strong>r<br />
structureless plateau that declines slowly at higher energies.<br />
The inclusion <strong>of</strong> excitonic effects by solving <strong>the</strong> BSE leads<br />
to a strong overall redshift <strong>of</strong> <strong>the</strong> absorption <strong>spectra</strong> by about<br />
1 eV <strong>and</strong> an enhancement <strong>of</strong> <strong>the</strong> peaks at low energies, whereas<br />
<strong>the</strong> general line shape <strong>of</strong> Im ε(ω) is retained. The redshift<br />
is an effect that is well known from simple nonmagnetic<br />
semiconductors, even though its magnitude is <strong>of</strong>ten smaller<br />
in <strong>the</strong>se materials. 28,53 In contrast to o<strong>the</strong>r monoxides, such as<br />
MgO <strong>and</strong> ZnO, 40 we do not observe line-shape modifications<br />
that are due to <strong>the</strong> formation <strong>of</strong> Wannier-Mott-like excitons<br />
within <strong>the</strong> quasiparticle b<strong>and</strong> gap or at o<strong>the</strong>r critical points<br />
within <strong>the</strong> interb<strong>and</strong> continuum. In <strong>the</strong> TMOs, <strong>the</strong> b<strong>and</strong>s are<br />
ra<strong>the</strong>r flat <strong>and</strong> we do not find pronounced parabolic b<strong>and</strong><br />
edges that are indispensable prerequisites for <strong>the</strong> occurrence<br />
<strong>of</strong> Wannier-Mott excitons.<br />
However, <strong>the</strong>re is experimental evidence for Frenkel-like<br />
excitonic bound states within <strong>the</strong> fundamental b<strong>and</strong> gap. Even<br />
though optical spectroscopy is not able to probe those excitons<br />
directly, <strong>the</strong>y are visible in EEL spectroscopy (EELS) <strong>and</strong><br />
nonresonant IXS experiments 54 for large transferred momenta<br />
q or in resonant IXS, 55 where o<strong>the</strong>r selection rules hold. These<br />
excitons, which are mainly due to intra-atomic d-d excitations,<br />
cannot be observed in optical absorption <strong>spectra</strong>, since <strong>the</strong>y are<br />
forbidden by <strong>the</strong> dipole selection rule for <strong>the</strong> orbital quantum<br />
235122-4
OPTICAL AND ENERGY-LOSS SPECTRA OF THE ... PHYSICAL REVIEW B 86, 235122 (2012)<br />
(a) MnO<br />
Re ε<br />
Im ε<br />
10<br />
8<br />
6<br />
4<br />
2<br />
0<br />
-2<br />
16<br />
14<br />
12<br />
10<br />
8<br />
IQPA<br />
BSE<br />
Exp. Messick et al.<br />
Exp. Ksendzov et al.<br />
6<br />
4<br />
2<br />
0<br />
0 2 4 6 8 10 12<br />
Energy (eV)<br />
14 16 18 20<br />
(c) CoO<br />
Re ε<br />
Im ε<br />
16<br />
12<br />
8<br />
4<br />
0<br />
-4<br />
14<br />
12<br />
10<br />
8<br />
IQPA<br />
BSE<br />
Exp. Powell et al.<br />
Exp. Kang et al.<br />
6<br />
4<br />
2<br />
0<br />
0 2 4 6 8 10 12<br />
Energy (eV)<br />
14 16 18 20<br />
(b) FeO<br />
Re ε<br />
Im ε<br />
12<br />
10<br />
8<br />
6<br />
4<br />
2<br />
0<br />
-2<br />
14<br />
12<br />
10<br />
8<br />
6<br />
4<br />
2<br />
0<br />
IQPA<br />
BSE<br />
Exp. Hiraoka et al.<br />
0 2 4 6 8 10 12<br />
Energy (eV)<br />
14 16 18 20<br />
(d) NiO<br />
Re ε<br />
Im ε<br />
24<br />
20<br />
16<br />
12<br />
8<br />
4<br />
0<br />
-4<br />
-8<br />
28<br />
24<br />
20<br />
16<br />
IQPA<br />
BSE<br />
Exp. Powell et al.<br />
Exp. Goldhahn et al.<br />
12<br />
8<br />
4<br />
0<br />
0 2 4 6 8 10 12<br />
Energy (eV)<br />
14 16 18 20<br />
FIG. 2. (Color online) Real <strong>and</strong> imaginary parts <strong>of</strong> <strong>the</strong> frequency-dependent macroscopic dielectric function ε(ω) for MnO, FeO, CoO, <strong>and</strong><br />
NiO calculated in <strong>the</strong> independent-quasiparticle approximation (IQPA) <strong>and</strong> solving <strong>the</strong> Be<strong>the</strong>-Salpeter equation (BSE). Experimental <strong>spectra</strong><br />
that are derived from reflectivity (Messick et al., 22 Ksendzov et al., 23 Hiraoka et al., 50 <strong>and</strong> Powell <strong>and</strong> Spicer 24 ) or ellipsometry (Kang et al. 51<br />
<strong>and</strong> Goldhahn <strong>and</strong> Schley 52 ) measurements are shown for comparison. The spectrum <strong>of</strong> FeO from Hiraoka et al. is biased by strong defect<br />
absorption at low frequencies due to <strong>the</strong> nonstoichiometry <strong>of</strong> <strong>the</strong> sample. 50<br />
number l =±1. Some <strong>of</strong> <strong>the</strong>se excitations additionally<br />
require spin flips which are also dipole forbidden within <strong>the</strong><br />
framework <strong>of</strong> collinear spins. Only by inclusion <strong>of</strong> spin-orbit<br />
coupling, <strong>the</strong>y might become weakly allowed. Indeed, <strong>the</strong>y are<br />
found in low-<strong>energy</strong> absorption experiments 56–58 but cannot be<br />
distinguished unambiguously from possible defect absorption.<br />
The influence <strong>of</strong> local-field effects on <strong>the</strong> optical absorption,<br />
which usually leads to a blueshift <strong>of</strong> <strong>the</strong> <strong>spectra</strong>, is negligible<br />
for <strong>the</strong> TMOs, as has already been shown for MnO in Ref. 31.<br />
Even though <strong>the</strong>se materials are locally very inhomogeneous<br />
because <strong>of</strong> <strong>the</strong> ionic nature <strong>of</strong> <strong>the</strong> crystals, <strong>the</strong>se localized<br />
charges are not easily polarizable. The electrons are not able to<br />
screen external fields efficiently, since <strong>the</strong>y are bound tightly to<br />
<strong>the</strong> ions. This argument is confirmed by <strong>the</strong> small differences<br />
between <strong>the</strong> electronic static microscopic <strong>and</strong> macroscopic<br />
dielectric constants <strong>of</strong> <strong>the</strong> TMOs (see Table III <strong>of</strong> Ref. 20).<br />
2. Allowed <strong>and</strong> forbidden <strong>transition</strong>s<br />
Traditionally, <strong>the</strong> low-<strong>energy</strong> parts <strong>of</strong> <strong>the</strong> TMO absorption<br />
<strong>spectra</strong> have been interpreted in an atomic picture in terms<br />
<strong>of</strong> <strong>transition</strong>s between multiplets <strong>of</strong> <strong>the</strong> TM 3d states along<br />
with <strong>the</strong> corresponding selection rules. 22,24,59 We would like<br />
to point out <strong>the</strong> pitfalls <strong>of</strong> such an approach <strong>and</strong> show to what<br />
extent it can be misleading.<br />
A detailed analysis <strong>of</strong> <strong>the</strong> absorption peaks is always<br />
hampered by <strong>the</strong> overlap <strong>and</strong> hybridization <strong>of</strong> s, p, <strong>and</strong> d<br />
states in both <strong>the</strong> valence <strong>and</strong> conduction b<strong>and</strong>s. Here, we<br />
concentrate on <strong>the</strong> lowest-<strong>energy</strong> <strong>transition</strong>s <strong>of</strong> MnO <strong>and</strong> NiO<br />
as generic examples, because in <strong>the</strong>se materials <strong>the</strong> d <strong>and</strong><br />
s b<strong>and</strong>s at <strong>the</strong> b<strong>and</strong> edges can be ra<strong>the</strong>r easily disentangled<br />
from b<strong>and</strong>s with o<strong>the</strong>r symmetries. In <strong>the</strong> left panels <strong>of</strong> Fig. 3,<br />
<strong>the</strong> imaginary parts <strong>of</strong> <strong>the</strong> dielectric functions for MnO <strong>and</strong><br />
NiO in <strong>the</strong> IQPA are shown <strong>and</strong> <strong>the</strong> contributions <strong>of</strong> selected<br />
interb<strong>and</strong> <strong>transition</strong>s are highlighted. The optical <strong>transition</strong><br />
matrix elements |p| 2 for each <strong>of</strong> <strong>the</strong>se interb<strong>and</strong> <strong>transition</strong>s<br />
have been calculated in <strong>the</strong> longitudinal approach following<br />
Gajdoš et al. 60 They are plotted along high-symmetry lines<br />
<strong>of</strong> <strong>the</strong> Brillouin zone toge<strong>the</strong>r with <strong>the</strong> corresponding b<strong>and</strong><br />
structures in <strong>the</strong> right panels <strong>of</strong> Fig. 3.<br />
For MnO, <strong>the</strong> contributions to <strong>the</strong> optical absorption that<br />
arise from <strong>transition</strong>s between <strong>the</strong> occupied e g <strong>and</strong> <strong>the</strong> empty<br />
s states, as well as between <strong>the</strong> occupied e g <strong>and</strong> <strong>the</strong> empty<br />
t 2g states, are depicted. It is obvious that <strong>the</strong> low-<strong>energy</strong> part<br />
235122-5
CLAUDIA RÖDL AND FRIEDHELM BECHSTEDT PHYSICAL REVIEW B 86, 235122 (2012)<br />
(a) MnO<br />
Im ε<br />
12<br />
10<br />
all b<strong>and</strong>s<br />
6<br />
e<br />
8<br />
g<br />
→ s<br />
4<br />
e g<br />
→ s<br />
0.02<br />
e g<br />
→ t 2g<br />
e<br />
6<br />
2<br />
g<br />
→ t 2g<br />
4<br />
0<br />
0.01<br />
2<br />
-2<br />
0<br />
4 6 8 10 12 14 -4<br />
F Γ T K L Γ 0 Energy (eV)<br />
(b) NiO<br />
Im ε<br />
Energy (eV)<br />
8<br />
0.03<br />
20<br />
8<br />
0.03<br />
t<br />
all b<strong>and</strong>s<br />
16<br />
6<br />
2g<br />
→ e g<br />
t 2g<br />
→ e g<br />
4<br />
0.02<br />
12<br />
2<br />
8<br />
0<br />
0.01<br />
4<br />
-2<br />
0<br />
2 4 6 8 10 12 -4<br />
F Γ T K L Γ 0 Energy (eV)<br />
Energy (eV)<br />
<strong>Optical</strong> <strong>transition</strong> matrix element<br />
|p| 2 [(h/a B<br />
) 2 ]<br />
<strong>Optical</strong> <strong>transition</strong> matrix element<br />
|p| 2 [(h/a B<br />
) 2 ]<br />
FIG. 3. (Color online) Analysis <strong>of</strong> <strong>the</strong> <strong>transition</strong>s that contribute to <strong>the</strong> main absorption peaks <strong>of</strong> MnO (a) <strong>and</strong> NiO (b). In <strong>the</strong> left panels,<br />
<strong>the</strong> imaginary parts <strong>of</strong> <strong>the</strong> dielectric functions in IQPA (all b<strong>and</strong>s) are shown toge<strong>the</strong>r with <strong>the</strong> contributions <strong>of</strong> <strong>the</strong> e g → s <strong>and</strong> e g → t 2g (MnO)<br />
or t 2g → e g <strong>transition</strong>s (NiO). In <strong>the</strong> right panels, <strong>the</strong> corresponding states in <strong>the</strong> b<strong>and</strong> structures are highlighted. The black solid lines indicate<br />
<strong>the</strong> valence-b<strong>and</strong> e g (MnO) or t 2g states (NiO). The final states <strong>of</strong> <strong>the</strong> respective optical <strong>transition</strong>s are shown in <strong>the</strong> same colors as <strong>the</strong> partial<br />
optical <strong>spectra</strong> in <strong>the</strong> left panels. Fur<strong>the</strong>rmore, <strong>the</strong> right panels depict <strong>the</strong> optical <strong>transition</strong> matrix elements |p| 2 for <strong>the</strong> interb<strong>and</strong> <strong>transition</strong>s<br />
(dotted curves) along <strong>the</strong> Brillouin-zone path. It is clearly visible that interb<strong>and</strong> <strong>transition</strong>s which are forbidden at <strong>the</strong> Ɣ point for symmetry<br />
reasons can contribute strongly to <strong>the</strong> optical absorption in o<strong>the</strong>r parts <strong>of</strong> <strong>the</strong> Brillouin zone.<br />
<strong>of</strong> <strong>the</strong> absorption spectrum is entirely due to <strong>the</strong>se <strong>transition</strong>s<br />
which are forbidden in atoms because <strong>the</strong>y violate <strong>the</strong> selection<br />
rule l =±1. Indeed, <strong>the</strong> corresponding <strong>transition</strong> matrix<br />
elements are zero at <strong>the</strong> Ɣ point [see right panel <strong>of</strong> Fig. 3(a)].<br />
However, <strong>the</strong>se interb<strong>and</strong> <strong>transition</strong>s are dipole allowed in<br />
<strong>the</strong> rest <strong>of</strong> <strong>the</strong> Brillouin zone. Even though <strong>the</strong> <strong>transition</strong><br />
matrix elements are one order <strong>of</strong> magnitude smaller than<br />
for sp-bonded semiconductors 61 or o<strong>the</strong>r oxide insulators, 62<br />
<strong>the</strong>y are never<strong>the</strong>less responsible for <strong>the</strong> whole optical <strong>spectra</strong>l<br />
strength at low energies. It has to be stressed that <strong>the</strong> e g → t 2g<br />
<strong>transition</strong>s are interatomic <strong>transition</strong>s between Mn atoms<br />
<strong>of</strong> opposite spin polarization, since intra-atomic excitations<br />
would require spin flips <strong>and</strong> thus violate <strong>the</strong> spin selection<br />
rule. This may be <strong>the</strong> reason for <strong>the</strong>ir comparably low oscillator<br />
strength. Due to <strong>the</strong> high joint density <strong>of</strong> states <strong>of</strong> <strong>the</strong>se flat<br />
b<strong>and</strong>s, we yet find significant peaks in <strong>the</strong> absorption spectrum.<br />
The case <strong>of</strong> NiO is even more striking. The only feature<br />
<strong>of</strong> <strong>the</strong> absorption spectrum, <strong>the</strong> peak at 5 eV in <strong>the</strong> IQPA<br />
spectrum, stems entirely from <strong>transition</strong>s between <strong>the</strong> occupied<br />
t 2g <strong>and</strong> <strong>the</strong> unoccupied e g minority-spin d states. Also,<br />
<strong>the</strong>se <strong>transition</strong>s are symmetry forbidden at <strong>the</strong> Ɣ point but<br />
contribute to <strong>the</strong> absorption in large parts <strong>of</strong> <strong>the</strong> Brillouin zone.<br />
In contrast to MnO, <strong>the</strong>se excitations are mainly intra-atomic<br />
which may explain, toge<strong>the</strong>r with a high joint density <strong>of</strong> states,<br />
<strong>the</strong>ir bigger oscillator strength.<br />
Hence, we conclude that an interpretation <strong>of</strong> <strong>the</strong> optical<br />
<strong>spectra</strong> <strong>of</strong> <strong>the</strong> TMOs in terms <strong>of</strong> purely atomic models can be<br />
highly deceptive <strong>and</strong> has to be h<strong>and</strong>led with extreme care. It<br />
might be suitable for <strong>the</strong> Frenkel-like excitons within <strong>the</strong> b<strong>and</strong><br />
gap, but not for <strong>the</strong> analysis <strong>of</strong> <strong>the</strong> interb<strong>and</strong> continuum.<br />
3. Comparison to experiments<br />
The optical absorption <strong>of</strong> MnO is governed by a two-peak<br />
structure [see Fig. 2(a)]. The first peak, that is found at 5.3 eV<br />
when excitonic <strong>and</strong> local-field effects are included in <strong>the</strong><br />
calculation, is due to e g → s <strong>transition</strong>s, while <strong>the</strong> second <strong>and</strong><br />
largest peak <strong>of</strong> <strong>the</strong> whole spectrum at 7.0 eV stems from e g →<br />
t 2g , e g → e g , <strong>and</strong> t 2g → s <strong>transition</strong>s, which are all symmetry<br />
forbidden in an atomic picture. The plateau at higher energies<br />
originates from various interb<strong>and</strong> <strong>transition</strong>s that involve also<br />
<strong>the</strong> O 2p states. The experimental <strong>spectra</strong> for Im ε(ω) are<br />
derived from near-normal-incidence reflectivity measurements<br />
by Kramers-Kronig transformation. 22,23 Both measured curves<br />
exhibit <strong>the</strong> characteristic two-peak structure that has also been<br />
found in our calculations <strong>and</strong> <strong>the</strong> peak positions agree well with<br />
our results. However, we observe significant differences in <strong>the</strong><br />
peak intensities both between <strong>the</strong> two experimental curves <strong>and</strong><br />
between <strong>the</strong> experimental curves <strong>and</strong> our calculations. Possible<br />
reasons might be sample-quality problems <strong>of</strong> <strong>the</strong>se ra<strong>the</strong>r old<br />
235122-6
OPTICAL AND ENERGY-LOSS SPECTRA OF THE ... PHYSICAL REVIEW B 86, 235122 (2012)<br />
(a) MnO<br />
0.5<br />
(b) FeO<br />
0.5<br />
Reflectivity R<br />
0.4<br />
0.3<br />
0.2<br />
0.1<br />
BSE<br />
Exp. Ksendzov et al.<br />
Exp. Hiraoka et al.<br />
Reflectivity R<br />
0.4<br />
0.3<br />
0.2<br />
0.1<br />
BSE<br />
Exp. Hiraoka et al.<br />
0<br />
0 2 4 6 8 10 12 14 16 18 20 22 24 26 28 30<br />
(c) CoO<br />
Energy (eV)<br />
0.5<br />
Reflectivity R<br />
0.4<br />
0.3<br />
0.2<br />
0.1<br />
BSE<br />
Exp. Powell et al.<br />
0<br />
0 2 4 6 8 10 12 14 16 18 20 22 24 26 28 30<br />
Energy (eV)<br />
0<br />
0 2 4 6 8 10 12 14 16 18 20 22 24 26 28 30<br />
(d) NiO<br />
Energy (eV)<br />
Reflectivity R<br />
0.5<br />
0.4<br />
0.3<br />
0.2<br />
0.1<br />
BSE<br />
Exp. Powell et al.<br />
0<br />
0 2 4 6 8 10 12 14 16 18 20 22 24 26 28 30<br />
Energy (eV)<br />
FIG. 4. (Color online) Reflectivities for MnO, FeO, CoO, <strong>and</strong> NiO at normal incidence. The <strong>spectra</strong> have been calculated by solving <strong>the</strong><br />
Be<strong>the</strong>-Salpeter equation (BSE) including excitonic <strong>and</strong> local-field effects. The experimental data are taken from Ksendzov et al., 23 Hiraoka<br />
et al., 50 <strong>and</strong> Powell <strong>and</strong> Spicer. 24 The reflectivity spectrum <strong>of</strong> FeO from Hiraoka et al. is biased by strong defect absorption at low frequencies<br />
due to <strong>the</strong> nonstoichiometry <strong>of</strong> <strong>the</strong> sample. 50<br />
data (defect states, surface roughness) or assumptions about<br />
<strong>the</strong> high-<strong>energy</strong> behavior <strong>of</strong> <strong>the</strong> dielectric function that enter<br />
<strong>the</strong> Kramers-Kronig transformation. However, <strong>the</strong> high-<strong>energy</strong><br />
part <strong>of</strong> <strong>the</strong> calculated spectrum <strong>and</strong> <strong>the</strong> data <strong>of</strong> Ksendzov<br />
et al. 23 match almost perfectly. Also, <strong>the</strong> real part <strong>of</strong> ε(ω)<br />
agrees well with <strong>the</strong> measurements <strong>of</strong> Ksendzov et al., except<br />
for <strong>the</strong> intensity <strong>of</strong> <strong>the</strong> second peak.<br />
The imaginary part <strong>of</strong> <strong>the</strong> dielectric function <strong>of</strong> FeO solving<br />
<strong>the</strong> BSE [Fig. 2(b)] exhibits a small peak at 2.9 eV which<br />
arises from <strong>transition</strong>s with initial states in <strong>the</strong> single filled<br />
minority-spin t 2g b<strong>and</strong>. It is followed by <strong>the</strong> main structure<br />
<strong>of</strong> <strong>the</strong> absorption spectrum. It is not possible to disentangle<br />
individual contributions to this prominent feature, because <strong>the</strong><br />
involved valence p <strong>and</strong> d as well as conduction s <strong>and</strong> d states<br />
strongly overlap. Experimental data for <strong>the</strong> stoichiometric<br />
monoxide FeO are not available, since it is not stable in nature.<br />
Hiraoka et al. 50 recently reported on an optical absorption<br />
spectrum derived from reflectivity data for Fe x O with an iron<br />
deficiency <strong>of</strong> several percent. It exhibits a strong absorption<br />
peak within <strong>the</strong> fundamental gap <strong>of</strong> FeO which <strong>the</strong> authors<br />
assign to defect absorption at Fe vacancies in <strong>the</strong>ir samples.<br />
Even though <strong>the</strong> experimental resolution is not very high, <strong>the</strong><br />
measured data possess a broad peak in <strong>the</strong> vicinity <strong>of</strong> 4.5 eV<br />
<strong>and</strong> a plateau at higher energies that match our calculated<br />
<strong>spectra</strong>. The overestimation <strong>of</strong> <strong>the</strong> total peak height might<br />
be partially due to <strong>the</strong> mentioned underestimation <strong>of</strong> <strong>the</strong><br />
valence-b<strong>and</strong> width (cf. Sec. III). O<strong>the</strong>r issues are, <strong>of</strong> course,<br />
<strong>the</strong> nonstoichiometry <strong>of</strong> <strong>the</strong> sample <strong>and</strong> <strong>the</strong> experimental<br />
resolution. Within <strong>the</strong> limitations discussed above, <strong>the</strong> real<br />
part <strong>of</strong> ε(ω) agrees well with <strong>the</strong> data <strong>of</strong> Hiraoka et al., except<br />
for <strong>the</strong> strong rise at low energies in <strong>the</strong> experimental curve<br />
that is due to defect absorption.<br />
Also in <strong>the</strong> case <strong>of</strong> CoO, <strong>the</strong> imaginary part <strong>of</strong> ε(ω) features<br />
a broad <strong>and</strong> intense peak at low energies that cannot be<br />
analyzed straightforwardly in terms <strong>of</strong> individual <strong>transition</strong>s<br />
[see Fig. 2(c)]. The experimental data <strong>of</strong> Powell <strong>and</strong> Spicer 24<br />
from reflectivity measurements <strong>and</strong> Kang et al. 51 from spectroscopic<br />
ellipsometry both exhibit this absorption peak, albeit<br />
with strongly deviating intensity. We find better agreement<br />
with <strong>the</strong> more recent data concerning peak intensity, even<br />
though it still seems to be overestimated by our calculations,<br />
which might again be in part due to <strong>the</strong> underestimation <strong>of</strong><br />
<strong>the</strong> valence-b<strong>and</strong> width in <strong>the</strong> b<strong>and</strong>-structure calculations (cf.<br />
Sec. III). However, <strong>the</strong> positions <strong>of</strong> <strong>the</strong> absorption peaks match<br />
those found by Powell <strong>and</strong> Spicer, whereas <strong>the</strong> curve <strong>of</strong> Kang<br />
et al. seems to be redshifted. The real parts <strong>of</strong> ε(ω) agree well<br />
with <strong>the</strong> experimental data, taking into account instrumental,<br />
temperature, <strong>and</strong> lifetime broadening effects.<br />
As already discussed above, <strong>the</strong> optical absorption <strong>of</strong> NiO<br />
[Figs. 2(d) <strong>and</strong> 3(b)] is dominated by intra-atomic t 2g → e g<br />
<strong>transition</strong>s. The experimental data which are derived from<br />
reflectivity 24 <strong>and</strong> ellipsometry measurements 52 agree very well<br />
with <strong>the</strong> calculated curves solving <strong>the</strong> BSE in <strong>the</strong> whole studied<br />
<strong>spectra</strong>l range. Only concerning <strong>the</strong> intensity <strong>of</strong> <strong>the</strong> main<br />
absorption peak, we observe significant deviations. For NiO<br />
with its particularly simply shaped absorption spectrum, <strong>the</strong><br />
necessity to include excitonic effects in <strong>the</strong> calculation <strong>of</strong> <strong>the</strong><br />
optical absorption is most obvious, since <strong>the</strong> main absorption<br />
peak in <strong>the</strong> IQPA deviates significantly from <strong>the</strong> measured<br />
position.<br />
Besides <strong>the</strong> experimental issues already discussed, we<br />
would like to point out o<strong>the</strong>r possible reasons for <strong>the</strong><br />
overestimation <strong>of</strong> <strong>the</strong> peak intensities in all TMOs. The<br />
neglect <strong>of</strong> local-field contributions to <strong>the</strong> dielectric function<br />
that enters <strong>the</strong> screened electron-hole interaction may lead<br />
to an underestimation <strong>of</strong> <strong>the</strong> screening <strong>and</strong>, <strong>the</strong>refore, to an<br />
artificially increased peak enhancement when going from <strong>the</strong><br />
IQPA to <strong>the</strong> full solution <strong>of</strong> <strong>the</strong> BSE. Fur<strong>the</strong>r, <strong>the</strong> presence <strong>of</strong><br />
free carriers in <strong>the</strong> samples due to defects or natural doping (for<br />
instance, Kang et al. 51 report on excess oxygen <strong>and</strong> Hiraoka<br />
235122-7
CLAUDIA RÖDL AND FRIEDHELM BECHSTEDT PHYSICAL REVIEW B 86, 235122 (2012)<br />
(a) MnO<br />
Absorption α (10 5 cm -1 )<br />
20<br />
15<br />
10<br />
5<br />
BSE<br />
Exp. Ksendzov et al.<br />
0<br />
0 2 4 6 8 10 12 14 16 18 20<br />
Energy (eV)<br />
(c) CoO<br />
Absorption α (10 5 cm -1 )<br />
25<br />
20<br />
15<br />
10<br />
5<br />
BSE<br />
Exp. Powell et al.<br />
0<br />
0 2 4 6 8 10 12 14 16 18 20<br />
Energy (eV)<br />
(b) FeO<br />
Absorption α (10 5 cm -1 )<br />
20<br />
15<br />
10<br />
5<br />
BSE<br />
0<br />
0 2 4 6 8 10 12 14 16 18 20<br />
Energy (eV)<br />
(d) NiO<br />
Absorption α (10 5 cm -1 )<br />
25<br />
20<br />
15<br />
10<br />
5<br />
BSE<br />
Exp. Powell et al.<br />
0<br />
0 2 4 6 8 10 12 14 16 18 20<br />
Energy (eV)<br />
FIG. 5. (Color online) Absorption coefficients for MnO, FeO, CoO, <strong>and</strong> NiO. The <strong>spectra</strong> have been calculated by solving <strong>the</strong> Be<strong>the</strong>-Salpeter<br />
equation (BSE) including excitonic <strong>and</strong> local-field effects. The experimental curves from Ksendzov et al. 23 <strong>and</strong> Powell <strong>and</strong> Spicer 24 have been<br />
derived from reflectivity data.<br />
et al. 50 on iron deficiencies) may cause a screening <strong>of</strong> <strong>the</strong><br />
excitonic effects in experiment. 63<br />
<strong>the</strong> whole frequency range. However, <strong>the</strong> qualitative behavior<br />
<strong>of</strong> <strong>the</strong> absorption is well reproduced.<br />
B. Reflectivities <strong>and</strong> absorption coefficients<br />
Most optical experiments actually probe reflectivities R or<br />
absorption coefficients α. The real <strong>and</strong> imaginary parts <strong>of</strong> <strong>the</strong><br />
dielectric function are only deduced <strong>the</strong>refrom by Kramers-<br />
Kronig transformation or similar methods with additional<br />
assumptions on <strong>the</strong> analytical behavior <strong>of</strong> <strong>the</strong> dielectric<br />
function for very small <strong>and</strong> large frequencies. Therefore,<br />
we have also calculated <strong>the</strong> normal-incidence reflectivities<br />
<strong>and</strong> absorption coefficients including excitonic <strong>and</strong> local-field<br />
effects in a large <strong>spectra</strong>l range <strong>and</strong> compared <strong>the</strong> results to<br />
available experimental data in Figs. 4 <strong>and</strong> 5.<br />
The reflectivity <strong>spectra</strong> <strong>of</strong> all four oxides basically exhibit<br />
a two-peak structure with a first peak that corresponds to <strong>the</strong><br />
dominant peaks in Im ε(ω) <strong>and</strong> a second one in <strong>the</strong> vicinity <strong>of</strong><br />
20 eV right before <strong>the</strong> onset <strong>of</strong> <strong>the</strong> plasmon excitations (see<br />
Sec. V). The agreement between <strong>the</strong> computed <strong>spectra</strong> <strong>and</strong><br />
<strong>the</strong> experimental data from Ksendzov et al. 23 <strong>and</strong> Powell <strong>and</strong><br />
Spicer 24 is reasonable, taking into account <strong>the</strong> sensitivity <strong>of</strong><br />
reflectivity measurements to surface roughness <strong>and</strong> oxidation.<br />
Only <strong>the</strong> intensity <strong>of</strong> <strong>the</strong> <strong>spectra</strong> from Hiraoka et al. 50<br />
deviates significantly. The considerably lower reflectivity both<br />
compared to our calculations <strong>and</strong> o<strong>the</strong>r experiments may<br />
possibly be traced back to measuring <strong>the</strong> polar (111) surface<br />
which is subject to surface passivation, e.g., by oxidation. In<br />
<strong>the</strong> case <strong>of</strong> FeO, <strong>the</strong> nonstoichiometry <strong>of</strong> <strong>the</strong> sample also has<br />
to be kept in mind.<br />
The calculated absorption onsets as well as <strong>the</strong> general line<br />
shape <strong>of</strong> <strong>the</strong> frequency-dependent absorption coefficients (see<br />
Fig. 5) agree well with <strong>the</strong> experimental <strong>spectra</strong> for MnO<br />
<strong>and</strong> NiO. Only <strong>the</strong> intensities <strong>of</strong> <strong>the</strong> pronounced peaks in<br />
Im ε(ω) are overestimated for all TMOs, as has already been<br />
discussed above. For CoO, <strong>the</strong> computed optical absorption<br />
coefficient is higher than <strong>the</strong> measured spectrum throughout<br />
V. ENERGY-LOSS SPECTRA<br />
In Fig. 6, we present <strong>the</strong> <strong>energy</strong>-<strong>loss</strong> functions −Im ε −1 (ω)<br />
<strong>of</strong> <strong>the</strong> TMOs. The <strong>loss</strong> <strong>spectra</strong> including excitonic <strong>and</strong> localfield<br />
effects at vanishing momentum transfer can be obtained<br />
directly by inversion <strong>of</strong> <strong>the</strong> macroscopic dielectric function.<br />
The <strong>loss</strong> function is related to <strong>the</strong> dynamical structure factor<br />
S(q,ω), which can be probed in EEL <strong>and</strong> IXS experiments, by<br />
means <strong>of</strong><br />
−Im ε −1 (q,ω) = πv(q)S(q,ω), (3)<br />
with <strong>the</strong> Coulomb potential in reciprocal space v(q) <strong>and</strong> <strong>the</strong><br />
momentum transfer q. Here, we concentrate on <strong>the</strong> <strong>loss</strong> in <strong>the</strong><br />
limit <strong>of</strong> vanishing momentum q = 0.<br />
The <strong>loss</strong> <strong>spectra</strong> <strong>of</strong> <strong>the</strong> TMOs in Fig. 6 resemble each<br />
o<strong>the</strong>r strongly, which is due to <strong>the</strong> similar electronic structures<br />
<strong>of</strong> <strong>the</strong>se four materials. Especially <strong>the</strong> dominant <strong>loss</strong> peaks<br />
in <strong>the</strong> <strong>energy</strong> range between 20 <strong>and</strong> 25 eV exhibit similar<br />
line shapes, intensities, <strong>and</strong> peak positions. The steep rise<br />
<strong>of</strong> <strong>the</strong> <strong>loss</strong> function at <strong>the</strong> low-<strong>energy</strong> edge <strong>of</strong> this broad<br />
feature coincides with a zero in Re ε(ω) at 20.2 (MnO), 19.6<br />
(FeO), 21.5 (CoO), <strong>and</strong> 22.0 eV (NiO), which corresponds to<br />
<strong>the</strong> longitudinal plasma frequency. Consequently, <strong>the</strong>se peaks<br />
represent collective charge oscillations <strong>of</strong> <strong>the</strong> valence-electron<br />
gas. As <strong>the</strong> slopes <strong>of</strong> <strong>the</strong> real parts <strong>of</strong> <strong>the</strong> dielectric functions<br />
in <strong>the</strong> vicinity <strong>of</strong> <strong>the</strong> zeros are extremely small, we find in<br />
each <strong>of</strong> <strong>the</strong> TMOs a very broad feature that is extended over<br />
several electronvolts <strong>and</strong> possesses a fine structure. For <strong>the</strong><br />
same reason, <strong>the</strong> exact values <strong>of</strong> <strong>the</strong> zeros depend sensitively<br />
on <strong>the</strong> convergence parameters.<br />
The classical plasma frequency ω p = √ e 2 n/(ε 0 m) (with n<br />
<strong>the</strong> average valence-electron density, e <strong>the</strong> elementary charge,<br />
m <strong>the</strong> electron mass, <strong>and</strong> ε 0 <strong>the</strong> vacuum dielectric constant) <strong>of</strong><br />
235122-8
OPTICAL AND ENERGY-LOSS SPECTRA OF THE ... PHYSICAL REVIEW B 86, 235122 (2012)<br />
(a) MnO<br />
2<br />
1.8<br />
1.6<br />
BSE<br />
Exp. Ksendzov et al.<br />
1.4<br />
1.2<br />
Exp. Fromme et al.<br />
1<br />
0.8<br />
0.6<br />
0.4<br />
0.2<br />
0<br />
0 5 10 15 20 25 30 35 40 45 50 55 60<br />
Energy (eV)<br />
(c) CoO<br />
Loss function -Im ε -1<br />
Loss function -Im ε -1<br />
2.4<br />
2.2<br />
1.8 2<br />
1.6<br />
1.4<br />
1.2<br />
0.8 1<br />
0.6<br />
0.4<br />
BSE<br />
Exp. Larson et al. [100]<br />
Exp. Larson et al. [111]<br />
0.2<br />
0<br />
0 5 10 15 20 25 30 35 40 45 50 55 60<br />
Energy (eV)<br />
(b) FeO<br />
2<br />
1.8<br />
1.6<br />
BSE<br />
1.4<br />
1.2<br />
1<br />
0.8<br />
0.6<br />
0.4<br />
0.2<br />
0<br />
0 5 10 15 20 25 30 35 40 45 50 55 60<br />
(d) NiO<br />
Energy (eV)<br />
Loss function -Im ε -1<br />
Loss function -Im ε -1<br />
2.4<br />
2.2<br />
1.8 2<br />
1.6<br />
1.4<br />
1.2<br />
0.8 1<br />
0.6<br />
0.4<br />
BSE<br />
Exp. Gorschlüter et al.<br />
Exp. Larson et al. [100]<br />
Exp. Larson et al. [111]<br />
0.2<br />
0<br />
0 5 10 15 20 25 30 35 40 45 50 55 60<br />
Energy (eV)<br />
FIG. 6. (Color online) Energy-<strong>loss</strong> <strong>spectra</strong> for MnO, FeO, CoO, <strong>and</strong> NiO at vanishing momentum transfer, including excitonic <strong>and</strong> local-field<br />
effects (BSE). The experimental reference data have been derived from reflectivity measurements (Ksendzov et al. 23 ), EELS (Fromme et al., 64<br />
Gorschlüter <strong>and</strong> Merz 65 ) <strong>of</strong> <strong>the</strong> MnO <strong>and</strong> NiO (100) surfaces, <strong>and</strong> IXS <strong>of</strong> CoO <strong>and</strong> NiO along <strong>the</strong> [100] <strong>and</strong> [111] directions (Larson et al. 54 ).<br />
The curves from Fromme et al. <strong>and</strong> Gorschlüter <strong>and</strong> Merz are plotted in arbitrary units.<br />
<strong>the</strong> O 2p <strong>and</strong> TM 4s valence electrons amounts to ¯hω p = 19.5<br />
(MnO), 20.2 (FeO), 20.8 (CoO), <strong>and</strong> 21.4 eV (NiO). If also<br />
<strong>the</strong> TM 3d electrons are assumed to contribute fully to <strong>the</strong><br />
dielectric screening, we obtain 26.4 (MnO), 28.5 (FeO), 30.6<br />
(CoO), <strong>and</strong> 32.6 eV (NiO) instead. Finally, including also <strong>the</strong><br />
O2s electrons in <strong>the</strong> valence-electron density yields ¯hω p =<br />
28.7 (MnO), 30.8 (FeO), 32.8 (CoO), <strong>and</strong> 34.9 eV (NiO). The<br />
actual plasma frequencies derived from <strong>the</strong> zeros in Re ε(ω)<br />
agree surprisingly well with <strong>the</strong> classical plasma frequencies<br />
which take only <strong>the</strong> O 2p <strong>and</strong> TM 4s electrons into account.<br />
This leads us to <strong>the</strong> conclusion that <strong>the</strong> TM 3d electrons <strong>and</strong><br />
even more so <strong>the</strong> O 2s electrons contribute to <strong>the</strong> lowest-<strong>energy</strong><br />
collective charge excitations in <strong>the</strong> TMOs at most partially,<br />
since <strong>the</strong>y are bound tightly to <strong>the</strong> atoms. However, <strong>the</strong> broad<br />
peaks in <strong>the</strong> <strong>loss</strong> functions continue above <strong>the</strong> longitudinal<br />
plasma frequencies <strong>and</strong> possess a considerable fine structure.<br />
This may be due to successive contributions <strong>of</strong> <strong>the</strong> TM 3d<br />
electrons (above ∼25 eV) <strong>and</strong> O 2s electrons (above ∼30 eV)<br />
to <strong>the</strong> plasma oscillations.<br />
In Fig. 6(a), <strong>the</strong> <strong>loss</strong> spectrum <strong>of</strong> MnO is compared<br />
to experimental results that were obtained from reflectivity<br />
data 23 at low energies <strong>and</strong> direct EEL measurements for<br />
finite momentum transfer 64 at much higher energies. The<br />
high-<strong>energy</strong> part <strong>of</strong> <strong>the</strong> experimental <strong>loss</strong> spectrum can be<br />
assumed not to depend strongly on <strong>the</strong> wave vector <strong>and</strong> can thus<br />
be compared to <strong>the</strong> calculated curve at q = 0 in a very rough<br />
first approximation. Unfortunately, <strong>the</strong> available experimental<br />
data do not cover <strong>the</strong> most interesting <strong>spectra</strong>l range that<br />
contains <strong>the</strong> broad plasmon peak. The calculated spectrum<br />
including excitonic <strong>and</strong> local-field effects matches excellently<br />
<strong>the</strong> experimental curve in <strong>the</strong> range <strong>of</strong> <strong>the</strong> interb<strong>and</strong> <strong>transition</strong>s<br />
below <strong>the</strong> longitudinal plasma frequency. The measured <strong>loss</strong><br />
spectrum in <strong>the</strong> high-<strong>energy</strong> range is in arbitrary units <strong>and</strong> is<br />
almost featureless due to strong broadening effects, yet <strong>the</strong><br />
general line shape <strong>and</strong> <strong>the</strong> positions <strong>of</strong> <strong>the</strong> very faint peaks<br />
agree well with <strong>the</strong> calculated spectrum.<br />
Recently, nonresonant IXS measurements for CoO <strong>and</strong><br />
NiO have been performed by Larson et al. 54 The resulting<br />
frequency-dependent structure factors S(q,ω) have been<br />
converted to <strong>loss</strong> functions according to Eq. (3). Theyare<br />
plotted for low momentum transfers q = 2 Å −1 along two<br />
reciprocal directions in Figs. 6(c) <strong>and</strong> 6(d) toge<strong>the</strong>r with <strong>the</strong><br />
calculated <strong>loss</strong> <strong>spectra</strong> for q = 0. The direction dependence <strong>of</strong><br />
<strong>the</strong> measured curves is ra<strong>the</strong>r low for such small q. TheIXS<br />
data feature a pronounced <strong>loss</strong> peak whose position <strong>and</strong> line<br />
shape agree very well with <strong>the</strong> calculated <strong>loss</strong> <strong>spectra</strong> including<br />
excitonic <strong>and</strong> local-field effects for both CoO <strong>and</strong> NiO. Larger<br />
discrepancies are observed for <strong>the</strong> interb<strong>and</strong>-<strong>transition</strong> region,<br />
which is most likely due to <strong>the</strong> stronger q dependence <strong>of</strong> <strong>the</strong><br />
<strong>loss</strong> at lower energies <strong>and</strong> <strong>the</strong> fact that <strong>the</strong> measured data were<br />
obtained for small but nonvanishing momentum. For NiO,<br />
single-crystal EEL <strong>spectra</strong> have been reported by Gorschlüter<br />
<strong>and</strong> Merz. 65 The EELS data are in arbitrary units <strong>and</strong> have<br />
a significantly lower resolution than <strong>the</strong> IXS measurements.<br />
However, <strong>the</strong> main features <strong>of</strong> <strong>the</strong> <strong>loss</strong> function can also be<br />
identified <strong>and</strong> <strong>the</strong>ir positions agree fairly with <strong>the</strong> computed<br />
<strong>spectra</strong>. The overestimation <strong>of</strong> <strong>the</strong> <strong>spectra</strong>l strength in <strong>the</strong><br />
interb<strong>and</strong> region is most likely again due to <strong>the</strong> nonvanishing<br />
transferred momentum in <strong>the</strong> experiments.<br />
VI. SUMMARY AND CONCLUSIONS<br />
In this paper, we have studied <strong>the</strong> optical <strong>and</strong> <strong>energy</strong>-<strong>loss</strong><br />
properties <strong>of</strong> <strong>the</strong> <strong>antiferromagnetic</strong> TMOs MnO, FeO, CoO,<br />
<strong>and</strong> NiO using many-body perturbation <strong>the</strong>ory. The ab initio<br />
calculations are based on reliable quasiparticle b<strong>and</strong> structures<br />
that have been obtained previously in <strong>the</strong> HSE03+G 0 W 0<br />
approach. To reduce <strong>the</strong> computational effort <strong>and</strong> render<br />
<strong>the</strong> many-body calculations <strong>of</strong> <strong>the</strong> optical absorption<br />
<strong>spectra</strong> feasible, <strong>the</strong>se sophisticated b<strong>and</strong> structures were<br />
mimicked by means <strong>of</strong> <strong>the</strong> computationally less dem<strong>and</strong>ing<br />
GGA+U+ method. Subsequently, <strong>the</strong> BSE was solved to<br />
235122-9
CLAUDIA RÖDL AND FRIEDHELM BECHSTEDT PHYSICAL REVIEW B 86, 235122 (2012)<br />
obtain <strong>the</strong> frequency-dependent dielectric functions including<br />
excitonic <strong>and</strong> local-field effects in a wide <strong>spectra</strong>l range.<br />
These dielectric functions were converted to reflectivities <strong>and</strong><br />
optical absorption coefficients <strong>and</strong> compared to experimental<br />
data. Fur<strong>the</strong>rmore, <strong>the</strong> <strong>loss</strong> <strong>spectra</strong> at vanishing momentum<br />
transfer were also discussed.<br />
In <strong>the</strong> TMOs, <strong>the</strong> screened electron-hole attraction leads<br />
to a strong redshift <strong>of</strong> <strong>the</strong> optical absorption peaks compared<br />
to <strong>the</strong> independent-quasiparticle approach. It has been shown<br />
that <strong>the</strong> inclusion <strong>of</strong> excitonic effects is indispensable to obtain<br />
agreement with <strong>the</strong> experimentally observed absorption-peak<br />
positions. The analysis <strong>of</strong> <strong>the</strong> absorption <strong>spectra</strong> in terms <strong>of</strong><br />
contributing single-particle excitations reveals that <strong>the</strong> optical<br />
properties <strong>of</strong> <strong>the</strong> TMOs cannot be explained in a purely atomic<br />
picture. In reality, itinerant s <strong>and</strong> p states <strong>and</strong> localized d<br />
orbitals strongly overlap energetically <strong>and</strong> have to be treated<br />
on a common footing. We have shown that first-principles<br />
calculations that capture <strong>the</strong> full quasiparticle b<strong>and</strong> structure<br />
as well as <strong>the</strong> electron-hole interaction are necessary. Open<br />
questions concerning <strong>the</strong> systematic overestimation <strong>of</strong> <strong>the</strong><br />
absorption-peak intensities in our calculations remain. It<br />
cannot be excluded that improved <strong>the</strong>oretical methods have to<br />
be employed that take into account <strong>the</strong> many-body interactions<br />
on a more advanced level. On <strong>the</strong> o<strong>the</strong>r h<strong>and</strong>, also <strong>the</strong><br />
discrepancies between different experimental data for one <strong>and</strong><br />
<strong>the</strong> same material are surprisingly high, which is most likely<br />
due to sample-preparation problems.<br />
ACKNOWLEDGMENTS<br />
Helpful discussions with F. Fuchs, A. Schleife, R. Goldhahn,<br />
<strong>and</strong> P. Schley are gratefully acknowledged. This work<br />
was financially supported by <strong>the</strong> Deutsche Forschungsgemeinschaft<br />
(Project No. Be1346/20-1) <strong>and</strong> <strong>the</strong> European<br />
Community within <strong>the</strong> framework <strong>of</strong> <strong>the</strong> ETSF (Grant No.<br />
211956).<br />
1 P. A. Cox, Transition Metal Oxides. An Introduction to <strong>the</strong>ir<br />
Electronic Structure <strong>and</strong> Properties, The International Series <strong>of</strong><br />
Monographs on Chemistry (Clarendon Press, Oxford, 1995).<br />
2 A. K. Cheetham <strong>and</strong> D. A. O. Hope, Phys. Rev. B 27, 6964 (1983).<br />
3 W. Jauch, M. Reehuis, H. J. Bleif, F. Kubanek, <strong>and</strong> P. Pattison, Phys.<br />
Rev. B 64, 052102 (2001).<br />
4 A. Schrön, C. Rödl, <strong>and</strong> F. Bechstedt, Phys.Rev.B86, 115134<br />
(2012).<br />
5 J. H. de Boer <strong>and</strong> E. J. W. Verwey, Proc. Phys. Soc. 49, 59 (1937).<br />
6 N. F. Mott <strong>and</strong> R. Peierls, Proc. Phys. Soc. 49, 72 (1937).<br />
7 A. Fujimori <strong>and</strong> F. Minami, Phys. Rev. B 30, 957 (1984).<br />
8 X. Ren, I. Leonov, G. Keller, M. Kollar, I. Nekrasov, <strong>and</strong> D.<br />
Vollhardt, Phys.Rev.B74, 195114 (2006).<br />
9 J. Kuneš, V. I. Anisimov, S. L. Skornyakov, A. V. Lukoyanov, <strong>and</strong><br />
D. Vollhardt, Phys. Rev. Lett. 99, 156404 (2007).<br />
10 P. Hohenberg <strong>and</strong> W. Kohn, Phys. Rev. B 136, 864 (1964).<br />
11 W. Kohn <strong>and</strong> L. J. Sham, Phys. Rev. A 140, 1133 (1965).<br />
12 K. Terakura, T. Oguchi, A. R. Williams, <strong>and</strong> J. Kübler, Phys. Rev.<br />
B 30, 4734 (1984).<br />
13 V. I. Anisimov, J. Zaanen, <strong>and</strong> O. K. Andersen, Phys. Rev. B 44,<br />
943 (1991).<br />
14 S. L. Dudarev, G. A. Botton, S. Y. Savrasov, C. J. Humphreys, <strong>and</strong><br />
A. P. Sutton, Phys.Rev.B57, 1505 (1998).<br />
15 C. Franchini, V. Bayer, R. Podloucky, J. Paier, <strong>and</strong> G. Kresse, Phys.<br />
Rev. B 72, 045132 (2005).<br />
16 M. Marsman, J. Paier, A. Stroppa, <strong>and</strong> G. Kresse, J. Phys.: Condens.<br />
Matter 20, 064201 (2008).<br />
17 L. Hedin, Phys.Rev.A139, 796 (1965).<br />
18 S. V. Faleev, M. van Schilfgaarde, <strong>and</strong> T. Kotani, Phys. Rev. Lett.<br />
93, 126406 (2004).<br />
19 F. Fuchs, J. Furthmüller, F. Bechstedt, M. Shishkin, <strong>and</strong> G. Kresse,<br />
Phys.Rev.B76, 115109 (2007).<br />
20 C. Rödl, F. Fuchs, J. Furthmüller, <strong>and</strong> F. Bechstedt, Phys.Rev.B<br />
79, 235114 (2009).<br />
21 H. Jiang, R. I. Gomez-Abal, P. Rinke, <strong>and</strong> M. Scheffler, Phys. Rev.<br />
B 82, 045108 (2010).<br />
22 L. Messick, W. C. Walker, <strong>and</strong> R. G<strong>loss</strong>er, Phys. Rev. B 6, 3941<br />
(1972).<br />
23 Y. M. Ksendzov, I. L. Korobova, K. K. Sidorin, <strong>and</strong> G. P. Startsev,<br />
Fiz. Tverd. Tela (Leningrad) 18, 173 (1976).<br />
24 R. J. Powell <strong>and</strong> W. E. Spicer, Phys.Rev.B2, 2182 (1970).<br />
25 J. Heyd, G. E. Scuseria, <strong>and</strong> M. Ernzerh<strong>of</strong>, J. Chem. Phys. 118,<br />
8207 (2003).<br />
26 E. E. Salpeter <strong>and</strong> H. A. Be<strong>the</strong>, Phys. Rev. 84, 1232 (1951).<br />
27 G. Onida, L. Reining, <strong>and</strong> A. Rubio, Rev. Mod. Phys. 74, 601<br />
(2002).<br />
28 S. Albrecht, L. Reining, R. Del Sole, <strong>and</strong> G. Onida, Phys.Rev.Lett.<br />
80, 4510 (1998).<br />
29 L. X. Benedict, E. L. Shirley, <strong>and</strong> R. B. Bohn, Phys. Rev. Lett. 80,<br />
4514 (1998).<br />
30 M. Rohlfing <strong>and</strong> S. G. Louie, Phys.Rev.Lett.81, 2312 (1998).<br />
31 C. Rödl, F. Fuchs, J. Furthmüller, <strong>and</strong> F. Bechstedt, Phys.Rev.B<br />
77, 184408 (2008).<br />
32 P. Nozières <strong>and</strong> D. Pines, Phys. Rev. 113, 1254 (1959).<br />
33 S. L. Adler, Phys. Rev. 126, 413 (1962).<br />
34 N. Wiser, Phys. Rev. 129, 62 (1963).<br />
35 G. Kresse <strong>and</strong> J. Furthmüller, Comput. Mater. Sci. 6, 15 (1996),<br />
http://www.sciencedirect.com/science/article/B6TWM-3VRVTBF-<br />
3/2/88689b1e acfe2b5fe57f09d37eff3b74.<br />
36 G. Kresse <strong>and</strong> D. Joubert, Phys. Rev. B 59, 1758 (1999).<br />
37 M. Shishkin <strong>and</strong> G. Kresse, Phys. Rev. B 74, 035101 (2006).<br />
38 W. L. Roth, Phys. Rev. 110, 1333 (1958).<br />
39 B. Hentschel, Z. Naturforsch. A 25, 1996 (1970).<br />
40 A. Schleife, C. Rödl, F. Fuchs, J. Furthmüller, <strong>and</strong> F. Bechstedt,<br />
Phys. Rev. B 80, 035112 (2009).<br />
41 A. Schleife, J. B. Varley, F. Fuchs, C. Rödl, F. Bechstedt, P.<br />
Rinke, A. Janotti, <strong>and</strong> C. G. Van de Walle, Phys. Rev. B 83,<br />
035116 (2011).<br />
42 F. Fuchs, C. Rödl, A. Schleife, <strong>and</strong> F. Bechstedt, Phys.Rev.B78,<br />
085103 (2008).<br />
43 W. G. Schmidt, S. Glutsch, P. H. Hahn, <strong>and</strong> F. Bechstedt, Phys. Rev.<br />
B 67, 085307 (2003).<br />
44 F. Bechstedt, R. Del Sole, G. Cappellini, <strong>and</strong> L. Reining, Solid State<br />
Commun. 84, 765 (1992).<br />
45 J. N. Plendl, L. C. Mansur, S. S. Mitra, <strong>and</strong> I. F. Chang, Solid State<br />
Commun. 7, 109 (1969).<br />
235122-10
OPTICAL AND ENERGY-LOSS SPECTRA OF THE ... PHYSICAL REVIEW B 86, 235122 (2012)<br />
46 P. J. Gielisse, J. N. Plendl, L. C. Mansur, R. Marshall, S. S.<br />
Mitra, R. Mykolajewycz, <strong>and</strong> A. Smakula, J. Appl. Phys. 36, 2446<br />
(1965).<br />
47 S. Mochizuki <strong>and</strong> M. Satoh, Phys. Status Solidi B 106, 667<br />
(1981).<br />
48 B. Prévot, J. Biellmann, M. F. Meftah, <strong>and</strong> M. Sieskind, Phys. Status<br />
Solidi A 40, 503 (1977).<br />
49 J. E. Pask, D. J. Singh, I. I. Mazin, C. S. Hellberg, <strong>and</strong> J. Kortus,<br />
Phys.Rev.B64, 024403 (2001).<br />
50 N. Hiraoka, H. Okamura, H. Ishii, I. Jarrige, K. D.<br />
Tsuei, <strong>and</strong> Y. Q. Cai, Eur. Phys. J. B 70, 157<br />
(2009).<br />
51 T. D. Kang, H. S. Lee, <strong>and</strong> H. Lee, J. Korean Phys. Soc. 50, 632<br />
(2007).<br />
52 R. Goldhahn <strong>and</strong> P. Schley (unpublished).<br />
53 L. X. Benedict, E. L. Shirley, <strong>and</strong> R. B. Bohn, Phys. Rev. B 57,<br />
R9385 (1998).<br />
54 B. C. Larson, W. Ku, J. Z. Tischler, C.-C. Lee, O. D. Restrepo, A.<br />
G. Eguiluz, P. Zschack, <strong>and</strong> K. D. Finkelstein, Phys. Rev. Lett. 99,<br />
026401 (2007).<br />
55 L.-C. Duda, T. Schmitt, M. Magnuson, J. Forsberg, A. Olsson,<br />
J. Nordgren, K. Okada, <strong>and</strong> A. Kotani, Phys. Rev. Lett. 96, 067402<br />
(2006).<br />
56 R. N. Iskenderov, I. A. Drabkin, L. T. Emel’yanova, <strong>and</strong> Y. M.<br />
Ksendzov, Fiz. Tverd. Tela (Leningrad) 10, 2573 (1968).<br />
57 G. W. Pratt, Jr. <strong>and</strong> R. Coelho, Phys. Rev. 116, 281 (1959).<br />
58 R. Newman <strong>and</strong> R. M. Chrenko, Phys. Rev. 114, 1507 (1959).<br />
59 W. A. Harrison, Electronic Structure <strong>and</strong> <strong>the</strong> Properties <strong>of</strong> Solids<br />
(Dover, New York, 1989).<br />
60 M. Gajdoš, K. Hummer, G. Kresse, J. Furthmüller, <strong>and</strong> F. Bechstedt,<br />
Phys. Rev. B 73, 045112 (2006).<br />
61 P. Y. Yu <strong>and</strong> M. Cardona, Fundamentals <strong>of</strong> Semiconductors,3rded.<br />
(Springer, Berlin, 2005).<br />
62 A. Schleife, F. Fuchs, C. Rödl, J. Furthmüller, <strong>and</strong> F. Bechstedt,<br />
Phys. Status Solidi B 246, 2150 (2009).<br />
63 A. Schleife, C. Rödl, F. Fuchs, K. Hannewald, <strong>and</strong> F. Bechstedt,<br />
Phys. Rev. Lett. 107, 236405 (2011).<br />
64 B. Fromme, U. Brunokowski, <strong>and</strong> E. Kisker, Phys. Rev. B 58, 9783<br />
(1998).<br />
65 A. Gorschlüter <strong>and</strong> H. Merz, Int. J. Mod. Phys. B 7, 341 (1993).<br />
235122-11