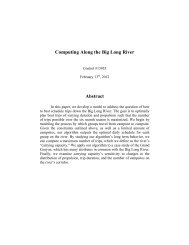
Team 13074: Best schedule to utilize the Big Long River
Team 13074: Best schedule to utilize the Big Long River
Team 13074: Best schedule to utilize the Big Long River

You also want an ePaper? Increase the reach of your titles
YUMPU automatically turns print PDFs into web optimized ePapers that Google loves.
team<strong>13074</strong><br />
page 18of20<br />
discussion.<br />
8.1 Stability with varying trip types chosen in 6<br />
In 6.2.2, we consider that choosing any one trip type as <strong>the</strong> first trip coming in<strong>to</strong> <strong>the</strong><br />
river will not significantly change <strong>the</strong> result. Here we will give <strong>the</strong> sensitivity analysis<br />
<strong>to</strong> defend this consideration. We set all <strong>the</strong> 24 trip types respectively as <strong>the</strong> first trip<br />
and obtain <strong>the</strong> numbers of trips in each <strong>schedule</strong>, as is shown in <strong>the</strong> chart.<br />
The first trip<br />
type<br />
Carrying<br />
capacity<br />
The first trip<br />
type<br />
Carrying<br />
capacity<br />
The first trip<br />
type<br />
Carrying<br />
capacity<br />
2 490 11 473 19 481<br />
4 479 12 483 20 487<br />
5 486 13 496 21 488<br />
6 486 14 493 22 500<br />
7 486 15 476 23 486<br />
8 490 16 478 24 482<br />
9 490 17 489 25 479<br />
10 486 18 485 26 488<br />
Chart13 carrying capacities due <strong>to</strong> varying first trip type<br />
From <strong>the</strong> data, we could conclude that different first trips could only cause slight<br />
differences in <strong>the</strong> results. So we could randomly select <strong>the</strong> first trip <strong>to</strong> get <strong>the</strong><br />
<strong>schedule</strong>.<br />
8.2 The sensitivity analysis of <strong>the</strong> assumption 44<br />
In assumption 44, we assume that passengers could spend no more than 8 hours<br />
per day on <strong>the</strong> river. However, different durations per day could change <strong>the</strong> results of<br />
our solutions. The following is <strong>the</strong> results of Part 2, setting type 22 trip as <strong>the</strong> first<br />
trip and using 7, 7.5, 8, 8.5, 9 hours as <strong>the</strong> largest time spent on <strong>the</strong> river every day.<br />
And it can be seen from <strong>the</strong> data that <strong>the</strong> results only change slightly, which could be<br />
served <strong>to</strong> low sensitiveness.<br />
Trip hour per day 7 7.5 8 8.5 9<br />
Carrying capacity 454 484 560 483 488<br />
Chart14 carrying capacities of varying trip hour per day<br />
8.3 The sensitivity analysis of <strong>the</strong> assumption 46<br />
In Part 2 and 3 we set 0.05 as <strong>the</strong> small probability of events that can be considered<br />
as not happening. And <strong>the</strong> following table includes <strong>the</strong> results setting type 22 trip as<br />
<strong>the</strong> first trip and using 0.01, 0.025, 0.05 as this small probability. And we could<br />
conclude that, <strong>the</strong> different setting of this parameter could cause <strong>the</strong> differences that<br />
should not be ignored.<br />
Small probability 0.01 0.025 0.05<br />
Carrying capacity 215 376 500<br />
9 Evaluation of <strong>the</strong> model<br />
Chart15 carrying capacities of varying small probability