Create successful ePaper yourself
Turn your PDF publications into a flip-book with our unique Google optimized e-Paper software.
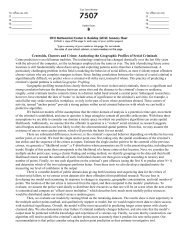
Baseline / Marine Pollution Bulletin 54 (2007) 464–488 487<br />
Table 2<br />
Abundance (pieces/km 2 ) and mass (g/km 2 ) of floating plastics in the North <strong>Pacific</strong> <strong>Ocean</strong> during 1972–2001<br />
Abundance (pieces/km 2 ) Mass (g/km 2 ) Literature<br />
Mean ± SD Maximum Mean ± SD Maximum<br />
Frequency of<br />
occurrence (%)<br />
Location Year Number of<br />
samples<br />
1972 33 63.6 – 34,000 300 3500 Wong et al. (1974)<br />
Subtropical North <strong>Pacific</strong> <strong>Ocean</strong><br />
along 35°N<br />
Bering sea 1974–1975 20 10.0 68 – – – Shaw (1977)<br />
Gulf of Alaska 1974–1975 51 23.5 132 – – – Shaw (1977)<br />
Subtropical North <strong>Pacific</strong> <strong>Ocean</strong> along 158°N<br />
1976 14 92.9 – – – 1250 Shaw and Mapes<br />
(1979)<br />
Bering sea 1985–1988 66 7.6 100 ± 600 – 1.0 ± 4.2 – Day et al. (1990)<br />
Subarctic North <strong>Pacific</strong> <strong>Ocean</strong> 1985–1988 64 71.9 12,800 ± 22,300 – 61.4 ± 225.5 – Day et al. (1990)<br />
Transional water 1985–1988 60 93.3 57,000 ± 72,800 316,800 291.6 ± 714.4 3940 Day et al. (1990)<br />
Subtropical North <strong>Pacific</strong> <strong>Ocean</strong> 1985–1988 2 100 61,000 ± 74,000 – 535.1 ± 726.1 1050 Day et al. (1990)<br />
Japan Sea and nearshore Japan 1985–1988 11 100 74,700 ± 73,800 221,000 128.2 ± 172.2 – Day et al. (1990)<br />
North <strong>Pacific</strong> Central Gyre a 1999 11 100 3,32,000 – – – Moore et al.<br />
(2001)<br />
Kuroshio Current area 2000–2001 76 72.4 174,000 ± 467,000 3,520,000 3600 ± 18,100 153,000 This study<br />
<strong>The</strong> sum of fragments, styrofoam pieces, pellets, fiber and thin plastic films.<br />
a<br />
153,000 g/km 2 ; Table 2) varied greatly among stations. <strong>The</strong><br />
highest abundance was found at 32°58 0 N, 138°00 0 E near<br />
the Kuroshio flow path. Densities of plastic were low in<br />
coastal regions and in areas south of 31°30 0 N (Fig. 1B).<br />
Both surface currents and winds could be responsible for<br />
the dispersal of plastics away from the source area on land<br />
(Ryan, 1988). Although Ryan (1988) observed a decrease<br />
in the abundance of plastics with distance from shore off<br />
southwestern South Africa, our results showed the opposite<br />
pattern, with plastic densities being an order of magnitude<br />
higher 150 km offshore (1 · 10 5 pieces/km 2 ) than<br />
they were near the coast (1 · 10 4 pieces/km 2 ). Plastics<br />
were especially abundant around 32–33°N, where the<br />
Kuroshio Current flows (Fig. 1A). Hence, our results give<br />
solid evidence for the hypothesis of Day and Shaw (1987)<br />
that the Kuroshio Current plays a role in transporting<br />
and distributing plastics all over the North <strong>Pacific</strong> <strong>Ocean</strong>.<br />
Fragments of plastic products and plastic sheets were<br />
recorded at 55% (42 of 76 stations) and 54% (41 of 76 stations),<br />
respectively, of the stations. Plastic resin pellets were<br />
found at 20% of the stations. Fragments of plastic products<br />
were dominant numerically, consisting 56% of all plastic<br />
pieces that were collected (Table 1). Styrofoam was the second<br />
most abundant material (21% of all plastic pieces). In<br />
contrast, resin pellets constituted a minor component of<br />
the plastic collected (1% of all plastic pieces). <strong>The</strong>se proportions<br />
of fragments of plastic products and plastic resin<br />
pellets were similar to those observed in the North <strong>Pacific</strong><br />
Central Gyre (Moore et al., 2001). However, the proportion<br />
of styrofoam was higher in the Kuroshio Current area<br />
(21% of all plastic pieces) than in the North <strong>Pacific</strong> Central<br />
Gyre (1%; Moore et al., 2001). This difference is probably<br />
related to the fact that styrofoam absorbs water, loses<br />
buoyancy, and sinks during the long time it takes to drift<br />
into the North <strong>Pacific</strong> Central Gyre.<br />
<strong>The</strong> size of plastic pieces ranged from 1 mm to 280 mm.<br />
<strong>The</strong> dominant size-class was 3 mm (30% of all plastic<br />
pieces; Table 1). In contrast, pieces of plastic >11 mm represented<br />
only 8% of all plastic. Surprisingly, smaller plastics<br />
of size-class 1–3 mm formed a numerically dominant<br />
component (62%) of all marine plastic debris. Although<br />
there is little information on the size of plastics in the ocean<br />
(Shaw and Day, 1994; Moore et al., 2002), Moore et al.<br />
(2001) also found that small plastic (