

Wilcox, D.A, Thompson, T.A., Booth, R.K., and Nicholas, J.R., Lake ...
Wilcox, D.A, Thompson, T.A., Booth, R.K., and Nicholas, J.R., Lake ...
Wilcox, D.A, Thompson, T.A., Booth, R.K., and Nicholas, J.R., Lake ...

You also want an ePaper? Increase the reach of your titles
YUMPU automatically turns print PDFs into web optimized ePapers that Google loves.
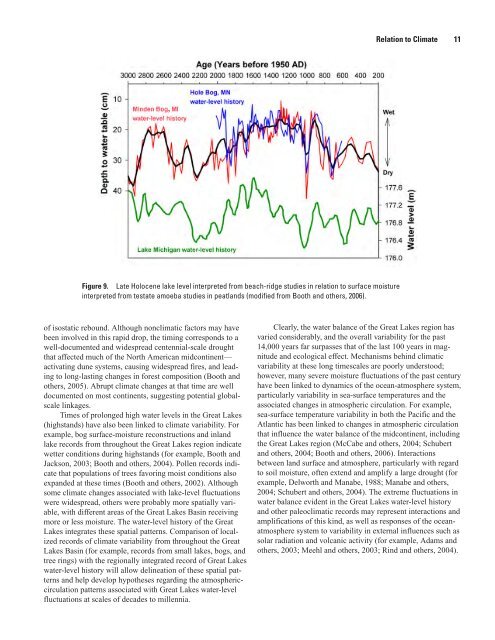
Relation to Climate 11<br />
,<br />
Figure 9. Late Holocene lake level interpreted from beach-ridge studies in relation to surface moisture<br />
interpreted from testate amoeba studies in peatl<strong>and</strong>s (modified from <strong>Booth</strong> <strong>and</strong> others, 2006).<br />
of isostatic rebound. Although nonclimatic factors may have<br />
been involved in this rapid drop, the timing corresponds to a<br />
well-documented <strong>and</strong> widespread centennial-scale drought<br />
that affected much of the North American midcontinent—<br />
activating dune systems, causing widespread fires, <strong>and</strong> leading<br />
to long-lasting changes in forest composition (<strong>Booth</strong> <strong>and</strong><br />
others, 2005). Abrupt climate changes at that time are well<br />
documented on most continents, suggesting potential globalscale<br />
linkages.<br />
Times of prolonged high water levels in the Great <strong>Lake</strong>s<br />
(highst<strong>and</strong>s) have also been linked to climate variability. For<br />
example, bog surface-moisture reconstructions <strong>and</strong> inl<strong>and</strong><br />
lake records from throughout the Great <strong>Lake</strong>s region indicate<br />
wetter conditions during highst<strong>and</strong>s (for example, <strong>Booth</strong> <strong>and</strong><br />
Jackson, 2003; <strong>Booth</strong> <strong>and</strong> others, 2004). Pollen records indicate<br />
that populations of trees favoring moist conditions also<br />
exp<strong>and</strong>ed at these times (<strong>Booth</strong> <strong>and</strong> others, 2002). Although<br />
some climate changes associated with lake-level fluctuations<br />
were widespread, others were probably more spatially variable,<br />
with different areas of the Great <strong>Lake</strong>s Basin receiving<br />
more or less moisture. The water-level history of the Great<br />
<strong>Lake</strong>s integrates these spatial patterns. Comparison of localized<br />
records of climate variability from throughout the Great<br />
<strong>Lake</strong>s Basin (for example, records from small lakes, bogs, <strong>and</strong><br />
tree rings) with the regionally integrated record of Great <strong>Lake</strong>s<br />
water-level history will allow delineation of these spatial patterns<br />
<strong>and</strong> help develop hypotheses regarding the atmosphericcirculation<br />
patterns associated with Great <strong>Lake</strong>s water-level<br />
fluctuations at scales of decades to millennia.<br />
Clearly, the water balance of the Great <strong>Lake</strong>s region has<br />
varied considerably, <strong>and</strong> the overall variability for the past<br />
14,000 years far surpasses that of the last 100 years in magnitude<br />
<strong>and</strong> ecological effect. Mechanisms behind climatic<br />
variability at these long timescales are poorly understood;<br />
however, many severe moisture fluctuations of the past century<br />
have been linked to dynamics of the ocean-atmosphere system,<br />
particularly variability in sea-surface temperatures <strong>and</strong> the<br />
associated changes in atmospheric circulation. For example,<br />
sea-surface temperature variability in both the Pacific <strong>and</strong> the<br />
Atlantic has been linked to changes in atmospheric circulation<br />
that influence the water balance of the midcontinent, including<br />
the Great <strong>Lake</strong>s region (McCabe <strong>and</strong> others, 2004; Schubert<br />
<strong>and</strong> others, 2004; <strong>Booth</strong> <strong>and</strong> others, 2006). Interactions<br />
between l<strong>and</strong> surface <strong>and</strong> atmosphere, particularly with regard<br />
to soil moisture, often extend <strong>and</strong> amplify a large drought (for<br />
example, Delworth <strong>and</strong> Manabe, 1988; Manabe <strong>and</strong> others,<br />
2004; Schubert <strong>and</strong> others, 2004). The extreme fluctuations in<br />
water balance evident in the Great <strong>Lake</strong>s water-level history<br />
<strong>and</strong> other paleoclimatic records may represent interactions <strong>and</strong><br />
amplifications of this kind, as well as responses of the oceanatmosphere<br />
system to variability in external influences such as<br />
solar radiation <strong>and</strong> volcanic activity (for example, Adams <strong>and</strong><br />
others, 2003; Meehl <strong>and</strong> others, 2003; Rind <strong>and</strong> others, 2004).
12 <strong>Lake</strong>-Level Variability <strong>and</strong> Water Availability in the Great <strong>Lake</strong>s<br />
Relation to Storage<br />
Because of its large areal coverage <strong>and</strong> deep basin, <strong>Lake</strong><br />
Superior stores more water (2,900 mi 3 at chart datum) than<br />
all the other lakes combined (2,539 mi 3 at chart datum). The<br />
maximum storage in <strong>Lake</strong> Superior in recorded history<br />
was 2,949 mi 3 in October 1985 (fig. 10). Storage was only<br />
2,925 mi 3 during the low-lake-level period in April 1926. The<br />
average change in storage from wintertime low to summertime<br />
high is 6 mi 3 .<br />
Storage at chart datum in <strong>Lake</strong> Michigan is 1,180 mi 3 <strong>and</strong><br />
in <strong>Lake</strong> Huron is 850 mi 3 . The maximum storage in recorded<br />
history for combined <strong>Lake</strong> Michigan-Huron was 2,053 mi 3 in<br />
How much water is in a cubic mile?<br />
A cubic mile is about 1.1 trillion gallons or a football<br />
field filled to a depth of about 2.5 million feet.<br />
How much water is in the Great <strong>Lake</strong>s?<br />
Water from the Great <strong>Lake</strong>s could cover North<br />
America, South America, <strong>and</strong> Africa to a depth of more<br />
than 1 foot (Neff <strong>and</strong> <strong>Nicholas</strong>, 2005).<br />
2955<br />
LAKE SUPERIOR<br />
2950<br />
2945<br />
2940<br />
2935<br />
2930<br />
2925<br />
TOTAL STORAGE, IN CUBIC MILES<br />
2920<br />
2055<br />
2050<br />
2045<br />
2040<br />
2035<br />
2030<br />
2025<br />
2020<br />
125<br />
120<br />
115<br />
LAKE MICHIGAN-HURON<br />
LAKE ERIE<br />
110<br />
400<br />
LAKE ONTARIO<br />
395<br />
390<br />
385<br />
1<br />
8<br />
6<br />
0<br />
1<br />
8<br />
7<br />
0<br />
1<br />
8<br />
8<br />
0<br />
1<br />
8<br />
9<br />
0<br />
1<br />
9<br />
0<br />
0<br />
1<br />
9<br />
1<br />
0<br />
1<br />
9<br />
2<br />
0<br />
1<br />
9<br />
3<br />
0<br />
1<br />
9<br />
4<br />
0<br />
1<br />
9<br />
5<br />
0<br />
1<br />
9<br />
6<br />
0<br />
1<br />
9<br />
7<br />
0<br />
1<br />
9<br />
8<br />
0<br />
1<br />
9<br />
9<br />
0<br />
2<br />
0<br />
0<br />
0<br />
Figure 10. Water storage for the Great lakes, 1860–2005.
Relation to Coastal Ecosystems 13<br />
June 1886, <strong>and</strong> the minimum was 2,022 mi 3 in March 1964.<br />
The recent drop in the peak lake level from 582.3 ft in October<br />
1986 to 576.5 ft in March 2003 (see fig. 6) resulted in a reduction<br />
in storage of nearly 27 mi 3 . The average change in storage<br />
from wintertime low to summertime high is 4.6 mi 3 in <strong>Lake</strong><br />
Michigan-Huron.<br />
In <strong>Lake</strong> Erie, storage at chart datum is 116 mi 3 ; the<br />
maximum storage at high lake level in June 1986 was 126 mi 3 ,<br />
<strong>and</strong> the minimum storage was 114 mi 3 in February 1936. Total<br />
storage changed by about 8 mi 3 between high lake levels in<br />
June 1997 <strong>and</strong> low lake levels in January 2001. On average,<br />
the change in storage between wintertime low <strong>and</strong> summertime<br />
high is 2.1 mi 3 .<br />
Storage in <strong>Lake</strong> Ontario at chart datum is 393 mi 3 .<br />
Maximum recorded water storage was 400 mi 3 in June 1952,<br />
<strong>and</strong> the minimum was 391 mi 3 in November 1934, both prior<br />
to lake-level regulation. The variability in storage has been<br />
reduced by regulation, with a difference of only 6 mi 3 between<br />
the recent high in May 1993 <strong>and</strong> the low in December 1998.<br />
The average change in storage of the regulated lake is 2.4 mi 3<br />
between wintertime low <strong>and</strong> summertime high.<br />
Because of the large capacities of the lakes, alterations<br />
of storage due to diversions are relatively minor. The Chicago<br />
diversion from <strong>Lake</strong> Michigan averages 3,200 ft 3 /s, which<br />
results in a yearly diversion of about 0.69 mi 3 , only about<br />
0.06 percent of the total <strong>Lake</strong> Michigan storage. One uniform<br />
rainstorm dropping less than 2 in. of rain directly on the lake<br />
would yield the same volume.<br />
Relation to Coastal Ecosystems<br />
Water-level fluctuations in the Great <strong>Lake</strong>s are of great<br />
ecological importance in the coastal zone because even small<br />
changes in lake level can shift large areas from being flooded<br />
to being exposed <strong>and</strong> vice versa. The vegetation of shallowwater<br />
areas in the Great <strong>Lake</strong>s is the one biotic resource most<br />
directly affected by natural or regulated changes in water level.<br />
Individual plant species <strong>and</strong> communities of species have<br />
affinities <strong>and</strong> physiological adaptations for certain water-depth<br />
ranges, <strong>and</strong> their life forms may show adaptations for different<br />
water-depth environments. Changes in water level add<br />
a dynamic aspect to the species-depth relation <strong>and</strong> result in<br />
shifting mosaics of wetl<strong>and</strong> vegetation types. In general, high<br />
water levels kill trees, shrubs, <strong>and</strong> other emergent vegetation,<br />
<strong>and</strong> low water levels following these highs result in<br />
seed germination <strong>and</strong> growth of a multitude of species (fig.<br />
11). Some species are particularly well suited to recolonizing<br />
exposed areas during low-water phases, <strong>and</strong> several emergents<br />
may coexist there because of their diverse responses to natural<br />
disturbance.<br />
In the first year after a reduction in water levels, the distribution<br />
of new seedlings is due to the distribution of seeds in<br />
the sediments. In ensuing years, the distribution of full-grown<br />
plants is due to survival of seedlings as they compete for growing<br />
area. If one species is favored in early colonization, its<br />
density may be great enough that it can maintain dominance of<br />
an area. In most cases, early colonizing species or communities<br />
are later lost through competitive displacement, but the<br />
opportunity to go through a life cycle allows them to replenish<br />
the seed bank in the sediments (see box 3). Occasional low<br />
water levels are also needed to restrict growth of plants that<br />
require wet conditions, such as cattails, at higher elevations<br />
in wetl<strong>and</strong>s that are typically colonized by sedges <strong>and</strong> grasses<br />
(see box 4).<br />
The magnitude of lake-level fluctuations is of obvious<br />
importance to bordering wetl<strong>and</strong> vegetation because it directly<br />
results in different water-depth environments (Environment<br />
Canada, 2002). The different plant communities that develop<br />
in a Great <strong>Lake</strong>s wetl<strong>and</strong> shift from one location to another in<br />
response to changes in water depth. The water-depth history<br />
largely determines the species composition of a particular<br />
site at a given point in time, with resultant zonation patterns<br />
sometimes becoming obvious (fig. 12). Forested <strong>and</strong> shrubdominated<br />
wetl<strong>and</strong>s occur in areas that are rarely covered with<br />
water. Meadow marsh occurs in areas that are occasionally<br />
covered with water. Dense emergent marsh occurs where the<br />
substrate is covered <strong>and</strong> uncovered with water on a shortterm<br />
basis. Sparse emergent marsh occurs if st<strong>and</strong>ing water is<br />
deeper <strong>and</strong> present in most years, <strong>and</strong> submersed <strong>and</strong> floating<br />
leaf communities dominate if st<strong>and</strong>ing water is nearly always<br />
present.<br />
The frequency, timing, <strong>and</strong> duration of water-level<br />
fluctuations are also important for several reasons. Effects of<br />
seiches are poorly understood, although they can affect zonation<br />
of plant communities by keeping soils wet <strong>and</strong> limiting<br />
germination from the seed bank. Seasonal differences in the<br />
timing of water-level declines are important, especially in the<br />
Great <strong>Lake</strong>s, where the peak water levels occur in the summer<br />
<strong>and</strong> the lows occur in the winter (opposite the changes in<br />
most inl<strong>and</strong> wetl<strong>and</strong>s). An early summer peak <strong>and</strong> subsequent<br />
beginning of water-level decline allows more plants to grow<br />
from the seed bank than does a later peak. Water-level declines<br />
in winter can result in ice-induced sediment erosion. Consistent<br />
annual fluctuations during the growing season favor<br />
the species that are most competitive under those conditions,<br />
whereas variable summer water levels produce changing environmental<br />
conditions <strong>and</strong> result in variability in the vegetation.<br />
Great <strong>Lake</strong>s wetl<strong>and</strong>s also provide valuable habitat for<br />
fish <strong>and</strong> wildlife (<strong>Wilcox</strong>, 1995; Environment Canada, 2002).<br />
Many invertebrates are closely associated with macrophyte<br />
beds; waterfowl, aquatic mammals, <strong>and</strong> small fish are attracted<br />
to these areas because they provide food <strong>and</strong> shelter. When<br />
water levels change, habitats <strong>and</strong> organism interactions<br />
change also. Flooding of emergent plant communities allows<br />
access for spawning fish, reduces mink predation on muskrats,<br />
<strong>and</strong> increases hemi-marsh habitat (half vegetated, half<br />
open water) preferred by waterfowl. Flooded, detrital plant<br />
materials are also colonized by invertebrates that are fed on<br />
by waterfowl. Low water levels can jeopardize fish spawning<br />
<strong>and</strong> reduce waterfowl nesting area; yet, they provide the
14 <strong>Lake</strong>-Level Variability <strong>and</strong> Water Availability in the Great <strong>Lake</strong>s<br />
Figure 11. Simplified diagram of the effects of water-level fluctuations on coastal wetl<strong>and</strong> plant<br />
communities (from Maynard <strong>and</strong> <strong>Wilcox</strong>, 1997).<br />
opportunity for regeneration of the plant communities that are<br />
the foundation of the habitat. Water-level fluctuations promote<br />
the interaction of aquatic <strong>and</strong> terrestrial systems <strong>and</strong> result in<br />
higher-quality habitat <strong>and</strong> increased productivity. When the<br />
fluctuations in water levels are removed through stabilization,<br />
shifting of vegetation types decreases, more stable plant<br />
communities develop, species diversity decreases, <strong>and</strong> habitat<br />
value decreases.<br />
The effect of water-level changes on shorelines varies<br />
with the morphology, composition, <strong>and</strong> dominant processes<br />
of the coast. Variability in lake levels causes erosional <strong>and</strong><br />
depositional processes to take place at different elevations over<br />
time. The most dramatic effect is the impact of an elevated<br />
storm surge during high lake levels, flooding low-lying areas<br />
<strong>and</strong> eroding mobile substrates. These storms can liberate sediment<br />
from upl<strong>and</strong> areas, feeding the littoral system, <strong>and</strong> can<br />
ultimately nourish downdrift shorelines. The effects of this<br />
nourishment may not be seen until times of low water levels<br />
when exposed s<strong>and</strong> bars, widened beaches, <strong>and</strong> dune growth<br />
are evident.<br />
Water-level fluctuations in the Great <strong>Lake</strong>s also play a<br />
major role in development <strong>and</strong> stabilization of coastal dunes<br />
(fig. 13). Studies of buried soils within dunes along the<br />
southeastern shore of <strong>Lake</strong> Superior <strong>and</strong> eastern shore of <strong>Lake</strong><br />
Michigan show that dune building occurred during the high<br />
lake-level periods that have recurred about every 160 years.
Relation to Coastal Ecosystems 15<br />
Box 3. Some species are particularly well suited to recolonizing exposed areas during low-water phases, <strong>and</strong> several<br />
emergents may coexist there because of their diverse responses to natural disturbance.<br />
Drowned-river-mouth wetl<strong>and</strong> in Pigeon River near Port<br />
Sheldon, Michigan; photo taken in spring 1999 after <strong>Lake</strong><br />
Michigan water levels dropped more than 1.5 ft from<br />
the previous year. Note the lack of emergent vegetation<br />
along the shore.<br />
Same wetl<strong>and</strong> in late summer 2000; photo shows mostly<br />
annual emergent plants along the shore that grew from<br />
the seed bank.<br />
Same wetl<strong>and</strong> in 2001; photo shows perennial emergent<br />
plants displacing annuals along the shore.<br />
Same wetl<strong>and</strong> in 2003; photo shows a shift in vegetation<br />
to a different perennial plant community.


