Microseismic Monitoring of Newberry Volcano EGS Demonstration
Microseismic Monitoring of Newberry Volcano EGS Demonstration
Microseismic Monitoring of Newberry Volcano EGS Demonstration

You also want an ePaper? Increase the reach of your titles
YUMPU automatically turns print PDFs into web optimized ePapers that Google loves.
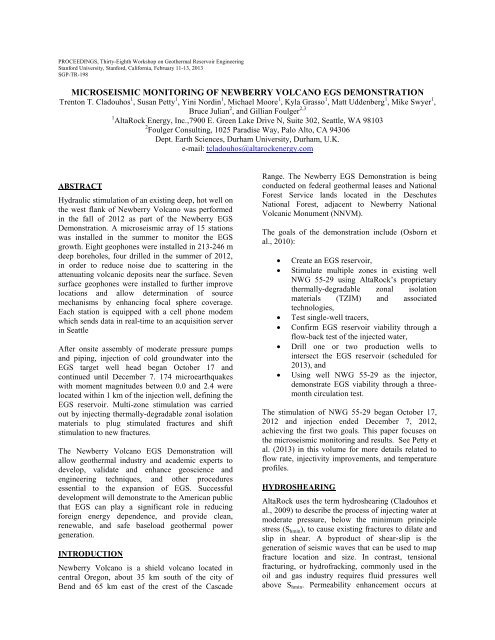
PROCEEDINGS, Thirty-Eighth Workshop on Geothermal Reservoir Engineering<br />
Stanford University, Stanford, California, February 11-13, 2013<br />
SGP-TR-198<br />
MICROSEISMIC MONITORING OF NEWBERRY VOLCANO <strong>EGS</strong> DEMONSTRATION<br />
Trenton T. Cladouhos 1 , Susan Petty 1 , Yini Nordin 1 , Michael Moore 1 , Kyla Grasso 1 , Matt Uddenberg 1 , Mike Swyer 1 ,<br />
Bruce Julian 2 , and Gillian Foulger 2,3<br />
1 AltaRock Energy, Inc.,7900 E. Green Lake Drive N, Suite 302, Seattle, WA 98103<br />
2 Foulger Consulting, 1025 Paradise Way, Palo Alto, CA 94306<br />
Dept. Earth Sciences, Durham University, Durham, U.K.<br />
e-mail: tcladouhos@altarockenergy.com<br />
ABSTRACT<br />
Hydraulic stimulation <strong>of</strong> an existing deep, hot well on<br />
the west flank <strong>of</strong> <strong>Newberry</strong> <strong>Volcano</strong> was performed<br />
in the fall <strong>of</strong> 2012 as part <strong>of</strong> the <strong>Newberry</strong> <strong>EGS</strong><br />
<strong>Demonstration</strong>. A microseismic array <strong>of</strong> 15 stations<br />
was installed in the summer to monitor the <strong>EGS</strong><br />
growth. Eight geophones were installed in 213-246 m<br />
deep boreholes, four drilled in the summer <strong>of</strong> 2012,<br />
in order to reduce noise due to scattering in the<br />
attenuating volcanic deposits near the surface. Seven<br />
surface geophones were installed to further improve<br />
locations and allow determination <strong>of</strong> source<br />
mechanisms by enhancing focal sphere coverage.<br />
Each station is equipped with a cell phone modem<br />
which sends data in real-time to an acquisition server<br />
in Seattle<br />
After onsite assembly <strong>of</strong> moderate pressure pumps<br />
and piping, injection <strong>of</strong> cold groundwater into the<br />
<strong>EGS</strong> target well head began October 17 and<br />
continued until December 7. 174 microearthquakes<br />
with moment magnitudes between 0.0 and 2.4 were<br />
located within 1 km <strong>of</strong> the injection well, defining the<br />
<strong>EGS</strong> reservoir. Multi-zone stimulation was carried<br />
out by injecting thermally-degradable zonal isolation<br />
materials to plug stimulated fractures and shift<br />
stimulation to new fractures.<br />
The <strong>Newberry</strong> <strong>Volcano</strong> <strong>EGS</strong> <strong>Demonstration</strong> will<br />
allow geothermal industry and academic experts to<br />
develop, validate and enhance geoscience and<br />
engineering techniques, and other procedures<br />
essential to the expansion <strong>of</strong> <strong>EGS</strong>. Successful<br />
development will demonstrate to the American public<br />
that <strong>EGS</strong> can play a significant role in reducing<br />
foreign energy dependence, and provide clean,<br />
renewable, and safe baseload geothermal power<br />
generation.<br />
INTRODUCTION<br />
<strong>Newberry</strong> <strong>Volcano</strong> is a shield volcano located in<br />
central Oregon, about 35 km south <strong>of</strong> the city <strong>of</strong><br />
Bend and 65 km east <strong>of</strong> the crest <strong>of</strong> the Cascade<br />
Range. The <strong>Newberry</strong> <strong>EGS</strong> <strong>Demonstration</strong> is being<br />
conducted on federal geothermal leases and National<br />
Forest Service lands located in the Deschutes<br />
National Forest, adjacent to <strong>Newberry</strong> National<br />
Volcanic Monument (NNVM).<br />
The goals <strong>of</strong> the demonstration include (Osborn et<br />
al., 2010):<br />
<br />
<br />
<br />
<br />
<br />
<br />
Create an <strong>EGS</strong> reservoir,<br />
Stimulate multiple zones in existing well<br />
NWG 55-29 using AltaRock‘s proprietary<br />
thermally-degradable zonal isolation<br />
materials (TZIM) and associated<br />
technologies,<br />
Test single-well tracers,<br />
Confirm <strong>EGS</strong> reservoir viability through a<br />
flow-back test <strong>of</strong> the injected water,<br />
Drill one or two production wells to<br />
intersect the <strong>EGS</strong> reservoir (scheduled for<br />
2013), and<br />
Using well NWG 55-29 as the injector,<br />
demonstrate <strong>EGS</strong> viability through a threemonth<br />
circulation test.<br />
The stimulation <strong>of</strong> NWG 55-29 began October 17,<br />
2012 and injection ended December 7, 2012,<br />
achieving the first two goals. This paper focuses on<br />
the microseismic monitoring and results. See Petty et<br />
al. (2013) in this volume for more details related to<br />
flow rate, injectivity improvements, and temperature<br />
pr<strong>of</strong>iles.<br />
HYDROSHEARING<br />
AltaRock uses the term hydroshearing (Cladouhos et<br />
al., 2009) to describe the process <strong>of</strong> injecting water at<br />
moderate pressure, below the minimum principle<br />
stress (S hmin ), to cause existing fractures to dilate and<br />
slip in shear. A byproduct <strong>of</strong> shear‐slip is the<br />
generation <strong>of</strong> seismic waves that can be used to map<br />
fracture location and size. In contrast, tensional<br />
fracturing, or hydr<strong>of</strong>racking, commonly used in the<br />
oil and gas industry requires fluid pressures well<br />
above S hmin . Permeability enhancement occurs at
lower fluid pressures during hydroshearing because<br />
hydroshearing relies on displacement along<br />
preexisting fractures, as opposed to hydr<strong>of</strong>racking<br />
that creates entirely new fractures. Hydroshearing<br />
opens natural fractures that will dilate and remain<br />
open, even when fluid pressure is reduced, because <strong>of</strong><br />
the irregularities <strong>of</strong> natural fracture surfaces.<br />
It should be noted that hydroshearing is a simplified<br />
conceptual model with assumptions that are likely<br />
broken in the real-world. For example, an existing<br />
crack may open, close or shear depending on its<br />
orientation, cohesive strength and local stresses. The<br />
important distinction is that the stimulation<br />
equipment is designed to remain below S hmin in<br />
hydroshearing, while in hydr<strong>of</strong>racking it is designed<br />
exceed S hmin .<br />
Another implicit assumption <strong>of</strong> <strong>EGS</strong>/hydroshearing is<br />
that microseismicity illuminates flow paths <strong>of</strong> the<br />
injected fluid that can be traced back to the injection<br />
well. However, because microseismicity is thought to<br />
be induced by a change in fluid pressure, fluid<br />
movement may not always be needed. Rather seismic<br />
events located away from the well could be related to<br />
fluid pressure connection only. This is one reason<br />
why tracers were injected as part <strong>of</strong> the <strong>EGS</strong><br />
<strong>Demonstration</strong>, to eventually evaluate connectivity.<br />
On average the new holes took 11 drilling days to<br />
complete. In addition, one existing water well<br />
(NN18) was deepened to improve coupling to the<br />
bedrock for the geophone. The holes were drilled by<br />
a Foremost DR-24 drill rig owned and operated by<br />
Tacoma Pump & Drilling <strong>of</strong> Graham, Washington. It<br />
took 3 months to drill all five holes. In addition, three<br />
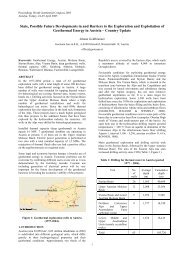
holes drilled in 2009 and 2010 (NN32, NN09, and<br />
NN07 on Figure 1) by a DOE-funded exploration<br />
project awarded to lease-holder Davenport <strong>Newberry</strong>,<br />
were used as monitoring holes.<br />
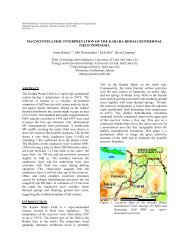
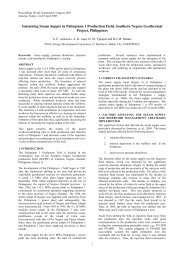
Seismic equipment installation began in early August<br />
2012. Two-Hz geophones were installed at 7 surface<br />
sites and 8 borehole sites. The surface equipment<br />
(Figure 2) at each site included two 80-Watt solar<br />
panels, a GPS antenna and one or two cell phone<br />
antennas mounted in a tree to ensure that snow would<br />
not cover equipment that needed to stay exposed. In a<br />
H<strong>of</strong>fman box at the base <strong>of</strong> the tree, we installed a<br />
digitizer, wireless cell modem, solar charge<br />
controllers, and two 12-V batteries.<br />
PHASE II 55-29 STIMULATION<br />
PREPARATION<br />
Phase II <strong>of</strong> the <strong>Newberry</strong> <strong>EGS</strong> <strong>Demonstration</strong>s began<br />
in April 2012 after a Finding <strong>of</strong> No Significant<br />
Impact (FONSI) was issued by the Bureau <strong>of</strong> Land<br />
Management on the project‘s Environmental<br />
Assessment. Phase I planning and permitting is<br />
described by Osborn et al. (2011), AltaRock (2011),<br />
BLM (2012), and Cladouhos et al. (2012).<br />
MSA Installation<br />
In Phase I, a microseismic array (MSA) <strong>of</strong> 5 stations<br />
was proposed in order to map the <strong>EGS</strong> reservoir and<br />
provide real-time monitoring required by the projectspecific<br />
Induced Seismicity Mitigation Plan<br />
(AltaRock, 2011; BLM, 2011; Cladouhos et al,<br />
2012). Starting in late May, after snow melt, four<br />
new MSA monitoring holes (NN17, NN19, NN21,<br />
and NN24 on Figure 1) were drilled to depths<br />
between 213 and 246 m. The depth <strong>of</strong> these holes<br />
was chosen so that the geophones could be installed<br />
below the water table, in sections <strong>of</strong> competent rock<br />
at least 30 m long, and below the highly attenuating,<br />
cinders and debris flows on the flanks <strong>of</strong> the<br />
<strong>Newberry</strong> <strong>Volcano</strong>. The holes were drilled using the<br />
air hammer and casing-while-drill technique and<br />
were completed with 5‖ steel casing cemented from<br />
TD to the surface.<br />
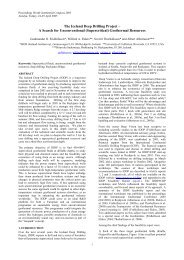
Figure 1: MSA locations, <strong>EGS</strong> well 55-29, and<br />
<strong>Newberry</strong> National Volcanic Monument<br />
(green shading).
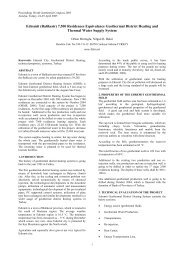
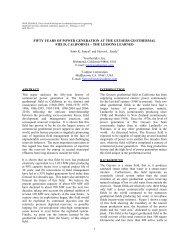
The borehole geophones were equipped with an<br />
adapter that fit into the hole locks (Figure 3).<br />
The 15 stations stream continuous data to a server<br />
running acquisition s<strong>of</strong>tware at AltaRock‘s <strong>of</strong>fice in<br />
Seattle. All continuous data are saved and archived<br />
by AltaRock. Triggered waveforms are sent to<br />
Lawrence Berkeley National Lab (LBNL) for<br />
locating and publishing to the public website (LBNL,<br />
2013).<br />
Strong-Motion Sensor<br />
In order to monitor any potential shaking at the<br />
nearest buildings due to injection-induced seismicity,<br />
a strong-motion sensor (SMS) was installed, bolted to<br />
the concrete floor <strong>of</strong> a USFS building near Paulina<br />
Lake. This site was connected to the Pacific<br />
Northwest Seismic Network (PNSNa, 2013) by cell<br />
modem and coded as NNVM (Figure 1).<br />
Figure 2: Typical <strong>Newberry</strong> surface MSA equipment.<br />
Background Seismicity<br />
The regional network at <strong>Newberry</strong> <strong>Volcano</strong> has<br />
improved greatly in the past two years. In 2009, the<br />
only station was NCO, a single-component, shortperiod<br />
seismometer on the east flank and only four<br />
microearthquakes were detected on <strong>Newberry</strong> in the<br />
prior 25 years. In 2011, the USGS installed six threecomponent<br />
broadband seismometers and one threecomponent<br />
short-period sensor (PNSNa, 2013). In<br />
late August 2012, three <strong>of</strong> the borehole stations in the<br />
AltaRock <strong>Newberry</strong> MSA (NN19, NN17, and NN21)<br />
were also added to the PNSN network. The seismic<br />
coverage on <strong>Newberry</strong> <strong>Volcano</strong> is now very good,<br />
Figure 3: Borehole geophone with hole-lock adapter.<br />
At each <strong>of</strong> the borehole stations an orientable holelock<br />
was installed near TD. Knowledge <strong>of</strong> the<br />
orientation <strong>of</strong> the horizontal components was<br />
required in order to maximize location accuracies and<br />
determine source mechanisms for the earthquakes.<br />
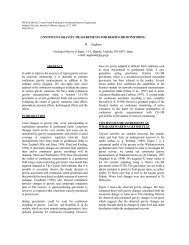
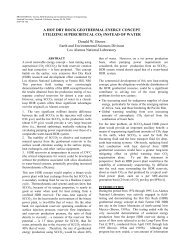
Figure 4: Five months <strong>of</strong> microseismicity on<br />
<strong>Newberry</strong> located by the regional network<br />
(PNSNb, 2013).
Figure 5: Magnitudes (top) and depths (bottom) <strong>of</strong> microseismic events with time compared to WHP (dashed red<br />
line). Prior to 11/25 WHP changes were due to stimulation pump issues. After 11/25, WHP changes were<br />
intentional. The vertical bars delineate the begin (green) and end (dark red) times for the two TZIM<br />
batches.<br />
with events smaller than M l 0.0 being locatable. In<br />
September and October, prior to stimulation, three<br />
natural microearthquakes were located using the<br />
improved network, compared to four in the prior 25<br />
years. During and after the stimulation, in addition to<br />
locating 86 events in the <strong>EGS</strong> swarm (within 1 km <strong>of</strong><br />
the well), 22 events were detected outside the swarm<br />
(Figure 4).<br />
STIMULATION AND PRELIMINARY<br />
SEISMIC RESULTS<br />
Injection into NWG 55-29 began October 17 and the<br />
first microearthquake located in the <strong>EGS</strong> stimulation<br />
zone occurred October 29. <strong>Microseismic</strong>ity in the<br />
<strong>EGS</strong> zone continued for 2 months, with the last<br />
confirmed event January 2, 2013. Preliminary<br />
locations were determined for 174 microseismic<br />
events, usually within 8 hours <strong>of</strong> the event‘s<br />
occurrence. The results discussed below and shown<br />
in Figure 5 are preliminary; quality control and<br />
advanced analysis <strong>of</strong> the data is currently ongoing.<br />
WHP and Hydroshearing<br />
During step-rate testing October 18-20, the well head<br />
pressure (WHP) exceeded 12 MPa for just 3 hours.<br />
This was insufficient time or pressure to initiate<br />
hydroshearing. Due to stimulation pump problems,<br />
the WHP did not exceed 9 MPa again until October<br />
28. After 12 hours at 9.3 MPa, the first definite<br />
microearthquake in the <strong>EGS</strong> stimulation zone<br />
occurred near the injection well bore at a depth <strong>of</strong><br />
~2.4 km bgs, consistent with a temperature deflection<br />
on the DTS (Petty et al., 2013). Forty-two hours<br />
passed until the next event occurred, by which time<br />
the WHP had been increased to 12.5 MPa. Six events<br />
followed, indicating that sustained pressure over 12<br />
MPa is required to cause sustained hydroshearing at<br />
depth in this well. There was no evidence from the<br />
pressure and flow-rate logs or the continuously<br />
recorded temperature pr<strong>of</strong>ile (Petty et al., 2013), that<br />
the minimum principle stress (S hmin ) had been<br />
exceeded, i.e., no hydr<strong>of</strong>racking occurred.<br />
After November 1, problems with one <strong>of</strong> the<br />
stimulation pumps necessitated lower pressures, ~ 5<br />
MPa for two weeks and ~0.5 MPa for 10 days<br />
(Figure 5). During the lower WHP period,<br />
microseismicity continued for 19 days after WHP<br />
dropped below 12 MPa. When the stimulation pumps<br />
were fully repaired, November 25, seismicity reinitiated<br />
at the lower pressure <strong>of</strong> 7 MPa.<br />
A maximum WHP <strong>of</strong> 16.7 MPa was reached<br />
December 7, and the well was shut in that same day.<br />
The seismicity rate dropped over the following week.
After the well was pressured up to 3.9 MPa with an<br />
air compressor on December 16, in an attempt to<br />
flow the well, seismicity increased, similar to the reinitation<br />
<strong>of</strong> seismicity on November 25.<br />
Size Distribution and Cumulative Moment<br />
The size distribution <strong>of</strong> 114 events located during the<br />
stimulation period (10/29-12/7) is shown in Figure 6.<br />
The curvature away from a linear fit at small<br />
magnitudes indicates that most events down to M w<br />
0.5 were located. The rest <strong>of</strong> the curve is remarkably<br />
linear (especially given that the data set is small) with<br />
a negative slope, or b-value, <strong>of</strong> ~1.1. It remains to be<br />
seen whether this same fit will remain when poststimulation<br />
events are included.<br />
The cumulative injected volume and cumulative<br />
logarithmic seismic moment are correlated (Figure<br />
7). The M w 2.39 event at the end <strong>of</strong> the Stage 3<br />
stimulation accounted for 29% <strong>of</strong> the total seismic<br />
moment. The total cumulative moment <strong>of</strong> 14.6x10 12<br />
N m (Table 1) would correspond to a single M w 2.75<br />
event. Compared to predictions (AltaRock, 2011) and<br />
<strong>EGS</strong> projects in Basel, Switzerland (Haring et al.,<br />
2008), and Soultz, France (Dorbath et al., 2009), the<br />
cumulative moment is at least an order <strong>of</strong> magnitude<br />
lower for similar injected volumes. The <strong>Newberry</strong><br />
site appears to have a much lower seismogenic index<br />
(Shapiro et al., 2010) than other sites.<br />
Table 1: Injected volume and seismic moment, by<br />
Stage<br />
Phase Injected<br />
volume<br />
(m 3 )<br />
Cum.<br />
Moment<br />
(10 12 N m)<br />
Max.<br />
mag.<br />
(M W )<br />
Stage 1 26,225 1.5 1.51<br />
Stage 2 9,795 4.7 2.04<br />
Stage 3 5,305 10.4 2.39<br />
Shut-in 0 14.6 2.23<br />
Figure 7: Cumulative injected volume and<br />
cumulative seismic moment.<br />
Locations<br />
The maps in Figure 8 show locations <strong>of</strong> seismic<br />
events by Stages defined by TZIM use and the<br />
postulated stimulation <strong>of</strong> a new set <strong>of</strong> fractures. The<br />
locations were calculated using the program hypocc<br />
(Julian, unpublished), a program that improves upon<br />
the relative relocation approach <strong>of</strong> Waldhauser and<br />
Ellsworth (2000).<br />
During stimulation <strong>of</strong> Stage 1 (10/17-11/25), the<br />
microseismicity initiated near the well bore at a depth<br />
about 2.4 km bgs (Figure 8a). With time the events<br />
became shallower (Figure 5), and occurred mostly in<br />
the northeast quadrant (relative to the well head).<br />
Stage 2: The first batch <strong>of</strong> TZIM was injected<br />
between November 25 & 28. The seismic response<br />
was a shift from the northeast quadrant to the<br />
southwest quadrant (Figure 8b). Additional events in<br />
northeast quadrant would be expected, as TZIM<br />
diversion was gradual, occurring over a four-day<br />
period (Petty et al., 2013).<br />
Stage 3: The second batch <strong>of</strong> TZIM was injected<br />
December 3 & 4. After this treatment the majority <strong>of</strong><br />
microearthquakes occurred in the southwest<br />
quadrant, indicating new connections to the<br />
southwest were enhanced. There is a ~300 m gap in<br />
seismicity between the southwest cluster <strong>of</strong><br />
seismicity and the well bore.<br />
Figure 6. Size distribution <strong>of</strong> events during<br />
stimulation showing a b-value <strong>of</strong> ~1.1.<br />
In map view, the overall cloud <strong>of</strong> seismicity (Figure<br />
7d) is 1.5 x 0.7 km with a NE-SW long axis and an<br />
area about 1 km 2 . The depth range (Figure 5) is<br />
currently uncertain, but appears to be at least 1 km<br />
and could easily be 1.5 km. Thus the total volume<br />
over which the seismicity occurred is between 1 and<br />
1.5 km 3 .
.<br />
a) Stage 1: 10/17-11/25/2012 b) Stage 2: 11/25-12/02/2012<br />
c) Stage 3: 12/03-07/2012 d) All Stages: 10/17-12/07/2012<br />
Figure 8: Maps <strong>of</strong> microseismicity during <strong>EGS</strong> stimulation. Location shown are preliminary relative relocations.<br />
Lineaments within the cloud form a conjugate set<br />
with the same trends as the boundaries <strong>of</strong> the overall<br />
cloud, NE-SW and NW-SE. These lineaments appear<br />
to be sub-vertical and would be strike-slip faults in<br />
the stress regime, E-W S hmin, , determined from<br />
regional studies and borehole breakouts in 55-29<br />
(Davatzes and Hickman, 2011).<br />
We anticipate that ongoing work will provide less<br />
diffuse event locations, which will provide the basis
for a conceptual model for the stimulation away from<br />
the well bore.<br />
Performance <strong>of</strong> MSA<br />
The hardware and s<strong>of</strong>tware <strong>of</strong> the microseismic array<br />
performed very well, apart from some limited<br />
downtime on non-critical stations during cloudy<br />
periods in December. Most importantly, the borehole<br />
seismometers were far more effective than the<br />
surface seismometers. Below Mw ~0.8 there were<br />
very few usable arrivals on the surface stations, while<br />
most borehole stations did have usable arrivals. If the<br />
network had consisted <strong>of</strong> surface sensors only, the<br />
number <strong>of</strong> event located would have dropped by at<br />
least 2/3<br />
indicates a wide variety <strong>of</strong> source mechanisms<br />
ranging from double couple to opening cracks<br />
(+Crack) to closing cracks (-Crack). This variety may<br />
be due to a relatively low differential stress and wide<br />
variety <strong>of</strong> volcanic features (dikes, flow boundaries,<br />
ring fractures) that were stimulated. Interestingly, a<br />
source-type plot <strong>of</strong> the Geysers shows a similar<br />
range <strong>of</strong> mechanisms (Julian and Foulger, 2004).<br />
Moment Tensors<br />
<strong>Microseismic</strong>ity in geothermal reservoirs can involve<br />
several different physical processes (Julian et al.,<br />
1998; Miller et al., 1998a). These include:<br />
1. simple shear slip on planar faults<br />
2. tensile cracking<br />
3. rapid fluid motion<br />
Understanding these processes is critical to<br />
understanding hydroshearing in <strong>EGS</strong> demonstrations.<br />
Traditional ‗fault-plane solutions' assume that only<br />
Process 1 occurs, thus ignoring processes associated<br />
with opening and closing cracks, and fluid flow. For<br />
this reason, such an approach is inadequate for <strong>EGS</strong><br />
work. Instead, a moment-tensor approach must be<br />
used. In order to determine moment tensors, more<br />
information than simply P-wave polarities is needed.<br />
The most effective and readily obtained information<br />
is the amplitudes <strong>of</strong> P- and S-phases (Julian and<br />
Foulger, 1996).<br />
The preferred way <strong>of</strong> displaying moment tensors<br />
graphically is to use source-type diagrams (Hudson et<br />
al., 1989). This has been applied to many natural and<br />
industrially induced microearthquake sequences,<br />
including geothermal and hydrocarbon reservoirs and<br />
<strong>EGS</strong> stimulations (Julian and Foulger, 1996; Julian et<br />
al., 1997; Julian et al., 2010a; Miller et al., 1998). A<br />
source-type diagram (Figure 9) illustrates the<br />
deviation from a pure earthquake double-couple (DC)<br />
source at the center in terms <strong>of</strong> a volumetric<br />
component; explosion on top and left or implosion on<br />
bottom and right. Tectonic earthquakes typically fall<br />
near the center point <strong>of</strong> the plot (labeled DC).<br />
Injection-induced seismicity, which involves an<br />
underground change in volume, may require non DC<br />
source-types.<br />
Moment tensor solutions have been calculated for 23<br />
<strong>Newberry</strong> events. The source-type plot (Figure 9)<br />
Figure 9: Source-type plot <strong>of</strong> 23 <strong>Newberry</strong> <strong>EGS</strong><br />
events.<br />
ISMP<br />
AltaRock developed a project-specific Induced<br />
Seismicity Mitigation Plan (AltaRock, 2011; BLM,<br />
2011) for the <strong>EGS</strong> demonstration that satisfied the<br />
requirements <strong>of</strong> the Induced Seismicity Mitigation<br />
Protocol adopted by the DOE (Majer et al, 2008,<br />
2011). This included predicting the largest possible<br />
induced microearthquake and developing predefined<br />
thresholds <strong>of</strong> event magnitudes and ground motion<br />
accompanied by appropriate mitigation actions.<br />
The biggest event (M w 2.39) which occurred on the<br />
last day <strong>of</strong> stimulation (12/7/2012) exceeded the<br />
initial limit, M w 2.0, on magnitude. The mitigation<br />
action for this limit was to wait 24 hours before<br />
increasing well head pressure or flow rate. Since the<br />
event occurred on the last day <strong>of</strong> planned stimulation,<br />
no modification to operational plans was necessary,<br />
and the well was shut-in later that day.<br />
Ground motion at the NNVM SMS due to the M w<br />
2.39 event was estimated PGA <strong>of</strong> 0.1% g, far below<br />
the action threshold set in the ISMP (AltaRock, 2011)<br />
<strong>of</strong> 1.4% g. From the seismometer closest to the event,<br />
a borehole seismometer at NN17, a PGA <strong>of</strong> 0.3% g<br />
was estimated. That level <strong>of</strong> ground motion would<br />
not necessarily have occurred at the surface, due to<br />
the highly attenuating cinders blanketing the volcano<br />
flanks. In any case, there were no reports <strong>of</strong> any felt<br />
seismicity from the field crews on-site for this or any
other microearthquake. Due to winter conditions, no<br />
visitors were near the site.<br />
CONCLUSIONS AND FUTURE WORK<br />
The installed MSA network met performance<br />
expectations throughout the <strong>Newberry</strong> stimulation.<br />
Results showed borehole stations were crucial for<br />
locating smaller events (M w
Julian, B.R., A.D. Miller, and G.R. Foulger (1997).<br />
―Non-double-couple earthquake mechanisms at<br />
the Hengill-Grensdalur volcanic complex,<br />
southwest Iceland‖ Geophys. Res. Lett., v. 24(7),<br />
743-746.<br />
Julian, B.R., G.R. Foulger, F.C. Monastero, and S.<br />
Bjornstad (2010). ―Imaging hydraulic fractures<br />
in a geothermal reservoir‖ Geophys. Res. Lett.,<br />
v. 37(L07305), doi:10.1029/2009GL040933.<br />
LBNL, 2013,<br />
http://esd.lbl.gov/research/projects/induced_seis<br />
micity/egs/newberry.html.<br />
Majer, E., Nelson, J. Robertson-Tait, A. Savy, J. and<br />
Wong I. (2011). ―(Final Draft) Protocol for<br />
Addressing Induced Seismicity Associated with<br />
Enhanced Geothermal Systems (<strong>EGS</strong>).‖<br />
Available at: http://esd.lbl.gov/files/research/<br />
projects/induced_seismicity/egs/<strong>EGS</strong>-IS-<br />
Protocol-Final-Draft-20110531.pdf.<br />
Majer, E., Baria, R., and Stark, M. (2008). ―Protocol<br />
for induced seismicity associated with enhanced<br />
geothermal systems.‖ Report produced in Task D<br />
Annex I (9 April 2008), International Energy<br />
Agency-Geothermal Implementing Agreement<br />
(incorporating comments by: C. Bromley, W.<br />
Cumming, A. Jelacic and L. Rybach). Available<br />
at: http://www.iea-gia.org/publications.asp.<br />
Miller, A.D., G.R. Foulger, and B.R. Julian (1998).<br />
―Non-double-couple earthquakes 2.<br />
Observations‖ Rev. Geophys., v. 36, 551-568.<br />
Osborn, W.L., Petty, S., Cladouhos, T.T., Iovenitti,<br />
J., N<strong>of</strong>ziger, L., Callahan, O., Perry, D.S. and<br />
Stern P.L. (2011), ―<strong>Newberry</strong> <strong>Volcano</strong> <strong>EGS</strong><br />
<strong>Demonstration</strong> – Phase I Results,‖ GRC<br />
Transactions, 35, 499-505.<br />
Petty, S. Nordin, Y., Glassely, W. and Cladouhos, T.<br />
(2013), ―Improving Geothermal Project<br />
Economics with Multi-zone Stimulation: Results<br />
from the <strong>Newberry</strong> <strong>Volcano</strong> <strong>EGS</strong><br />
<strong>Demonstration</strong>,‖ PROCEEDINGS, Thirty-Eighth<br />
Workshop on Geothermal Reservoir Engineering<br />
Stanford University, Stanford, California,<br />
February 11-13, 2013 SGP-TR-198<br />
PNSNa, 2013.<br />
http://www.pnsn.org/seismograms/map.<br />
PNSNb, 2013.<br />
http://www.pnsn.org/volcanoes/newberry.<br />
Shapiro, S. A., C. Dinske, C. Lagenbruch, and F.<br />
Wenzel (2010). ―Seismogenic index and<br />
magnitude probability <strong>of</strong> earthquakes induced<br />
during reservoir fluid stimulations‖ The Leading<br />
Edge, March 2010,. 304‐309.<br />
Waldhauser, F. and W. L. Ellsworth (2000). ―A<br />
double-difference earthquake location algorithm:<br />
Method and application to the northern Hayward<br />
Fault, California‖ Bull. Seismol. Soc. Am., v. 90,<br />
1353-1368.