May 2010 Sales Taxes in Illinois - Illinois General Assembly
May 2010 Sales Taxes in Illinois - Illinois General Assembly
May 2010 Sales Taxes in Illinois - Illinois General Assembly

You also want an ePaper? Increase the reach of your titles
YUMPU automatically turns print PDFs into web optimized ePapers that Google loves.
Commission on Government<br />
Forecast<strong>in</strong>g and Accountability<br />
COMMISSION CO-CHAIRMEN<br />
Senator Jeffrey M. Schoenberg<br />
Representative Richard P. Myers<br />
SENATE<br />
Senator Bill Brady<br />
Senator Michael Frerichs<br />
Senator Matt Murphy<br />
Senator Dave Syverson<br />
Senator Donne Trotter<br />
HOUSE<br />
Representative Patricia Bellock<br />
Representative Kev<strong>in</strong> McCarthy<br />
Representative Ela<strong>in</strong>e Nekritz<br />
Representative Raymond Poe<br />
Representative Al Riley<br />
EXECUTIVE DIRECTOR<br />
Dan R. Long<br />
DEPUTY DIRECTOR<br />
Trevor J. Clatfelter<br />
REVENUE MANAGER<br />
Jim Musch<strong>in</strong>ske<br />
AUTHOR OF REPORT<br />
Benjam<strong>in</strong> L. Varner<br />
EXECUTIVE SECRETARY<br />
Donna K. Belknap
TABLE OF CONTENTS<br />
<strong>Sales</strong> <strong>Taxes</strong> <strong>in</strong> Ill<strong>in</strong>ois – <strong>May</strong> <strong>2010</strong><br />
PAGE<br />
Executive Summary<br />
i<br />
I. Ill<strong>in</strong>ois <strong>Sales</strong> <strong>Taxes</strong> 1<br />
II. History of <strong>Sales</strong> <strong>Taxes</strong> 2<br />
III. Distribution of Funds 3<br />
IV. Revenues and Projections 5<br />
V. History of Exemptions 7<br />
VI. Comparison of States 9<br />
VII. Other <strong>Sales</strong> <strong>Taxes</strong> 11<br />
VIII. <strong>Sales</strong> Tax Base 15<br />
IX. Internet Taxation 19<br />
X. Flow Chart for <strong>Sales</strong> <strong>Taxes</strong> 23<br />
TABLES:<br />
1 Historical Ill<strong>in</strong>ois <strong>Sales</strong> Tax Rates 2<br />
2 <strong>General</strong> Revenue <strong>Sales</strong> Tax Receipts 5<br />
3 All Appropriated <strong>Sales</strong> Tax Receipts 6<br />
4 Surround<strong>in</strong>g States <strong>Sales</strong> Tax Rates 9<br />
5 2007 State <strong>General</strong> <strong>Sales</strong> Tax Revenue for Surround<strong>in</strong>g States 10<br />
6 County Public Safety <strong>Sales</strong> Tax Rates 14<br />
7 Top Ten Industries by SIC Code 16<br />
8 <strong>Sales</strong> Tax Receipts by Sector 17<br />
9 2009 State <strong>Sales</strong> Tax Receipts by County 18<br />
10 2009 State <strong>Sales</strong> Tax Revenue by Municipality 18<br />
11 Streaml<strong>in</strong>ed <strong>Sales</strong> Tax Project States 22<br />
CHARTS:<br />
1 <strong>Sales</strong> and Use Tax Exemptions 8<br />
2 Ill<strong>in</strong>ois <strong>Sales</strong> Tax Flowchart 24-25<br />
APPENDIX:<br />
1 Ill<strong>in</strong>ois <strong>Sales</strong> Tax Exemptions 26<br />
2 Ill<strong>in</strong>ois <strong>Sales</strong> Tax Exemption Statistics 27<br />
3 <strong>Sales</strong> Tax Rate by State 28<br />
4 State <strong>Sales</strong> Tax Revenue 29<br />
5 Ill<strong>in</strong>ois Home Rule Units 30-33<br />
6 2009 State <strong>Sales</strong> Tax Receipts by County 34-35
EXECUTIVE SUMMARY<br />
<strong>Sales</strong> taxes are a prom<strong>in</strong>ent factor <strong>in</strong> Ill<strong>in</strong>ois’ tax<strong>in</strong>g structure. They are the general<br />
revenue fund’s second largest revenue-generat<strong>in</strong>g source and make up approximately<br />
one quarter of total revenues. <strong>Sales</strong> tax laws with<strong>in</strong> Ill<strong>in</strong>ois as well as throughout the<br />
nation are diverse, and sometimes confus<strong>in</strong>g. The follow<strong>in</strong>g report attempts to provide<br />
basic facts and <strong>in</strong>formation that surround sales tax issues <strong>in</strong> Ill<strong>in</strong>ois. This report builds<br />
on the Commission’s 2001 report, “<strong>Sales</strong> Tax Issues <strong>in</strong> Ill<strong>in</strong>ois” by updat<strong>in</strong>g the<br />
statistics there<strong>in</strong> and expands the analysis to <strong>in</strong>clude an exam<strong>in</strong>ation of the sales tax<br />
base.<br />
• To beg<strong>in</strong>, the report gives def<strong>in</strong>itions for both the sales Use Tax and Occupation<br />
Tax. Also, a sales tax rate, revenue, and exemption history is provided. Ill<strong>in</strong>ois’<br />
sales tax rate has grown from 2% <strong>in</strong> 1933 to the current rate of 6.25% which was<br />
<strong>in</strong>stituted <strong>in</strong> 1990. <strong>Sales</strong> tax revenues are divided between State and local<br />
governments: 80% of the tax goes <strong>in</strong>to the State’s treasury and 20% is directed back<br />
to local municipalities <strong>in</strong> which the sale was made. Local governments also have<br />
the option of <strong>in</strong>stitut<strong>in</strong>g home-rule taxes, which br<strong>in</strong>g additional revenue to their<br />
cities.<br />
• Although general revenue sales taxes have historically grown, fiscal year 2009<br />
yielded a disappo<strong>in</strong>t<strong>in</strong>g figure of $6.77 billion, which was a 6.1% decrease from the<br />
previous year. This was the largest decl<strong>in</strong>e <strong>in</strong> sales tax revenue <strong>in</strong> over 60 years,<br />
though FY <strong>2010</strong> revenues are estimated to decl<strong>in</strong>e even more. These decl<strong>in</strong>es are<br />
associated with the extended recession that began <strong>in</strong> approximately December of<br />
2007. The Commission estimates that the State will see some small growth <strong>in</strong><br />
FY 2011 as the economy beg<strong>in</strong>s to climb out of the recession.<br />
• Total sales tax exemptions were approximately $3.4 billion <strong>in</strong> fiscal year 2008. The<br />
largest exemption be<strong>in</strong>g the Food, Drugs, and Medical Appliance rate reduction<br />
which accounted for $1.4 billion or just over 40% of total exemptions.<br />
• Ill<strong>in</strong>ois has one of the highest sales tax rates <strong>in</strong> the nation. Ill<strong>in</strong>ois was tied for 10 th<br />
highest as of April <strong>2010</strong>. Ill<strong>in</strong>ois also had the 2 nd highest rate when compared to<br />
surround<strong>in</strong>g states. Only Indiana at 7.00% had a higher rate.<br />
• There are numerous other local sales taxes <strong>in</strong> Ill<strong>in</strong>ois <strong>in</strong>clud<strong>in</strong>g Bus<strong>in</strong>ess District<br />
taxes, County Motor Fuel taxes, Home Rule and Non-home rule taxes, Mass<br />
Transit District taxes, County Public Safety taxes, among others.<br />
• The Ill<strong>in</strong>ois sales tax was designed to primarily tax real property. The largest<br />
amount of sales tax revenue comes from the Automotive and Fill<strong>in</strong>g Station sector<br />
of the economy which provides just below 21% of total sales tax revenue. This<br />
-i-
• The majority of the sales tax base is located with<strong>in</strong> Cook and the Collar Counties<br />
with pockets of sales tax revenue com<strong>in</strong>g from the larger downstate cities.<br />
• The Internet has greatly affected virtually all facets of economic activity, <strong>in</strong>clud<strong>in</strong>g<br />
states’ sales tax revenues. Currently, onl<strong>in</strong>e retailers are subject to Ill<strong>in</strong>ois sales<br />
taxes if they have a nexus with<strong>in</strong> the State. The Department of Revenue estimated<br />
that over $143 million of sales taxes related to onl<strong>in</strong>e commerce went unpaid <strong>in</strong><br />
FY 2008. The department estimated that this number would grow to $153 million<br />
and $163 million <strong>in</strong> fiscal years 2009 and <strong>2010</strong><br />
• Another important issue that will have an impact on sales taxation is the Streaml<strong>in</strong>ed<br />
<strong>Sales</strong> Tax Project (SSTP). The SSTP is an effort by states to simplify and<br />
modernize sales and use tax collection and adm<strong>in</strong>istration. The goal of the Project<br />
is to substantially reduce or elim<strong>in</strong>ate the costs and burdens of sales tax compliance<br />
for bus<strong>in</strong>esses via a comb<strong>in</strong>ation of simplified laws and adm<strong>in</strong>istrative policies.<br />
• F<strong>in</strong>ally, a sales tax flowchart has been developed <strong>in</strong> order to depict the <strong>in</strong>tricacies of<br />
Ill<strong>in</strong>ois sales taxation. Several decisions and many steps are <strong>in</strong>volved <strong>in</strong> order to<br />
determ<strong>in</strong>e what the end sales tax will be for a consumer.<br />
-ii-
Ill<strong>in</strong>ois <strong>Sales</strong> <strong>Taxes</strong><br />
A sales tax is a levy placed on a good or service when it is purchased from a company<br />
that has a physical presence (or “nexus”) <strong>in</strong> the same state as the consumer. When a<br />
consumer buys a good or service from a retailer that is outside of his or her state, they<br />
pay a use tax. Ill<strong>in</strong>ois is one of 45 states (plus the District of Columbia) <strong>in</strong> the nation<br />
that requires its residents to pay sales taxes when purchas<strong>in</strong>g retail merchandise. If the<br />
seller does not charge Ill<strong>in</strong>ois <strong>Sales</strong> Tax, the purchaser owes the tax directly to the<br />
Department.<br />
Ill<strong>in</strong>ois sales taxes are actually derived from four different tax acts; the Retailers’<br />
Occupation Tax (ROT) and its complement the Use Tax (UT), the Service Occupation<br />
Tax (SOT) and its complement the Service Use Tax (SUT).<br />
The Retailers’ Occupation Tax is generally referred to as the sales tax. The tax is<br />
imposed on Ill<strong>in</strong>ois retailers on the gross receipts from sales of tangible personal<br />
property. Ill<strong>in</strong>ois retailers forward the collected Retailers’ Occupation Tax to the<br />
Department of Revenue for deposit <strong>in</strong>to the State’s Treasury. The ROT’s partner, the<br />
Use Tax, applies to Ill<strong>in</strong>ois purchasers who buy property out of state at a lower tax rate<br />
or from a vendor who does not have a physical nexus with<strong>in</strong> the State. The difference<br />
between the lower tax rate and Ill<strong>in</strong>ois’ sales tax rate must be forwarded to the<br />
Department of Revenue as a Use Tax. The purpose of the Use Tax is to protect <strong>in</strong>-state<br />
retailers from competition from out-of-state retailers who may not be subject to the<br />
Retailers’ Occupation Tax.<br />
The Service Occupation Tax is imposed on service providers when tangible personal<br />
property is transferred with<strong>in</strong> the course of perform<strong>in</strong>g a service. The tax is measured<br />
by the sell<strong>in</strong>g price of the tangible personal property transferred as an <strong>in</strong>cident to the<br />
sale of the service. Likewise, the Service Use Tax is also imposed upon the purchaser<br />
for the privilege of us<strong>in</strong>g property that was acquired <strong>in</strong>cident to the purchase of a<br />
service. However, this tax would apply when a purchaser obta<strong>in</strong>s property from an<br />
out-of-state service provider who does not have a “nexus” with<strong>in</strong> the State and is not<br />
obligated to collect Ill<strong>in</strong>ois sales taxes.<br />
-1-
History of <strong>Sales</strong> <strong>Taxes</strong><br />
State sales taxes orig<strong>in</strong>ated dur<strong>in</strong>g the Great Depression, when the ma<strong>in</strong> source of<br />
revenue for state and local governments, property taxes, collapsed with property<br />
values. In 1930, twenty-three states began us<strong>in</strong>g the sales tax as an additional revenue<br />
source. Due to problems with our own State budget, Ill<strong>in</strong>ois adopted a “temporary” 2<br />
percent sales tax <strong>in</strong> 1933. In 1935, the tax was made permanent, and the rate was<br />
raised to 3 percent.<br />
While the State rate ranged between 2 and 3 percent, municipalities and counties were<br />
allowed to impose a local sales tax beg<strong>in</strong>n<strong>in</strong>g <strong>in</strong> 1955 and 1959, respectively. Also, <strong>in</strong><br />
1955 the Use Tax was added at the same rate as the Retailers’ Occupation Tax. Six<br />
years later, the Service Use Tax and Service Occupation <strong>Taxes</strong> were added to the<br />
Ill<strong>in</strong>ois sales tax structure. By 1984, the State rate <strong>in</strong>creased to 5 percent and the<br />
County Supplementary Tax Act authorized all counties except Cook County to impose a<br />
0.25 percent sales tax. In addition, the State tax on certa<strong>in</strong> food and medical supplies<br />
and mach<strong>in</strong>ery and parts used <strong>in</strong> manufactur<strong>in</strong>g was elim<strong>in</strong>ated (local taxes rema<strong>in</strong>ed on<br />
the exempt items).<br />
Effective January 1, 1990, as part of <strong>Sales</strong> Tax Reform, a uniform State sales and use<br />
tax rate on general merchandise of 6.25 percent was established. The local sales tax<br />
acts and the County Supplementary Tax Act were repealed and the Department of<br />
Revenue began adm<strong>in</strong>ister<strong>in</strong>g Non-Home rule sales taxes <strong>in</strong> September 1990. Many of<br />
these taxes were already <strong>in</strong> effect but were adm<strong>in</strong>istered by the locals themselves.<br />
While the number of local municipalities and counties <strong>in</strong>stitut<strong>in</strong>g home rule sales tax<br />
rates has grown, the State sales tax rate has rema<strong>in</strong>ed constant at 6.25% for the past<br />
twenty years. Table 1 outl<strong>in</strong>es the history of Ill<strong>in</strong>ois sales tax rates.<br />
Table 1. HISTORICAL ILLINOIS SALES TAX RATES<br />
Effective Date<br />
Rate<br />
July 1, 1933 2.00%<br />
July 1, 1935 3.00%<br />
July 1, 1941 2.00%<br />
July 1, 1955 2.50%<br />
July 1, 1959 3.00%<br />
July 1, 1961 3.50%<br />
July 1, 1967 4.25%<br />
October 1, 1969 4.00%<br />
January 1, 1984 5.00%<br />
January 1, 1990 - Current 6.25%<br />
Source: Ill<strong>in</strong>ois Department of Revenue<br />
-2-
Distribution of Funds<br />
The current State sales tax rate is 6.25%, of which the State reta<strong>in</strong>s 80% of the tax and<br />
local governments receive the rema<strong>in</strong><strong>in</strong>g 20%. Therefore, a 5% sales tax is given to<br />
the State, and 1.25% is provided to local governments. Below is the distribution<br />
pattern of the Ill<strong>in</strong>ois sales and use taxes as described by the Ill<strong>in</strong>ois Legislative<br />
Research Unit <strong>in</strong> their March <strong>2010</strong> report, “Ill<strong>in</strong>ois Tax Handbook for Legislators” and<br />
the Ill<strong>in</strong>ois Department of Revenue website.<br />
Proceeds from the 5% portion of the State sales and use taxes (or 80% of total State<br />
sales taxes) contribute to the follow<strong>in</strong>g:<br />
• 1.75% to Build Ill<strong>in</strong>ois Fund;<br />
• 3.8% to Build Ill<strong>in</strong>ois Fund to retire bonds;<br />
• 0.27% to Ill<strong>in</strong>ois Tax Increment Fund;<br />
• 80% of net tax revenue on Ill<strong>in</strong>ois coal bought by a new electric generat<strong>in</strong>g<br />
facility that received state f<strong>in</strong>ancial aid, to the Energy Infrastructure Fund (for<br />
the first 25 years that the facility buys Ill<strong>in</strong>ois coal).<br />
• 25% reserved for transfer to Common Schools Special Account Fund;<br />
• Rema<strong>in</strong>der to the <strong>General</strong> Revenue Fund, with two transfers out:<br />
1) 3/32 of net revenue from counties and municipalities that have Downstate<br />
mass transit districts, to the Downstate Public Transportation Fund<br />
2) 3/32 of net revenue from Madison, Monroe, and St. Clair Counties to the<br />
Downstate Public Transportation Fund.<br />
Proceeds from the 1.25% portion of the State sales tax (or 20% of the total State sales<br />
tax) is returned to local governments <strong>in</strong> the follow<strong>in</strong>g manner:<br />
• 80% of net proceeds to the Local Government Tax Fund<br />
• 20% of net revenue to the County and Mass Transit Fund<br />
Proceeds from the 1.25% portion of the State use taxes (or 20% of the total State use<br />
tax) are put <strong>in</strong>to the State and Local <strong>Sales</strong> Tax Reform Fund and distributed <strong>in</strong> the<br />
follow<strong>in</strong>g manner:<br />
• 20% is distributed to Chicago<br />
• 10% is distributed to the Regional Transportation Authority (RTA)<br />
• 0.6% is distributed to the Metro-East Mass Transit District (MED)<br />
• $3.15 million is distributed to the Build Ill<strong>in</strong>ois Fund<br />
• The rema<strong>in</strong><strong>in</strong>g balance of the State and Local <strong>Sales</strong> Tax Reform Fund is<br />
distributed to municipal and county governments (except Chicago) based on<br />
each one’s population <strong>in</strong> proportion to the total state population.<br />
-3-
Recently, new legislation, related to the Ill<strong>in</strong>ois Jobs Now! construction program,<br />
<strong>in</strong>creased the rate of sales tax on certa<strong>in</strong> types of products. These items were primarily<br />
items that previously were taxed at the 1% rate under the Food or Drug exemptions.<br />
State sales tax revenue on these products would be used to partially fund the program.<br />
As part of Public Act 096-0034, beg<strong>in</strong>n<strong>in</strong>g September 1, 2009, each month the<br />
Department of Revenue is to pay <strong>in</strong>to the Capital Projects Fund the estimated amount of<br />
sales tax that represented 80% of the net revenue realized for the preced<strong>in</strong>g month from<br />
the sale of candy, groom<strong>in</strong>g and hygiene products, and soft dr<strong>in</strong>ks that were taxed at<br />
1% prior to August 1, 2009 but that are now taxed at 6.25%.<br />
-4-
Revenues and Projections<br />
<strong>Sales</strong> tax revenues are one of Ill<strong>in</strong>ois largest revenue sources, second only to the<br />
personal <strong>in</strong>come tax. In FY 2009, general revenue fund (GRF) sales taxes were $6.77<br />
billion, which was down 6.1% from the all-time high of $7.21 billion <strong>in</strong> FY 2008.<br />
This was the worst decl<strong>in</strong>e s<strong>in</strong>ce 1950, which is as far back as the Commission has<br />
data. It is expected that this will be surpassed <strong>in</strong> FY <strong>2010</strong>, when sales taxes are<br />
expected to be down 8.5%. To illustrate to the reader how severe the current<br />
recession has affected sales tax revenue, between FY 1950 and FY 2008 GRF sales<br />
tax had only decl<strong>in</strong>ed 5 times previously and never two years <strong>in</strong> a row. Prior to<br />
FY 2009, the largest decl<strong>in</strong>es were -2.9% <strong>in</strong> FY 1950 and -1.9% <strong>in</strong> FY 1981.<br />
Between fiscal years 2000 and 2009, sales taxes were quite volatile when compared to<br />
the previous decade. GRF sales taxes <strong>in</strong>creased 4.2% per year dur<strong>in</strong>g the boom<strong>in</strong>g<br />
1990’s, while they grew at a slower average rate of 2.0% dur<strong>in</strong>g the turbulent 2000’s.<br />
Besides grow<strong>in</strong>g at a slower rate, GRF sales taxes were much less dependable. From<br />
FY 1990 thru FY 1999, sales taxes grew at least 2% every year except FY 1991 when<br />
growth was only 1%. In contrast, dur<strong>in</strong>g the 2000’s only four of the ten years had<br />
sales tax growth of over 2% and actually had two years of decl<strong>in</strong>es (FY 2001 and<br />
FY 2009).<br />
It also should be noted that sales tax revenues as a percentage of total general revenues<br />
has decl<strong>in</strong>ed from almost 30% <strong>in</strong> fiscal year 1990, to less than 23% <strong>in</strong> fiscal year <strong>2010</strong>.<br />
It is anticipated that fiscal year 2011 will be a transitional year with slow growth<br />
(1.6%) as the economy comes out of the recessionary low to the recovery phase of the<br />
bus<strong>in</strong>ess cycle. Table 2 provides historical details and projections of the general<br />
revenue sales tax beg<strong>in</strong>n<strong>in</strong>g <strong>in</strong> fiscal year 2000.<br />
Table 2. GENERAL REVENUE SALES TAX RECEIPTS<br />
($ billions)<br />
Fiscal Year<br />
<strong>Sales</strong> Tax<br />
Revenue % Growth<br />
Total <strong>General</strong><br />
Revenue* % Growth<br />
2000 $6.03 7.5% $23.25 7.3% 25.9%<br />
2001 $5.96 -1.1% $24.11 3.7% 24.7%<br />
2002 $6.05 1.6% $23.38 -3.0% 25.9%<br />
2003 $6.06 0.1% $22.79 -2.5% 26.6%<br />
2004 $6.24 2.9% $25.43 11.6% 24.5%<br />
2005 $6.59 5.8% $26.16 2.9% 25.2%<br />
2006 $7.09 7.5% $27.36 4.6% 25.9%<br />
2007 $7.14 0.6% $28.64 4.7% 24.9%<br />
2008 $7.21 1.1% $29.66 3.6% 24.3%<br />
2009 $6.77 -6.1% $29.14 -1.7% 23.2%<br />
<strong>2010</strong>** $6.20 -8.5% $27.90 -4.3% 22.2%<br />
2011** $6.30 1.6% $26.56 -4.8% 23.7%<br />
<strong>Sales</strong> as a % of<br />
Total<br />
*Total <strong>General</strong> Revenue excludes cash management transactions <strong>in</strong>clud<strong>in</strong>g short term borrow<strong>in</strong>g and certa<strong>in</strong> transfers<br />
** CGFA estimates<br />
Source: Ill<strong>in</strong>ois Department of Revenue<br />
-5-
All Appropriated (AAP) sales tax revenues encompass the entire amount of sales tax<br />
revenues that Ill<strong>in</strong>ois receives. GRF sales tax amounts were just those that went <strong>in</strong>to<br />
the <strong>General</strong> Revenue Funds which were the <strong>General</strong> Revenue Fund (0001) and the<br />
<strong>General</strong> Revenue - Common School Special Account Fund (0005). The AAP sales tax<br />
revenue amount <strong>in</strong>cludes those monies plus the amounts that went <strong>in</strong>to the Home Rule<br />
Municipal Retailers’ Occupation Tax Fund (0138), the State and Local <strong>Sales</strong> Tax<br />
Reform Fund (0186), the Ill<strong>in</strong>ois Tax Increment Fund (0281), the McCormick Place<br />
Expansion Project Fund (0377), the Tax Compliance and Adm<strong>in</strong>istration Fund (0384),<br />
the Capital Projects Fund (0694), and the Build Ill<strong>in</strong>ois Fund (0960)<br />
AAP sales tax revenues historical trends mirror the general revenue trends. All<br />
Appropriated revenues grew steadily between fiscal year 1990 and 2000 but grew<br />
slower <strong>in</strong> the 2000’s. Similar to GRF sales tax revenue, AAP revenue decl<strong>in</strong>ed <strong>in</strong><br />
FY 2009 and is expected to decl<strong>in</strong>e significantly aga<strong>in</strong> <strong>in</strong> FY <strong>2010</strong>. For FY 2009, AAP<br />
sales tax revenue was $8.22 billion. A decl<strong>in</strong>e to $7.58 billion is expected <strong>in</strong> FY <strong>2010</strong><br />
with small growth <strong>in</strong> FY 2011. Table 3 provides a historical review of AAP sales tax<br />
revenues<br />
Table 3. ALL APPROPRIATED SALES TAX RECEIPTS<br />
($ billions)<br />
Fiscal Year AAP <strong>Sales</strong> Tax Revenue % Growth<br />
2001 $6.96 -0.8%<br />
2002 $7.06 1.3%<br />
2003 $7.05 0.0%<br />
2004 $7.34 4.1%<br />
2005 $7.78 6.1%<br />
2006 $8.43 8.3%<br />
2007 $8.60 2.1%<br />
2008 $8.73 1.5%<br />
2009 $8.22 -5.9%<br />
<strong>2010</strong>* $7.58 -7.8%<br />
2011* $7.70 1.7%<br />
* CGFA estimates<br />
Source: Ill<strong>in</strong>ois Department of Revenue<br />
-6-
History of Exemptions<br />
Upon the <strong>in</strong>ception of the State sales tax, almost all general merchandise was subject to<br />
taxation. However, as the years progressed, the amount of allowed exemptions<br />
escalated along with the sales tax rate, yield<strong>in</strong>g a smaller tax base but cont<strong>in</strong>ued<br />
revenue growth.<br />
Beg<strong>in</strong>n<strong>in</strong>g <strong>in</strong> 1933 (when the State sales tax was implemented), allowed exemptions<br />
<strong>in</strong>cluded feed and seed for farmers and occasional sales exemptions. Between 1955 and<br />
1979, the number of exemptions cont<strong>in</strong>ued to grow to <strong>in</strong>clude among other th<strong>in</strong>gs, sales<br />
to exempt organizations, newspr<strong>in</strong>t and <strong>in</strong>k, roll<strong>in</strong>g stock, and farm chemicals. But it<br />
wasn’t until after 1979 that the amount of exemptions allowed by the State began to<br />
proliferate (Appendix 1 at the end of this report provides a list of exemptions and the<br />
year they were enacted).<br />
In 1979, sales taxes were elim<strong>in</strong>ated on sales of mach<strong>in</strong>ery and equipment to<br />
manufacturers. Exemptions for mach<strong>in</strong>ery and equipment to pr<strong>in</strong>ters, coal m<strong>in</strong>es, oil<br />
field drillers, distillers of ethanol, and farmers quickly followed <strong>in</strong> 1980. Also <strong>in</strong> 1980,<br />
the State began to reduce the tax rate on sales of food (grocery), drugs, and medical<br />
appliances to <strong>in</strong>dividuals. Between 1985 and 2000 sales tax exemptions were added for<br />
property used <strong>in</strong> pollution control facilities, property used with an enterprise zone, legal<br />
tender, medallions, and bullion, photo process<strong>in</strong>g mach<strong>in</strong>ery, coal and oil mach<strong>in</strong>ery,<br />
leased property to hospitals or governmental bodies, and many more. In January 1995,<br />
manufacturers began earn<strong>in</strong>g additional sales tax credit (Manufacturer’s Purchase<br />
Credit or MPC) that could be applied toward the tax due on purchases of non-exempt<br />
items. MPC earned is a percentage of the tax the manufacturer would have paid on the<br />
purchase of mach<strong>in</strong>ery and equipment if the mach<strong>in</strong>ery and equipment had not been<br />
exempt from tax.<br />
Many organizations that do not have to pay sales taxes on their purchases also <strong>in</strong>creased<br />
<strong>in</strong> number. Certa<strong>in</strong> senior citizen organizations, county fair associations, not-for-profit<br />
music or dramatic arts organizations, and certa<strong>in</strong> licensed day care centers are all<br />
exempt from sales taxation. In addition, sales by elementary or secondary teachersponsored<br />
student organizations and certa<strong>in</strong> sales by not-for-profit service organizations<br />
operat<strong>in</strong>g for the benefit of persons 65 or older are also exempt from sales taxes.<br />
In 2003, two exemptions related to motor fuels were enacted. The first exemption was<br />
related to majority blended ethanol fuel. The second was a discount and exemption<br />
associated with biodiesel. Legislation exempt<strong>in</strong>g sales of jet fuel and petroleum<br />
products used or consumed by any aircraft support center directly <strong>in</strong> the process of<br />
ma<strong>in</strong>ta<strong>in</strong><strong>in</strong>g, rebuild<strong>in</strong>g, or repair<strong>in</strong>g aircraft from the sales tax was passed <strong>in</strong> 2007.<br />
Chart 1 provides estimates for sales tax exemptions for Ill<strong>in</strong>ois as estimated by the<br />
Ill<strong>in</strong>ois State Comptroller <strong>in</strong> their “Tax Expenditure Report”. In FY 2008, exemptions<br />
to the <strong>Sales</strong> and Use taxes were estimated at $3.4 billion. As depicted <strong>in</strong> the chart, the<br />
-7-
food, drug, and medical appliance sales tax reduction ($1.4 billion) accounted for the<br />
greatest amount of sales tax exemptions, followed by sales to exempt organizations<br />
($515 million) and the traded-<strong>in</strong> property exemption ($357).<br />
Appendix 2 provides historical figures for sales tax exemptions from fiscal years 1996<br />
through 2008. As the appendix <strong>in</strong>dicates, the dollar amount of all exemptions has<br />
<strong>in</strong>creased steadily over the past 12 years. Total sales and use tax exemptions have<br />
grown by approximately 50% dur<strong>in</strong>g that time period. Tax exemptions of the sales and<br />
use taxes actually peaked <strong>in</strong> FY 2007 at $3.9 billion but fell approximately $570 million<br />
<strong>in</strong> FY 2008. The food, drugs, and medical rate reduction has grown an average of<br />
4.8% per year, while total sales and use tax exemptions have averaged growth of 3.8%<br />
between FY 1996 and FY 2008.<br />
Chart 1. <strong>Sales</strong> and Use Tax Exemptions<br />
(FY 2008)<br />
$1,600<br />
$1,400<br />
$1,200<br />
Dollars (<strong>in</strong> Millions)<br />
$1,000<br />
$800<br />
$600<br />
$400<br />
$200<br />
$-<br />
Food, Drugs, <strong>Sales</strong> to Exempt<br />
and Medical Organizations<br />
Appliances Rate<br />
Reduction<br />
Traded-In<br />
Property<br />
Exemption<br />
Farm Chemicals<br />
(Includes Feed<br />
and Seed)<br />
Exemption<br />
Manufactur<strong>in</strong>g<br />
and Assembl<strong>in</strong>g<br />
Mach<strong>in</strong>ery<br />
Exemption<br />
Gasahol<br />
Discount<br />
Retailer's<br />
Discount<br />
Biodiesel<br />
Discount and<br />
Exemption<br />
All Other<br />
Source: Ill<strong>in</strong>ois State Comptroller<br />
-8-
Comparison of States<br />
<strong>Sales</strong> taxes are not unique to Ill<strong>in</strong>ois. Virtually every state <strong>in</strong> the nation has some sort of<br />
sales taxation. Table 4 provides sales tax rates for Ill<strong>in</strong>ois and its neighbor<strong>in</strong>g states.<br />
As <strong>in</strong>dicated, Ill<strong>in</strong>ois’ state sales tax rate at 6.25% is the second highest among all of its<br />
neighbor<strong>in</strong>g states beh<strong>in</strong>d Indiana at 7.00%. In fact, Ill<strong>in</strong>ois 6.25% sales tax ranks<br />
among the nation’s highest tax rates. Currently, Ill<strong>in</strong>ois is tied with Texas and<br />
Massachusetts for the 10th highest state sales tax rate. Rates range between 0% (for<br />
Alaska, Delaware, Montana, New Hampshire, and Oregon) and 7.25% (California).<br />
Appendix 3 provides details of each of the states sales tax rates.<br />
Not only do sales tax rates vary widely across the nation, but so do the items taxed and<br />
the def<strong>in</strong>ition of these items. For example, some states tax necessity items (such as<br />
food, cloth<strong>in</strong>g, medical appliances, and drugs), while some do not. Others have a<br />
reduced tax rate. Even more, the def<strong>in</strong>ition of the non-taxable goods may differ among<br />
states. Non-taxable food <strong>in</strong> one state might be def<strong>in</strong>ed as only food that is consumable<br />
off the sales premises, while another state may exempt all food from sales taxation,<br />
regardless of where it will be consumed.<br />
Thus, the diversity of sales tax rates, applied products, and accompany<strong>in</strong>g def<strong>in</strong>itions<br />
make it difficult, at best, to form any k<strong>in</strong>d of analytical state comparison of the various<br />
states sales tax revenues. Table 5 provides a numerical summation of State sales tax<br />
revenues for Ill<strong>in</strong>ois and its boundary states and Appendix 4 provides details for every<br />
state. Total revenues generated from sales taxation may have a direct relationship with<br />
state population, the sales tax rate, as well as the comprehensiveness of the items taxed.<br />
Although Ill<strong>in</strong>ois ranks first among its neighbor<strong>in</strong>g states for total sales tax revenues at<br />
$7.8 billion, when consider<strong>in</strong>g these revenues on a per-capita basis, Ill<strong>in</strong>ois is <strong>in</strong> the<br />
lower half. Residents <strong>in</strong> Ill<strong>in</strong>ois paid approximately $608 <strong>in</strong> sales tax <strong>in</strong> 2007 on<br />
average which was well below what residents of Indiana paid ($855). On a per capita<br />
basis, the State of Missouri had the lowest amount at $557.<br />
Table 4. SURROUNDING STATES SALES TAX RATES<br />
State State Rate Range of Local Rates<br />
Missouri 4.225% .5% - 6. 625%<br />
Wiscons<strong>in</strong> 5.00% 0% - 1.5%<br />
Iowa 6.00% 0% - 2%<br />
Kentucky 6.00% 0%<br />
ILLINOIS 6.25% 0% - 4.25%<br />
Indiana 7.00% 0%<br />
Source: <strong>Sales</strong> Tax Institute, as of 4/1/<strong>2010</strong><br />
-9-
Table 5. 2007 STATE GENERAL SALES TAX REVENUE FOR<br />
SURROUNDING STATES<br />
State<br />
Total <strong>General</strong> <strong>Sales</strong> Tax Receipts<br />
($ billion)<br />
State<br />
Total <strong>General</strong> <strong>Sales</strong> Tax Receipts<br />
per Capita<br />
ILLINOIS $7.80 Indiana $855<br />
Wiscons<strong>in</strong> $4.16 Wiscons<strong>in</strong> $742<br />
Missouri $3.27 Kentucky $664<br />
Kentucky $2.82 ILLINOIS $608<br />
Iowa $1.79 Iowa $598<br />
Indiana $5.42 Missouri $557<br />
Source: <strong>2010</strong> Statistical Abstract, U.S. Census Bureau<br />
-10-
Other <strong>Sales</strong> <strong>Taxes</strong><br />
The Ill<strong>in</strong>ois Department of Revenue also collects other local sales taxes above and<br />
beyond the state and local rate of 6.25%. Listed below are these various other local<br />
sales taxes as described by the Department of Revenue:<br />
Bus<strong>in</strong>ess District Retailers’ Occupation Tax (65 ILCS 5/11-74.3-1 to 11-74.3-6)<br />
Municipalities that have approved a bus<strong>in</strong>ess district development or redevelopment<br />
plan and have elected to impose a tax by ord<strong>in</strong>ance may impose a Bus<strong>in</strong>ess District<br />
Retailers’ Occupation and Service Occupation Tax on sales of general merchandise<br />
with<strong>in</strong> the bus<strong>in</strong>ess district. The tax may not be imposed on sales of items that will be<br />
titled or registered with an agency of state government or on qualify<strong>in</strong>g food, drugs,<br />
and medical appliances. The Tax may be imposed <strong>in</strong> 0.25% <strong>in</strong>crements and cannot<br />
exceed 1%.<br />
Chicago Home Rule Municipal Soft Dr<strong>in</strong>k Retailers’ Occupation Tax<br />
(65 ILCS 5/8-11-6b)<br />
The Chicago Home Rule Municipal Soft Dr<strong>in</strong>k Occupation Tax is imposed on persons<br />
who sell canned or bottled soft dr<strong>in</strong>ks at retail <strong>in</strong> Chicago. The rate is 3% of gross<br />
receipts from soft dr<strong>in</strong>ks sold at retail. “Soft dr<strong>in</strong>ks” <strong>in</strong>clude (but are not limited to):<br />
• soda water,<br />
• carbonated water,<br />
• colas, and<br />
• dr<strong>in</strong>ks conta<strong>in</strong><strong>in</strong>g less than 50 percent natural fruit or vegetable juice.<br />
The follow<strong>in</strong>g list <strong>in</strong>cludes examples of dr<strong>in</strong>ks that are not <strong>in</strong>cluded <strong>in</strong> the def<strong>in</strong>ition of<br />
soft dr<strong>in</strong>ks:<br />
Founta<strong>in</strong> dr<strong>in</strong>ks,<br />
• Noncarbonated water,<br />
• Coffee,<br />
• Tea,<br />
• Infant formula,<br />
• Milk or milk products,<br />
• Dr<strong>in</strong>ks conta<strong>in</strong><strong>in</strong>g 50 percent or more natural fruit or vegetable juice,<br />
• Nonalcoholic dr<strong>in</strong>k mixes, and<br />
• Soft dr<strong>in</strong>ks when mixed and sold <strong>in</strong> an alcoholic dr<strong>in</strong>k.<br />
• Dr<strong>in</strong>ks conta<strong>in</strong><strong>in</strong>g 50 percent or more natural fruit or vegetable juice,<br />
• Nonalcoholic dr<strong>in</strong>k mixes, and<br />
• Soft dr<strong>in</strong>ks when mixed and sold <strong>in</strong> an alcoholic dr<strong>in</strong>k.<br />
-11-
County Motor Fuel Tax (55 ILCS 5/5-1035.1)<br />
DuPage, Kane, and McHenry counties have imposed a tax on the retail sale of motor<br />
fuel at a rate not exceed<strong>in</strong>g 4 cents per gallon. DuPage, McHenry, and Kane counties<br />
levy the tax at the maximum rate of 4 cents per gallon.<br />
DuPage County Water Commission Tax (70 ILCS 3720/4)<br />
The DuPage Water Commission Tax of 0.25% is imposed on sales of general<br />
merchandise with<strong>in</strong> the boundaries serviced by the DuPage Water Commission. The<br />
tax rate is 0.25%. A “use” tax is also imposed at the same rate. The tax revenue is<br />
used to support the DuPage County Water Commission which pipes water from Lake<br />
Michigan throughout DuPage County.<br />
Home Rule and Non-home Rule <strong>Sales</strong> and Use <strong>Taxes</strong><br />
• Home Rule County Retailers’ Occupation Tax — 55 ILCS 5/5-1006<br />
• Home Rule County Service Occupation Tax — 55 ILCS 5/5-1007<br />
• Home Rule Municipal Retailers’ Occupation Tax — 65 ILCS 5/8-11-1<br />
• Home Rule Municipal Service Occupation Tax — 65 ILCS 5/8-11-5<br />
• Non-home Rule Municipal Retailers’ Occupation Tax — 65 ILCS 5/8-11-1.3<br />
• Non-home Rule Municipal Service Occupation Tax — 65 ILCS 5/8-11-1.4<br />
Home rule units of local government are authorized to impose a Home Rule sales tax<br />
and certa<strong>in</strong> non-home rule units of local government are authorized to impose a Nonhome<br />
Rule sales tax to be collected by the department. Both taxes are imposed on the<br />
same general merchandise base as the state sales tax, exclud<strong>in</strong>g titled or registered<br />
tangible personal property (such as vehicles, watercraft, aircraft, trailers, and mobile<br />
homes), and qualify<strong>in</strong>g food, drugs and medical appliances.<br />
The Home Rule sales tax is <strong>in</strong> 0.25% <strong>in</strong>crements with no maximum rate limit. The<br />
Non-home Rule sales tax is <strong>in</strong> 0.25% <strong>in</strong>crements with a 0.50% maximum rate limit.<br />
As of April <strong>2010</strong>, Ill<strong>in</strong>ois had 200 home rule units of government <strong>in</strong> Ill<strong>in</strong>ois. 125 of<br />
these were enacted by referendum, while 75 qualified as a home rule unit due to their<br />
population. Cook County is the only home rule county <strong>in</strong> Ill<strong>in</strong>ois. Appendix 5 conta<strong>in</strong>s<br />
a list of all the home rule units and their comb<strong>in</strong>ed sales tax rate which range from<br />
6.25% <strong>in</strong> areas where home rule has passed but have not raised sales taxes to 11.5% <strong>in</strong><br />
certa<strong>in</strong> bus<strong>in</strong>ess districts <strong>in</strong> Bellwood.<br />
The department also adm<strong>in</strong>isters the Chicago Home Rule Use Tax on automobiles and<br />
other titled or registered items sold by dealers located <strong>in</strong> the counties of Cook, Kane,<br />
Lake, McHenry, DuPage, and Will sell<strong>in</strong>g items that will be registered to an address<br />
with<strong>in</strong> the corporate limits of Chicago. The Chicago Home Rule Use Tax is 1.25%.<br />
-12-
Mass Transit District <strong>Taxes</strong><br />
• Metro-East Mass Transit District (MED) Retailers’ Occupation Tax<br />
• (70 ILCS 3610/5.01(b))<br />
• Metro-East Mass Transit District (MED) Service Occupation Tax<br />
• (70 ILCS 3610/5.01(c))<br />
• Metro-East Mass Transit District (MED) Use Tax<br />
• (70 ILCS 3610/5.01(d))<br />
• Regional Transportation Authority (RTA) Retailers’ Occupation Tax<br />
• (70 ILCS 3615/4.03)<br />
• Regional Transportation Authority (RTA) Service Occupation Tax<br />
• (70 ILCS 3615/4.03)<br />
• Regional Transportation Authority (RTA) Use Tax<br />
• (70 ILCS 3615/4.03)<br />
The Metro-East Mass Transit District (MED) imposes a sales tax <strong>in</strong> parts of Madison<br />
and St. Clair counties. The Regional Transportation Authority (RTA) is authorized to<br />
impose a sales tax <strong>in</strong> Cook, DuPage, Kane, Lake, McHenry, and Will counties. These<br />
tax revenues are used to support public mass transportation systems.<br />
The MED imposes taxes at the follow<strong>in</strong>g rates:<br />
• 0.25% sales tax on general merchandise and sales of qualify<strong>in</strong>g food, drugs,<br />
and medical appliances <strong>in</strong> Madison County<br />
• 0.75% sales tax on general merchandise (exclud<strong>in</strong>g items that are titled or<br />
registered) and sales of qualify<strong>in</strong>g food, drugs, and medical appliances <strong>in</strong> St.<br />
Clair County<br />
• 0.25 percent sales tax on sales of titled or registered general merchandise <strong>in</strong><br />
St. Clair County and Madison County<br />
The RTA imposes taxes at the follow<strong>in</strong>g rates:<br />
• 1.00% sales tax on general merchandise <strong>in</strong> Cook County<br />
• 1.25% sales tax on qualify<strong>in</strong>g food, drugs, and medical appliances <strong>in</strong> Cook<br />
County<br />
• 0.75% sales tax on general merchandise and qualify<strong>in</strong>g food, drugs, and<br />
medical appliances <strong>in</strong> DuPage, Kane, Lake, McHenry, and Will counties<br />
Metro-East Park and Recreation District Tax (70 ILCS 1605)<br />
The Metro-East Park and Recreation District tax of 0.10% is imposed on sales of<br />
general merchandise with<strong>in</strong> the district’s boundaries. The tax is imposed on the same<br />
general merchandise base as the state sales tax, exclud<strong>in</strong>g titled or registered tangible<br />
-13-
personal property (such as vehicles, watercraft, aircraft, trailers, and mobile homes),<br />
and qualify<strong>in</strong>g food, drugs and medical appliances.<br />
Metropolitan Pier and Exposition Authority (MPEA) Food and Beverage Tax<br />
(70 ILCS 210/13(b))<br />
A retailers’ occupation tax on the gross receipts from food prepared for immediate<br />
consumption, alcoholic beverages, and soft dr<strong>in</strong>ks is imposed on sales with<strong>in</strong> Chicago’s<br />
Metropolitan Pier and Exposition Authority (MPEA) boundaries. The tax rate is 1%.<br />
Revenues from this tax are deposited <strong>in</strong>to the MPEA Trust Fund to pay debt service on<br />
all MPEA bonds and refund<strong>in</strong>g bonds.<br />
Special County Retailers’ Occupation Tax for Public Safety (55 ILCS 5/5-1006.5)<br />
County governments are authorized to impose, with voter approval, a countywide tax<br />
(<strong>in</strong> 0.25% <strong>in</strong>crements) for public safety expenditures to be collected by the department.<br />
The tax is imposed on the same general merchandise base as the state sales tax,<br />
exclud<strong>in</strong>g titled or registered tangible personal property (such as vehicles, watercraft,<br />
aircraft, trailers, and mobile homes) and qualify<strong>in</strong>g food, drugs and medical appliances.<br />
Thirty five counties <strong>in</strong> Ill<strong>in</strong>ois have county public safety sales taxes. Table 6 shows<br />
these counties and their associated tax rates.<br />
Table 6. COUNTY PUBLIC SAFETY SALES TAX RATES<br />
County Tax Rate County Tax Rate<br />
Boone 0.50% Macon 0.25%<br />
Brown 0.25% Marion 0.25%<br />
Bureau 0.50% Mcdonough 0.50%<br />
Carroll 0.25% Menard 1.00%<br />
Cass 1.00% Moultrie 0.50%<br />
Champaign 0.25% Peoria 0.50%<br />
Clark 1.00% Perry 0.50%<br />
Clay 0.50% Pike 0.50%<br />
Eff<strong>in</strong>gham 0.25% Richland 0.50%<br />
Fulton 0.50% Sal<strong>in</strong>e 0.75%<br />
Henderson 1.00% Stephenson 0.50%<br />
Jefferson 0.25% Tazewell 0.50%<br />
Jersey 0.50% Union 0.25%<br />
Kendall 1.00% Vermilion 0.25%<br />
Knox 0.25% Wayne 0.75%<br />
LaSalle 0.25% W<strong>in</strong>nebago 1.00%<br />
Logan 0.50% Woodford 1.00%<br />
Marion 0.25%<br />
Source: Ill<strong>in</strong>ois Department of Revenue<br />
-14-
<strong>Sales</strong> Tax Base<br />
The Ill<strong>in</strong>ois sales tax base is made up primarily of transfers of tangible personal<br />
property. Even though the service sector has become a greater part of the Ill<strong>in</strong>ois<br />
economy, Ill<strong>in</strong>ois is one of the states that taxes services the least. In the Federation of<br />
Tax Adm<strong>in</strong>istrators 2007 update of their Service Tax Survey, Ill<strong>in</strong>ois taxed the fifth<br />
fewest amount of services. Ill<strong>in</strong>ois taxed only 17 out of 168 identified services, the<br />
majority of those be<strong>in</strong>g related to public utilities. This is <strong>in</strong> spite of over 40% of<br />
Ill<strong>in</strong>ois’ economy be<strong>in</strong>g service related.<br />
Many states have not taxed services as broadly as tangible property due to when sales<br />
taxes were orig<strong>in</strong>ally enacted. Many states sales taxes were enacted <strong>in</strong> the 1930s.<br />
Dur<strong>in</strong>g this time, services accounted for a smaller portion of overall economic activity.<br />
Because of this, most states have tangible personal property as their primary base. This<br />
has limited the amount of sales tax revenue, as the country’s economy has become more<br />
service oriented. See the Commission’s report, “Service <strong>Taxes</strong>: 2009 Update” for<br />
more <strong>in</strong>formation on this topic.<br />
To exam<strong>in</strong>e the sales tax base, the Commission analyzed Standard Industrial<br />
Classification (SIC) code data from the Ill<strong>in</strong>ois Department of Revenue to discover<br />
from what sectors of the economy sales tax receipts come from and how these revenues<br />
have changed over the last decade. Growth rates for sales tax receipts from <strong>in</strong>dividual<br />
sectors of the economy were also calculated. F<strong>in</strong>ally, the changes <strong>in</strong> the make up of the<br />
sales tax base were calculated. The results of these calculations can be seen <strong>in</strong> Tables<br />
7 and 8.<br />
Look<strong>in</strong>g at <strong>in</strong>dividual SIC codes, restaurants, car dealerships, and department stores<br />
were the three largest <strong>in</strong>dustries that collected Ill<strong>in</strong>ois state sales taxes <strong>in</strong> 2009. The<br />
Eat<strong>in</strong>g Places (SIC Code 5812) was the largest <strong>in</strong>dustry at 12.3% of total state sales<br />
taxes collected. Two other <strong>in</strong>dustries, New and Used Car Dealers (SIC Code 5511)<br />
and Department Stores (SIC Code 5311) contributed just over 12% each also. The ten<br />
<strong>in</strong>dustries that collect the most state sales tax can be found <strong>in</strong> Table 7. These ten<br />
<strong>in</strong>dustries accounted for approximately 63% of all the state sales tax revenue received.<br />
For data from each of the <strong>in</strong>dividual SIC codes please see the Department of Revenue’s<br />
“The <strong>Sales</strong> Tax for 2009 Annual Report” which can be found at<br />
http://www.revenue.state.il.us/AboutIdor/TaxStats/SICAnnual09.pdf.<br />
-15-
Table 7. TOP TEN INDUSTRIES BY SIC CODE<br />
SIC CODE<br />
SIC Code<br />
Percent of Total <strong>Sales</strong><br />
Tax Receipts, 2009<br />
Rank<br />
Eat<strong>in</strong>g Places 5812 12.3% 1<br />
New and Used Car Dealers 5511 12.2% 2<br />
Department Stores 5311 12.1% 3<br />
Gasol<strong>in</strong>e Service Stations 5541 6.4% 4<br />
Lumber and Other Build<strong>in</strong>g Materials 5211 5.0% 5<br />
Grocery Stores 5411 4.7% 6<br />
Miscellaneous Retail Stores 5999 3.5% 7<br />
Family Cloth<strong>in</strong>g Stores 5651 2.3% 8<br />
Computer and Software Stores 5734 2.3% 9<br />
Auto and Home Supply Stores 5531 1.7% 10<br />
Source: Ill<strong>in</strong>ois Department of Revenue<br />
The Department of Revenue has categorized the SIC codes <strong>in</strong>to 10 categories. Table 8<br />
illustrates the results of this categorization. In 2009, the largest portion of sales tax<br />
receipts came from the Automotive and Fill<strong>in</strong>g Stations sector. This sector contributed<br />
$1.41 billion, or just fewer than 21%, of the $6.76 billion <strong>in</strong> sales tax revenue. This<br />
was followed by the Agriculture and All Others category at $1.15 billion. The<br />
Dr<strong>in</strong>k<strong>in</strong>g and Eat<strong>in</strong>g Places ($855 million), Drugs and Misc. Retail ($845 million), and<br />
<strong>General</strong> Merchandise ($770 million) categories all contribute more than 11% of total<br />
state sales tax receipts.<br />
S<strong>in</strong>ce 1999, the Food category has <strong>in</strong>creased at the fastest rate. From 1999-2009, the<br />
Food category grew an average of 4.4% per year. Drugs & Misc. Retail was the<br />
second fastest grow<strong>in</strong>g sector at 4.2%. Two categories actually had decl<strong>in</strong><strong>in</strong>g sales tax<br />
receipts. The Agriculture and All Other category decl<strong>in</strong>ed 0.2% per year, while sales<br />
tax revenue from Manufacturers dropped an average of 2.9% per year.<br />
In exam<strong>in</strong><strong>in</strong>g the composition of the sales tax base of 1999 and 2009, a few changes<br />
were apparent, though <strong>in</strong> general the composition was much the same <strong>in</strong> both years.<br />
The Automotive and Fill<strong>in</strong>g Stations category was the largest portion <strong>in</strong> both years but<br />
accounted for approximately 1.5% less of the total <strong>in</strong> 2009. The largest change <strong>in</strong> the<br />
sales tax base could be found <strong>in</strong> the Agriculture and All Others category which went<br />
from over 21% <strong>in</strong> 1999 to 17.1% of the sales tax base <strong>in</strong> 2009. These decl<strong>in</strong>es <strong>in</strong><br />
proportion of the sales tax base can be accounted for by the approximate <strong>in</strong>crease of 3%<br />
by both the Dr<strong>in</strong>k<strong>in</strong>g and Eat<strong>in</strong>g Places and Drugs & Misc. Retail categories. In fact<br />
these two categories surpassed <strong>General</strong> Merchandise between 1999 and 2009 to become<br />
the third and fourth largest contributors to state sales tax receipts.<br />
A break down of the categories by SIC Code can be obta<strong>in</strong>ed at<br />
https://www.revenue.state.il.us/app/kob/terms.jsp.<br />
-16-
Table 8. SALES TAX RECEIPTS BY SECTOR<br />
Sector<br />
<strong>Sales</strong> Tax Receipts<br />
Average Growth % of Total<br />
($Million)<br />
Rate<br />
1999 2009 1999 2009<br />
Difference<br />
Automotive & Fill<strong>in</strong>g Stations $1,387.1 $1,414.2 1.5% 22.44% 20.94% -1.51%<br />
Agriculture & All Others $1,306.5 $1,153.6 -0.2% 21.14% 17.08% -4.06%<br />
Dr<strong>in</strong>k<strong>in</strong>g and Eat<strong>in</strong>g Places $603.0 $854.9 3.9% 9.76% 12.66% 2.90%<br />
Drugs & Misc. Retail $598.7 $845.1 4.2% 9.69% 12.51% 2.82%<br />
<strong>General</strong> Merchandise $718.1 $770.1 1.5% 11.62% 11.40% -0.22%<br />
Lumber, Bldg, Hardware $384.2 $436.4 2.6% 6.22% 6.46% 0.24%<br />
Furniture & H.H. & Radio $426.7 $428.0 1.8% 6.90% 6.34% -0.57%<br />
Food $244.6 $336.8 4.4% 3.96% 4.99% 1.03%<br />
Apparel $236.0 $284.5 2.4% 3.82% 4.21% 0.39%<br />
Manufacturers $275.3 $231.5 -2.9% 4.46% 3.43% -1.03%<br />
TOTAL $6,180.2 $6,755.1 1.7% 100.0% 100.0% 0.00%<br />
Source: Ill<strong>in</strong>ois Department of Revenue<br />
To exam<strong>in</strong>e the geographic locale of the sales tax base, the Commission analyzed state<br />
sales tax receipts at the county and municipality level for calendar year 2009. The<br />
Commission first looked at 2009 state sales tax revenue by county. Cook County and<br />
the downstate area each accounted for approximately 36% of the sales tax base, while<br />
the collar counties contributed for just over 28%. The largest 20 counties accounted<br />
for 86% of the sales tax base, while the rema<strong>in</strong><strong>in</strong>g 82 counties contributed only 14%.<br />
Table 9 shows the results of this analysis. Appendix 6 conta<strong>in</strong>s state sales tax data for<br />
all 102 Ill<strong>in</strong>ois counties.<br />
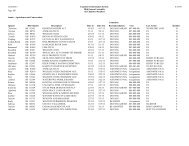
At the municipality level of government, Chicago had the largest portion account<strong>in</strong>g for<br />
just fewer than 14% (or $819 million) of the $5.9 billion dollars <strong>in</strong> state sales taxes.<br />
N<strong>in</strong>e other municipalities raised more than $70 million <strong>in</strong> state sales taxes. These<br />
<strong>in</strong>cluded Schaumburg ($114M), Spr<strong>in</strong>gfield ($99M), Naperville ($99), Kankakee<br />
($85M), Peoria ($84M), Rockford ($82M), Aurora ($74M), Orland Park ($72M), and<br />
Bloom<strong>in</strong>gton ($70M). The 20 highest gross<strong>in</strong>g municipalities contributed just over<br />
35% of local sales taxes. As seen <strong>in</strong> Table 10, the top twenty consists of Chicago (1 st ),<br />
followed by the bigger suburbs and downstate cities (2 nd -10 th ), and end<strong>in</strong>g with more<br />
Chicago area suburbs (11 th -20 th ).<br />
Based on this analysis, the majority of the sales tax base is located with<strong>in</strong> Cook and the<br />
Collar County areas with pockets of sales tax revenue com<strong>in</strong>g from the larger<br />
downstate cities.<br />
-17-
Table 9. 2009 STATE SALES TAX RECEIPTS BY<br />
COUNTY<br />
County Total % of Total Rank<br />
Cook $2,131,006,758 35.87% 1<br />
DuPage $646,406,595 10.88% 2<br />
Lake $400,057,346 6.73% 3<br />
Will $281,994,362 4.75% 4<br />
Kane $212,539,371 3.58% 5<br />
W<strong>in</strong>nebago $141,986,261 2.39% 6<br />
Kankakee $126,910,084 2.14% 7<br />
McHenry $126,371,789 2.13% 8<br />
St. Clair $124,949,800 2.10% 9<br />
Madison $119,142,631 2.01% 10<br />
Rest of State $1,629,924,497 27.43% N/A<br />
State Total $5,941,289,493 100.0% N/A<br />
Source: Ill<strong>in</strong>ois Department of Revenue<br />
Table10. 2009 STATE SALES TAX REVENUE BY<br />
MUNICIPALITY<br />
Rank Municipality Total %ofTotal<br />
1 Chicago $ 818,783,117 13.74%<br />
2 Schaumburg $ 114,136,419 1.92%<br />
3 Spr<strong>in</strong>gfield $ 99,215,667 1.67%<br />
4 Naperville $ 99,168,385 1.66%<br />
5 Kankakee $ 85,019,823 1.43%<br />
6 Peoria $ 83,962,775 1.41%<br />
7 Rockford $ 82,103,896 1.38%<br />
8 Aurora $ 74,367,226 1.25%<br />
9 Orland Park $ 72,353,182 1.21%<br />
10 Bloom<strong>in</strong>gton $ 70,205,572 1.18%<br />
11 Joliet $ 69,768,978 1.17%<br />
12 Champaign $ 58,458,463 0.98%<br />
13 Sycamore $ 49,354,205 0.83%<br />
14 Skokie $ 49,235,390 0.83%<br />
15 Glenview $ 48,411,098 0.81%<br />
16 Gurnee $ 46,541,385 0.78%<br />
17 Vernon Hills $ 46,307,551 0.78%<br />
18 Downers Grove $ 46,267,905 0.78%<br />
19 Niles $ 45,244,293 0.76%<br />
20 Oak Brook $ 44,994,598 0.76%<br />
N/A All Others $ 3,853,950,958 64.7%<br />
N/A Total $ 5,957,850,883 100.0%<br />
Source: Ill<strong>in</strong>ois Department of Revenue<br />
-18-
Internet Taxation<br />
Several issues surround the topic of Internet taxation; however, the primary focus is<br />
whether to collect sales and use taxes on goods and services sold over the Internet.<br />
Contrary to what some believe, sales and use taxes for sales made on the Internet would<br />
not be a new tax. <strong>Sales</strong> taxes are already <strong>in</strong> place <strong>in</strong> most state and local governments<br />
and, when the tax is not collected by the <strong>in</strong>ternet retailer, it should be reported by the<br />
purchaser on his or her State tax returns.<br />
Due to the US Supreme Court National Bellas Hess case <strong>in</strong> 1967 and the Quill decision<br />
<strong>in</strong> 1992, it is not required for a seller who does not have a nexus <strong>in</strong> a state to collect<br />
sales taxes because it is considered an undue burden on the seller. Therefore, Internet<br />
retail<strong>in</strong>g companies only pay sales taxes <strong>in</strong> the state <strong>in</strong> which they have a physical<br />
presence. For example, Amazon.com (who has a nexus <strong>in</strong> the State of Wash<strong>in</strong>gton)<br />
primarily sells books and CD’s, pays sales taxes to Wash<strong>in</strong>gton for only those sales<br />
made to Wash<strong>in</strong>gton residents. The company is not obligated to charge sales taxes on<br />
sales made to non-residents. This provides Amazon.com with a tax advantage over<br />
ma<strong>in</strong> street merchandise stores such as Barnes and Noble, who also sell books via the<br />
Internet, but has a nexus <strong>in</strong> virtually every state. Barnes and Noble must comply with<br />
all of the states complicated sales tax regulations, which <strong>in</strong> itself is costly to adm<strong>in</strong>ister.<br />
Opponents to Internet taxation believe that forc<strong>in</strong>g onl<strong>in</strong>e retailers to collect sales taxes<br />
will stunt the development of the Net economy. However, other political leaders have<br />
become <strong>in</strong>creas<strong>in</strong>gly concerned over the fact that these companies cut <strong>in</strong>to the profits of<br />
constituents’ ma<strong>in</strong> street stores. In addition, it is believed that the tax-free environment<br />
of the onl<strong>in</strong>e retailer is hurt<strong>in</strong>g state tax revenues which are becom<strong>in</strong>g more scarce due<br />
to the lagg<strong>in</strong>g economy.<br />
A recent study conducted by the Ill<strong>in</strong>ois Department of Revenue estimated that $143<br />
million <strong>in</strong> sales and use taxes due from onl<strong>in</strong>e sales went unpaid <strong>in</strong> FY 2008. The<br />
department estimated that this number would grow to $153 million and $163 million <strong>in</strong><br />
fiscal years 2009 and <strong>2010</strong>. The report, titled “A New Method for Estimat<strong>in</strong>g Ill<strong>in</strong>ois’s<br />
E-Commerce Losses,” can be found at:<br />
http://www.revenue.state.il.us/AboutIdor/TaxResearch/Internet<strong>Sales</strong>TaxLosses.pdf<br />
Streaml<strong>in</strong>ed <strong>Sales</strong> Tax Project<br />
The Streaml<strong>in</strong>ed <strong>Sales</strong> and Use Tax (SST) Agreement was a reaction by the States to<br />
attempts by Congress to prohibit states from collect<strong>in</strong>g taxes on on-l<strong>in</strong>e sales <strong>in</strong> early<br />
2000. Tax collections from on-l<strong>in</strong>e sales were seen as not required due to the<br />
complexity of do<strong>in</strong>g so as outl<strong>in</strong>ed <strong>in</strong> a 1992 Supreme Court rul<strong>in</strong>g (Quill Corp. V.<br />
North Dakota, 504 U.S. 298) related to mail order sales.<br />
-19-
As described by the Streaml<strong>in</strong>ed <strong>Sales</strong> Tax Govern<strong>in</strong>g Board, the purpose of the<br />
Streaml<strong>in</strong>ed <strong>Sales</strong> and Use Tax Agreement (SST) is to provide a road map for states<br />
who want to simplify and modernize sales and use tax adm<strong>in</strong>istration <strong>in</strong> the member<br />
states <strong>in</strong> order to substantially reduce the burden of tax compliance. The Agreement<br />
focuses on improv<strong>in</strong>g sales and use tax adm<strong>in</strong>istration systems for all sellers and for all<br />
types of commerce through all of the follow<strong>in</strong>g:<br />
A. State level adm<strong>in</strong>istration of sales and use tax collections.<br />
B. Uniformity <strong>in</strong> the state and local tax bases.<br />
C. Uniformity of major tax base def<strong>in</strong>itions.<br />
D. Central, electronic registration system for all member states.<br />
E. Simplification of state and local tax rates.<br />
F. Uniform sourc<strong>in</strong>g rules for all taxable transactions.<br />
G. Simplified adm<strong>in</strong>istration of exemptions.<br />
H. Simplified tax returns.<br />
I. Simplification of tax remittances.<br />
J. Protection of consumer privacy.<br />
In short, the SST agreement is a voluntary sales and use tax collection system that<br />
allows sellers to collect the required taxes on their sales based on a dest<strong>in</strong>ation based<br />
sourc<strong>in</strong>g scheme. The agreement was to take affect <strong>in</strong> member states once ten states<br />
had passed laws to come <strong>in</strong>to compliance with the agreement. The SST agreement<br />
went <strong>in</strong>to affect <strong>in</strong> October of 2005.<br />
The SST agreement essentially does three th<strong>in</strong>gs that simplify the collection of sales and<br />
use tax from sellers.<br />
1). The SST conta<strong>in</strong>s thorough tax base def<strong>in</strong>itions that makes these def<strong>in</strong>itions uniform<br />
from state to state.<br />
2). The SST sets up three technology models us<strong>in</strong>g certified sales tax adm<strong>in</strong>istration<br />
software with which sellers can pay required taxes to all the member states <strong>in</strong> the<br />
SST. The three technology models are:<br />
Model 1<br />
A certified Service Provider performs all the seller’s sales and use tax functions.<br />
The Streaml<strong>in</strong>ed <strong>Sales</strong> Tax Govern<strong>in</strong>g Board lists four companies as Certified<br />
Service Providers. These providers <strong>in</strong>clude Avalara, Exactor, ADP Taxware, and<br />
SpeedTax.<br />
Model 2<br />
A Certified Automated System which uses third party sales tax software that is<br />
certified under the SST that allows sellers to remit sales and use tax on their own.<br />
-20-
Model 3<br />
The f<strong>in</strong>al model allows sellers to develop their own sales and use tax software<br />
which is certified by the SST.<br />
3). The SST requires registered sellers to source sales of property, services and digital<br />
goods on a dest<strong>in</strong>ation basis. This means that tax revenue would be remitted to the<br />
local and state tax districts where the property is delivered or where a service is<br />
performed, not where the seller is located.<br />
Accord<strong>in</strong>g to the Streaml<strong>in</strong>ed <strong>Sales</strong> Tax Govern<strong>in</strong>g Board, there are n<strong>in</strong>eteen full<br />
member states and three associate member states. A full member state is a state that is<br />
<strong>in</strong> compliance with the Streaml<strong>in</strong>ed <strong>Sales</strong> and Use Tax agreement through its laws,<br />
rules, regulations, and policies.<br />
An associate member state is either (a) a state that is <strong>in</strong> compliance with the<br />
Streaml<strong>in</strong>ed <strong>Sales</strong> and Use Tax Agreement except that its laws, rules regulations and<br />
policies to br<strong>in</strong>g the state <strong>in</strong>to compliance are not <strong>in</strong> effect but are scheduled to take<br />
effect on or before July 1, 2009, or (b) a State that has achieved substantial compliance<br />
with the terms of the Streaml<strong>in</strong>ed <strong>Sales</strong> and Use Tax Agreement taken as a whole, but<br />
not necessarily each provision, and there is an expectation that the state will achieve<br />
compliance by July 1, 2009.<br />
The National Conference of State Legislatures (NCSL) states that six other states have<br />
had legislation <strong>in</strong>troduced to come <strong>in</strong>to compliance with the Streaml<strong>in</strong>ed <strong>Sales</strong> and Use<br />
Tax Agreement <strong>in</strong> recent years. These states were Florida, Ill<strong>in</strong>ois, Hawaii,<br />
Massachusetts, Missouri, and Wiscons<strong>in</strong>. The recent <strong>in</strong>clusion of certa<strong>in</strong> candies,<br />
groom<strong>in</strong>g and hygiene products, and soft dr<strong>in</strong>ks <strong>in</strong>to the category of fully taxed items<br />
under the sales tax as part of Public Act 096-0034 was one step by Ill<strong>in</strong>ois to more fully<br />
conform to the SST.<br />
Table 11, on the follow<strong>in</strong>g page, lists all the full and associate members of the SST.<br />
-21-
Table 11. STREAMLINED SALES TAX PROJECT<br />
STATES<br />
Full Member States<br />
Arkansas<br />
North Carol<strong>in</strong>a<br />
Indiana<br />
North Dakota<br />
Iowa<br />
Oklahoma<br />
Kansas<br />
Rhode Island<br />
Kentucky<br />
South Dakota<br />
Michigan<br />
Vermont<br />
M<strong>in</strong>nesota<br />
Wash<strong>in</strong>gton<br />
Nebraska<br />
West Virg<strong>in</strong>ia<br />
Nevada<br />
Wyom<strong>in</strong>g<br />
New Jersey<br />
Associate Member States<br />
Ohio<br />
Tennessee<br />
Utah<br />
Source: Streaml<strong>in</strong>ed <strong>Sales</strong> Tax Govern<strong>in</strong>g Board<br />
-22-
Flow Chart for <strong>Sales</strong> <strong>Taxes</strong><br />
The flow chart provided on the next page is an attempt to provide some organizational<br />
review of Ill<strong>in</strong>ois sales taxes and the distribution of funds. As the chart depicts, after<br />
an item is purchased, one must determ<strong>in</strong>e if it subject to sales taxation. Many items are<br />
exempt for sales taxation <strong>in</strong> Ill<strong>in</strong>ois and Appendix 1 provides a list of such items and<br />
the dates <strong>in</strong> which the exemption was enacted. If it is determ<strong>in</strong>ed that an item is subject<br />
to sales taxation, then one must ascerta<strong>in</strong> if it was purchased <strong>in</strong> Ill<strong>in</strong>ois. If the item is<br />
purchased from a vendor with a nexus <strong>in</strong> Ill<strong>in</strong>ois, it is subject to an Occupation Tax. If<br />
it is purchased from a vendor that does not have a physical presence with<strong>in</strong> Ill<strong>in</strong>ois, the<br />
consumer is responsible to pay a Use Tax.<br />
Additional considerations must be made <strong>in</strong> order to determ<strong>in</strong>e the f<strong>in</strong>al sales tax. One<br />
must decide whether the item is considered a qualified food, drug, or medical<br />
appliance. These items are taxed at 1%, which is forwarded to local governments.<br />
Also, many local government units have additional home-rule taxes. These units are<br />
provided <strong>in</strong> Table 6 and Appendix 5.<br />
F<strong>in</strong>ally, once the sales tax is paid by either the retailer (Occupation Tax) or purchaser<br />
(Use Tax), the funds must be distributed between the State and local governments.<br />
Funds received by the State are primarily deposited <strong>in</strong>to the <strong>General</strong> Revenue Fund.<br />
However, some money is given to the Build Ill<strong>in</strong>ois Fund, the Ill<strong>in</strong>ois Tax Increment<br />
Fund, the Capital Projects Fund, and the Common Schools Special Account Fund.<br />
All of the previous considerations, plus some additional issues are depicted <strong>in</strong> the<br />
follow<strong>in</strong>g Ill<strong>in</strong>ois <strong>Sales</strong> Tax Flowcharts.<br />
-23-
CHART 2<br />
Ill<strong>in</strong>ois <strong>Sales</strong> Tax Flowchart<br />
See Appendix 1 for<br />
a list of sales tax<br />
exempt items<br />
Is the item<br />
exempt from<br />
sales taxes?<br />
Yes<br />
0% <strong>Sales</strong> Tax<br />
Service Occupation Tax<br />
No<br />
Service Use Tax<br />
A<br />
No<br />
Is the item<br />
purchased from<br />
a retailer?<br />
Yes<br />
Is the item<br />
purchased <strong>in</strong><br />
Ill<strong>in</strong>ois?<br />
No<br />
Is the item<br />
purchased from<br />
a retailer?<br />
No<br />
B<br />
Yes<br />
Retailers’<br />
Occupation Tax<br />
Use Tax<br />
Yes<br />
1% <strong>Sales</strong><br />
Tax to Local<br />
Government<br />
No<br />
Is the item a<br />
qualify<strong>in</strong>g food,<br />
drug, or medical<br />
device?<br />
Is the item a<br />
qualify<strong>in</strong>g food,<br />
drug, or medical<br />
device?<br />
Consumer pays<br />
1% tax or the<br />
difference of<br />
Ill<strong>in</strong>ois tax and tax<br />
paid<br />
Yes<br />
No<br />
See Table 6 and Appendix<br />
5 for a list of home-rule<br />
jurisdictions<br />
Does a Home-Rule<br />
Tax apply?<br />
Does a Home-Rule<br />
Tax apply?<br />
Yes<br />
No<br />
Yes<br />
No<br />
Appropriate<br />
Home-rule<br />
tax is paid by<br />
Retailer<br />
Appropriate<br />
Home-rule<br />
tax is paid by<br />
Consumer<br />
Retailer forwards<br />
6.25% Tax to the<br />
Dept. of Revenue<br />
Consumer pays 6.25%<br />
Tax or the difference of<br />
Ill<strong>in</strong>ois tax and tax paid<br />
C<br />
D<br />
Flowchart cont<strong>in</strong>ued on next page<br />
-24-
CHART 2 (cont<strong>in</strong>ued)<br />
Ill<strong>in</strong>ois <strong>Sales</strong> Tax Flowchart<br />
(cont<strong>in</strong>ued)<br />
A<br />
B<br />
0% sales tax<br />
on services<br />
No<br />
Is the item<br />
purchased from<br />
a serviceman?<br />
Is the item<br />
purchased from<br />
a serviceman?<br />
No<br />
0% sales tax<br />
on services<br />
Yes<br />
Yes<br />
Appropriate<br />
Home-rule<br />
tax is paid by<br />
Retailer<br />
Yes<br />
Does a Home-Rule<br />
Tax apply?<br />
Does a Home-Rule<br />
Tax apply?<br />
Yes<br />
Appropriate<br />
Home-rule<br />
tax is paid by<br />
Consumer<br />
C<br />
Retailer forwards<br />
6.25% Tax to the<br />
Dept. of Revenue<br />
Consumer pays 6.25%<br />
tax or the difference of<br />
Ill<strong>in</strong>ois tax and tax paid<br />
D<br />
See Table 6 and Appendix<br />
5 for a list of home-rule<br />
jurisdictions<br />
Distribution<br />
C<br />
D<br />
80% to State<br />
Government<br />
16% to Local<br />
Government Tax Fund<br />
4% to County and<br />
Mass Transit Fund<br />
80% to State<br />
Government<br />
20% to State and Local<br />
Tax Reform Fund<br />
E<br />
1.75% to Build<br />
Ill<strong>in</strong>ois Fund<br />
3.8% to Build<br />
Ill<strong>in</strong>ois fund to<br />
retire bonds<br />
0.27% to Ill<strong>in</strong>ois<br />
Tax Increment<br />
Fund<br />
25% to Common<br />
Schools Special<br />
Account Fund<br />
Revenues from certa<strong>in</strong><br />
items to Capital<br />
Projects Fund<br />
Rema<strong>in</strong>der to <strong>General</strong><br />
Revenue Fund with 2<br />
transfers out<br />
3/32 from downstate counties and<br />
municipalities with mass transit<br />
districts to the Downstate Public<br />
Transportation Fund<br />
3/32 from Madison, Monroe,<br />
and St. Clair Counties to the<br />
Downstate Public<br />
Transportation Fund<br />
-25-
APPENDIX 1: ILLINOIS SALES TAX EXEMPTIONS<br />
Exemption<br />
Year Enacted<br />
Feed and Seed Exemption 1933<br />
Occasional <strong>Sales</strong> 1933<br />
Charitable, Religious, Governmental, and Educational Exemption 1953<br />
Demonstration Use Prior to Resale 1955<br />
Interim Use Prior to Sale Exemption 1955<br />
Property Acquired by Non-Resident before Relocat<strong>in</strong>g <strong>in</strong> Ill<strong>in</strong>ois Exemption 1955<br />
Traded-In Property Exemption 1955<br />
Use by Nonresidents While Temporarily Pass<strong>in</strong>g Through Ill<strong>in</strong>ois Exemption 1955<br />
Retailer’s Discount 1960<br />
<strong>Sales</strong> by Exempt Organizations 1961<br />
Newspr<strong>in</strong>t and Ink to Newspapers and Magaz<strong>in</strong>es Exemption 1965<br />
<strong>Sales</strong> of Fuel to Vessels on Border<strong>in</strong>g Rivers 1968<br />
Roll<strong>in</strong>g Stock Exemption 1968<br />
Pollution Control Facilities Exemption 1970<br />
<strong>Sales</strong> Through Penny Bulk Vend<strong>in</strong>g Mach<strong>in</strong>es 1972<br />
<strong>Sales</strong> of Motor Vehicles to Non-Residents Exemption 1974<br />
Farm Chemicals Exemptions 1975<br />
Nutrition Program for the Elderly Exemption 1975<br />
Manufactur<strong>in</strong>g and Assembl<strong>in</strong>g Mach<strong>in</strong>ery and Equipment Exemption 1979<br />
Farm Mach<strong>in</strong>ery and Equipment Exemption 1980<br />
Food, Drugs, and Medical Appliances Rate Reduction 1980<br />
Gasohol Discount 1980<br />
Low Sulfur Dioxide Emissions Coal Fueled Device Exemption 1980<br />
Distillation Mach<strong>in</strong>ery and Equipment Exemption 1981<br />
Graphic Arts Mach<strong>in</strong>ery and Equipment Exemption 1981<br />
Build<strong>in</strong>g Materials with<strong>in</strong> Enterprise Zone Exemption 1982<br />
Teacher Sponsored Student Organization Exemption 1983<br />
<strong>Sales</strong> to County Fair Association Exemption 1983<br />
Replacement Vehicles Exemption 1984<br />
Property Used <strong>in</strong> the Operation of Pollution Control Facilities 1985<br />
Designated Personal Property with<strong>in</strong> Enterprise Zone Exemption 1985<br />
Legal Tender, Medallions, and Bullion Exemption 1985<br />
Build<strong>in</strong>g Materials to High Economic Impact Bus<strong>in</strong>ess Exemption 1986<br />
Coal Mach<strong>in</strong>ery and Equipment Exemption 1986<br />
Oil Mach<strong>in</strong>ery and Equipment Exemption 1986<br />
Photo Process<strong>in</strong>g Mach<strong>in</strong>ery and Equipment Exemption 1988<br />
<strong>Sales</strong> of Vehicles to Automobile Renters Exemption 1988<br />
<strong>Sales</strong> to Not for Profit Music and Dramatic Arts Organization Exemption 1988<br />
Senior Citizens Service Enterprises Exemption 1988<br />
Specified Photoprocess<strong>in</strong>g Charges Exemption 1988<br />
Fuel and Petroleum Products for International Flight Exemption 1989<br />
Mach<strong>in</strong>ery/Equipment for Operation of High Economic Impact Service Facility 1989<br />
Nurs<strong>in</strong>g Homes Food Drugs and Medical Appliances Exemption 1991<br />
<strong>Sales</strong> of Tangible Personal Property Used by Aircraft Ma<strong>in</strong>tenance Facilities 1991<br />
<strong>Sales</strong> of Mach<strong>in</strong>ery and Equipment <strong>in</strong> Operation of Aircraft Ma<strong>in</strong>tenance Facilities 1991<br />
Manufacturer’s Purchase Credit 1995<br />
Disaster Relief Donation and Infrastructure Repair Exemption 1996<br />
Leased Property to Hospitals or Government Bodies 1996<br />
Vend<strong>in</strong>g Mach<strong>in</strong>e Exemption 2000<br />
Majority Blended Ethanol 2003<br />
Biodiesel Discount and Exemption 2003<br />
Build<strong>in</strong>g Materials with<strong>in</strong> Enterprise Zone Exemption 2006<br />
Aircraft Support Center Exemption 2007<br />
SOURCE: Ill<strong>in</strong>ois Tax Expenditure Report, Ill<strong>in</strong>ois Comptroller's Office<br />
-26-
Appendix 2. ILLINOIS SALES TAX EXEMPTION STATISTICS<br />
($ Millions)<br />
FY 1996 FY 1997 FY 1998 FY 1999 FY 2000 FY 2001 FY 2002 FY 2003 FY 2004 FY 2005 FY 2006 FY 2007 FY 2008<br />
Average % Growth<br />
(1996-2008)<br />
Food, Drugs, and Medical Appliances Rate<br />
Reduction $ 808 $ 864 $ 905 $ 918 $ 1,050 $ 1,100 $ 1,160 $ 1,169 $ 1,223 $ 1,300 $ 1,371 $ 1,461 $ 1,408 4.8%<br />
<strong>Sales</strong> to Exempt Organizations $ 488 $ 512 $ 536 $ 558 $ 670 $ 667 $ 874 $ 893 $ 930 $ 967 $ 1,012 $ 1,020 $ 515 2.5%<br />
Traded-In Property Exemption $ 300 $ 300 $ 300 $ 300 $ 325 $ 325 $ 350 $ 339 $ 343 $ 466 $ 374 $ 370 $ 357 2.1%<br />
Farm Chemicals (Includes Feed and Seed)<br />
Exemption $ 144 $ 151 $ 158 $ 164 $ 185 $ 190 $ 200 $ 204 $ 209 $ 212 $ 221 $ 165 $ 207 3.7%<br />
Manufactur<strong>in</strong>g and Assembl<strong>in</strong>g Mach<strong>in</strong>ery<br />
Exemption $ 112 $ 117 $ 122 $ 127 $ 144 $ 147 $ 155 $ 158 $ 162 $ 165 $ 175 $ 261 $ 200 6.0%<br />
Gasahol Discount $ - $ - $ - $ 28 $ 41 $ 50 $ 46 $ 60 $ 63 $ 78 $ 101 $ 101 $ 133 20.0%<br />
Retailer's Discount $ 82 $ 86 $ 88 $ 90 $ 103 $ 102 $ 104 $ 107 $ 113 $ 119 $ 126 $ 126 $ 127 3.8%<br />
Biodiesel Discount and Exemption $ - $ - $ - $ - $ - $ - $ - N/A N/A $ 8 $ 46 $ 68 $ 111 203.8%<br />
Roll<strong>in</strong>g Stock Exemption $ 56 $ 50 $ 85 $ 70 $ 128 $ 70 $ 92 $ 104 $ 42 $ 50 $ 68 $ 108 $ 52 10.5%<br />
<strong>Sales</strong> of Motor Vehicles to Non-Residents<br />
Exemption $ 60 $ 62 $ - $ 51 $ 75 $ 46 $ 76 $ 72 $ 70 $ 69 $ 36 $ 34 $ 47 5.3%<br />
Newspr<strong>in</strong>t and Ink to Newspapers and Magaz<strong>in</strong>es<br />
Exemption N/A N/A N/A $ 40 $ 40 $ 40 $ 40 $ 40 $ 41 $ 42 $ 42 $ 38 $ 39 -0.2%<br />
Designated Tangible Personal Property with<strong>in</strong><br />
Enterprise Zone Exemption N/A N/A N/A $ 27 $ 28 $ 30 $ 30 $ 32 $ 27 $ 25 $ 24 $ 37 $ 37 4.9%<br />
Farm Mach<strong>in</strong>ery and Equipment Exemption N/A N/A N/A $ 39 $ 44 $ 45 $ 45 $ 46 $ 47 $ 48 $ 50 $ 32 $ 36 0.3%<br />
Manufacturer's Purchase Credit N/A N/A N/A N/A $ 18 $ 21 $ 20 $ 28 $ 22 $ 25 $ 29 $ 29 $ 28 7.4%<br />
Graphic Arts Mach<strong>in</strong>ery and Equipment Exemption N/A N/A N/A N/A $ 7 $ 7 $ 4 N/A $ - $ - $ 4 $ 4 $ 23 124.7%<br />
<strong>Sales</strong> of Vehicles to Automobile Rentors<br />
Exemption N/A N/A N/A $ 13 $ 28 $ 13 $ 25 $ 24 $ 29 $ 43 $ 52 $ 51 $ 16 18.3%<br />
Commercial Distribution Fee (CDF) Exemption N/A N/A N/A $ - $ - $ - $ - $ - $ 38 $ 34 $ - $ - $ - N/A<br />
State <strong>Sales</strong> Tax Exemption on Motor Fuels $ - $ - $ - $ - $ - $ 163 $ - $ - $ - $ - $ - $ - $ - N/A<br />
All Other $ 172 $ 191 $ 238 $ 48 $ 38 $ 35 $ 25 $ 29 $ 21 $ 21 $ 21 $ 24 $ 22 -9.0%<br />
Total <strong>Sales</strong> and Use Tax Exemptions $ 2,221 $ 2,332 $ 2,431 $ 2,473 $ 2,924 $ 3,053 $ 3,245 $ 3,305 $ 3,379 $ 3,672 $ 3,753 $ 3,928 $ 3,357 3.8%<br />
Source: Tax Expenditure Report, Ill<strong>in</strong>ois Comptroller's Office<br />
-27-
Appendix 3. SALES TAX RATE BY STATE<br />
State State Rate Rank Range of Local Rates<br />
Alabama 4.00% 38 0% - 8%<br />
Alaska 0.00% 47 0% - 7.5%<br />
Arizona 5.60% 27 0 -5.5%<br />
Arkansas 6.00% 13 0% - 5.50%<br />
California 7.25% 1 1.00% - 3%<br />
Colorado 2.90% 46 0% - 7%<br />
Connecticut 6.00% 13 0%<br />
Delaware 0.00% 47 0%<br />
District of Columbia 6.00% 13 0%<br />
Florida 6.00% 13 0% - 1.50%<br />
Georgia 4.00% 38 1% - 4%<br />
Hawaii 4.00% 38 0% - 0.5%<br />
Idaho 6.00% 13 0% - 3%<br />
ILLINOIS 6.25% 10 0% - 4.25%<br />
Indiana 7.00% 2 0%<br />
Iowa 6.00% 13 0% - 2%<br />
Kansas 5.30% 30 0% - 4%<br />
Kentucky 6.00% 13 0%<br />
Louisiana 4.00% 38 0% - 6.75%<br />
Ma<strong>in</strong>e 5.00% 31 0%<br />
Maryland 6.00% 13 0%<br />
Massachusetts 6.25% 10 0%<br />
Michigan 6.00% 13 0%<br />
M<strong>in</strong>nesota 6.875% 7 0% - 1%<br />
Mississippi 7.00% 2 0% - .25%<br />
Missouri 4.23% 37 .5% - 6.625%<br />
Montana 0.00% 47 0%<br />
Nebraska 5.50% 28 0% - 2%<br />
Nevada 6.85% 8 0% - 1.25%<br />
New Hampshire 0.00% 47 0%<br />
New Jersey 7.00% 2 0%<br />
New Mexico 5.00% 31 .125% - 5.625%<br />
New York 4.00% 38 0% - 5%<br />
North Carol<strong>in</strong>a 5.75% 26 2% - 3%<br />
North Dakota 5.00% 31 0% - 2.50%<br />
Ohio 5.50% 28 0 - 2.25%<br />
Oklahoma 4.50% 36 0% - 6.35%<br />
Oregon 0.00% 47 0%<br />
Pennsylvania 6.00% 13 0% - 2%<br />
Rhode Island 7.00% 2 0%<br />
South Carol<strong>in</strong>a 6.00% 13 0% - 3%<br />
South Dakota 4.00% 38 0% - 2%<br />
Tennessee 7.00% 2 1.5% - 2.75%<br />
Texas 6.25% 10 0% - 2%<br />
Utah 4.70% 35 1% - 5.25%<br />
Vermont 6.00% 13 0% - 1%<br />
Virg<strong>in</strong>ia 4.00% 38 1%<br />
Wash<strong>in</strong>gton 6.50% 9 .5% - 3%<br />
West Virg<strong>in</strong>ia 6.00% 13 0%<br />
Wiscons<strong>in</strong> 5.00% 31 0% - 1.5%<br />
Wyom<strong>in</strong>g 4.00% 38 0% - 4%<br />
Source: <strong>Sales</strong> Tax Institute, as of 4/1/<strong>2010</strong><br />
-28-
Appendix 4. STATE SALES TAX REVENUE<br />
(2007)<br />
Rank State <strong>General</strong> <strong>Sales</strong> Tax Rank State Per Capita<br />
N/A United States $236,333 N/A United States $784<br />
1 California $32,669 1 Hawaii $1,993<br />
2 Florida $21,749 2 Wash<strong>in</strong>gton $1,679<br />
3 Texas $20,435 3 Wyom<strong>in</strong>g $1,336<br />
4 New York $10,880 4 Nevada $1,252<br />
5 Wash<strong>in</strong>gton $10,861 5 Florida $1,192<br />
6 Pennsylvania $8,662 6 Tennessee $1,099<br />
7 New Jersey $8,346 7 Mississippi $1,081<br />
8 Michigan $7,983 8 Arkansas $1,025<br />
9 ILLINOIS $7,817 9 New Jersey $961<br />
10 Ohio $7,781 10 New Mexico $936<br />
11 Tennessee $6,764 11 Arizona $897<br />
12 Georgia $6,382 12 California $894<br />
13 Arizona $5,684 13 South Dakota $893<br />
14 Indiana $5,424 14 Connecticut $865<br />
15 North Carol<strong>in</strong>a $5,202 15 M<strong>in</strong>nesota $860<br />
16 M<strong>in</strong>nesota $4,471 16 Texas $855<br />
17 Wiscons<strong>in</strong> $4,159 17 Indiana $855<br />
18 Massachusetts $4,076 18 Idaho $852<br />
19 Virg<strong>in</strong>ia $3,539 19 Nebraska $836<br />
20 Louisiana $3,481 20 Rhode Island $828<br />
21 Maryland $3,448 21 Louisiana $811<br />
22 Missouri $3,273 22 Kansas $808<br />
23 South Carol<strong>in</strong>a $3,234 23 Ma<strong>in</strong>e $801<br />
24 Nevada $3,213 24 Michigan $793<br />
25 Mississippi $3,156 25 North Dakota $757<br />
26 Connecticut $3,030 26 Wiscons<strong>in</strong> $742<br />
27 Arkansas $2,904 27 Utah $739<br />
28 Kentucky $2,818 28 South Carol<strong>in</strong>a $734<br />
29 Hawaii $2,558 29 Pennsylvania $697<br />
30 Alabama $2,278 30 Ohio $679<br />
31 Kansas $2,242 31 Georgia $669<br />
32 Colorado $2,219 32 Kentucky $664<br />
33 Oklahoma $1,964 33 Massachusetts $632<br />
34 Utah $1,954 34 West Virg<strong>in</strong>ia $623<br />
35 New Mexico $1,844 35 Maryland $614<br />
36 Iowa $1,787 36 ILLINOIS $608<br />
37 Nebraska $1,484 37 Iowa $598<br />
38 Idaho $1,278 38 North Carol<strong>in</strong>a $574<br />
39 West Virg<strong>in</strong>ia $1,130 39 New York $564<br />
40 Ma<strong>in</strong>e $1,055 40 Missouri $557<br />
41 Rhode Island $876 41 Oklahoma $543<br />
42 South Dakota $711 42 Vermont $538<br />
43 Wyom<strong>in</strong>g $698 43 Alabama $492<br />
44 North Dakota $484 44 Virg<strong>in</strong>ia $459<br />
45 Vermont $334 45 Colorado $456<br />
46 Alaska $0 46 Alaska $0<br />
46 Delaware $0 46 Delaware $0<br />
46 Montana $0 46 Montana $0<br />
46 New Hampshire $0 46 New Hampshire $0<br />
46 Oregon $0 46 Oregon $0<br />
Source: The <strong>2010</strong> Statistical Abstract, U.S. Census Bureau<br />
-29-
Appendix 5. ILLINOIS HOME RULE UNITS<br />
(April <strong>2010</strong>)<br />
Home Rule Unit<br />
Comb<strong>in</strong>ed<br />
<strong>Sales</strong> Tax Rate<br />
Home Rule Unit<br />
Comb<strong>in</strong>ed<br />
<strong>Sales</strong> Tax Rate<br />
Addison 8.00% Buffalo Grove (Lake) 8.00%<br />
Alsip 9.75% Burbank 9.75%<br />
Alton (Alton Square Bus<strong>in</strong>ess District ) 8.85% Burnham 10.00%<br />
Alton (Outside Above District) 7.85% Cahokia 8.10%<br />
Arl<strong>in</strong>gton Heights 10.00% Calumet City 10.00%<br />
Aurora (DuPage) 8.25% Calumet Park 10.00%<br />
Aurora (Kane) 8.25% Carbon Cliff 6.75%<br />
Aurora (Kendall) 8.50% Carbondale (Jackson) 7.75%<br />
Aurora (Will) 8.25% Carbondale (Williamson) 8.75%<br />
Bannockburn 7.50% Carlock 6.75%<br />
Barr<strong>in</strong>gton Hills (Cook) 9.00% Carol Stream 7.75%<br />
Bartlett (Cook) 9.00% Carpentersville 8.50%<br />
Bartlett (DuPage) 7.00% Carterville 8.25%<br />
Bartonville 6.75% Champaign 8.75%<br />
Batavia (DuPage) 7.50% Channahon (Grundy) 7.25%<br />
Batavia (Kane) 7.50% Channahon (Will) 8.00%<br />
Bedford Park 9.75% Chicago (Cook) 10.25%<br />
Belleville (Bus<strong>in</strong>ess Districts) 8.85% Chicago (DuPage) 8.25%<br />
Belleville (Outside above Districts) 7.85% Chicago Heights 10.00%<br />
Bellwood (Bus<strong>in</strong>ess Districts) 11.50% Chicago Ridge 9.75%<br />
Bellwood (Outside above Districts) 10.50% Christopher 7.25%<br />
Benton 7.50% Cicero 10.50%<br />
Berkeley (Outside Bus<strong>in</strong>ess Districts) 10.00% Coll<strong>in</strong>sville (Madison - Cross<strong>in</strong>g South Bus<strong>in</strong>ess District) 8.60%<br />
Berwyn 10.00% Coll<strong>in</strong>sville (Madison - Other Bus<strong>in</strong>ess Districts) 9.10%<br />
Bloom<strong>in</strong>gdale (Bus<strong>in</strong>ess Districts) 8.75% Coll<strong>in</strong>sville (Madison - Outside Above Districts) 8.10%<br />
Bloom<strong>in</strong>gdale (Outside Above Districts) 7.75% Coll<strong>in</strong>sville (St. Clair) 8.60%<br />
Bloom<strong>in</strong>gton 7.75% Cook County 9.00%<br />
Bol<strong>in</strong>gbrook (DuPage) 8.50% Country Club Hills 10.25%<br />
Bol<strong>in</strong>gbrook (Will) 8.50% Countryside 9.75%<br />
Bridgeview 10.00% Cra<strong>in</strong>ville 8.25%<br />
Bryant 6.75% Crystal Lake 7.75%<br />
Buffalo Grove (Cook) 10.00% Danville 7.75%<br />
-30-
Appendix 5. ILLINOIS HOME RULE UNITS<br />
(April <strong>2010</strong>)<br />
Home Rule Unit<br />
Comb<strong>in</strong>ed<br />
<strong>Sales</strong> Tax Rate<br />
Home Rule Unit<br />
Comb<strong>in</strong>ed<br />
<strong>Sales</strong> Tax Rate<br />
Darien 8.00% Fairview Heights (Outside Above District) 7.85%<br />
Decatur 8.00% Flora 7.25%<br />
Deerfield (Cook) 10.00% Forest View 10.00%<br />
Deerfield (Lake) 8.00% Freeport 8.00%<br />
DeKalb 8.00% Galesburg 7.50%<br />
DePue 6.75% Glen Ellyn 8.25%<br />
Des Pla<strong>in</strong>es 10.00% Glendale Heights 8.25%<br />
Dolton 9.50% Glenview 9.75%<br />
Downers Grove 8.00% Glenwood 9.00%<br />
DuQuo<strong>in</strong> 8.25% Golf 9.00%<br />
East Dundee (Cook) 10.50% Granite City (Bus<strong>in</strong>ess District) 9.10%<br />
East Dundee (Kane - Buis<strong>in</strong>ess Districts) 9.00% Granite City (Outside Above District) 8.35%<br />
East Dundee (Kane - Outside Above Districts) 8.50% Gurnee 7.50%<br />
East Hazel Crest 9.50% Hanover Park (Cook) 9.50%<br />
East St. Louis 8.85% Hanover Park (DuPage) 7.50%<br />
Edwardsville (Chouteau Township - Bus<strong>in</strong>ess District) 7.85% Harvey 10.00%<br />
Edwardsville (Chouteau Township - Outside Above District) 6.85% Harwood Heights 10.25%<br />
Edwardsville (Edwardsville Township - Bus<strong>in</strong>ess District) 7.85% Hazel Crest 10.00%<br />
Edwardsville (Edwardsville Township - Outside Above District) 6.85% Herr<strong>in</strong> 8.50%<br />
Edwardsville (P<strong>in</strong> Oak Township - Bus<strong>in</strong>ess District) 7.60% Highland Park (Lake) 8.00%<br />
Edwardsville (P<strong>in</strong> Oak Township - Outside Above District) 6.60% Highwood 8.50%<br />
Elg<strong>in</strong> (Cook) 9.75% Hillside 10.00%<br />
Elg<strong>in</strong> (Kane) 7.75% Hodgk<strong>in</strong>s 9.00%<br />
Elk Grove Village (Cook) 10.00% Hoffman Estates (Cook) 10.00%<br />
Elk Grove Village (DuPage) 8.00% Hoffman Estate (Kane) 8.00%<br />
Elmhurst (Cook) 10.00% Homer Glen 8.00%<br />
Elmhurst (DuPage) 8.00% Hopk<strong>in</strong>s Park 6.25%<br />
Elmwood Park 10.00% Inverness 9.00%<br />
Elwood 8.00% Jacksonville 7.00%<br />
Evanston 10.00% Joliet (Kendall) 8.50%<br />
Evergreen Park<br />
9.75% Joliet (Will) 8.25%<br />
Fairview Heights (Bus<strong>in</strong>ess District) 8.35% Kankakee 6.25%<br />
-31-
Appendix 5. ILLINOIS HOME RULE UNITS<br />
(April <strong>2010</strong>)<br />
Home Rule Unit<br />
Comb<strong>in</strong>ed<br />
<strong>Sales</strong> Tax Rate<br />
Home Rule Unit<br />
Comb<strong>in</strong>ed<br />
<strong>Sales</strong> Tax Rate<br />
Lake Barr<strong>in</strong>gton 7.00% Norridge 10.25%<br />
Lake Bluff 8.00% North Chicago 7.00%<br />
Lake Forest 7.50% North Utica 6.50%<br />
Lake <strong>in</strong> th Hills 7.50% Northbrook (Cook) 9.75%<br />
Lans<strong>in</strong>g 9.50% Northbrook (Lake) 7.75%<br />
LaSalle 7.00% Northlake (Cook) 10.00%<br />
L<strong>in</strong>colnshire 7.00% Northlake (DuPage) 8.00%<br />
L<strong>in</strong>colnwood 10.00% Oak Forest 9.00%<br />
Manhattan 8.00% Oak Lawn 9.50%<br />
Marion 8.50% Oak Park 10.00%<br />
Mascoutah 7.60% Oakbrook Terrace (Bus<strong>in</strong>ess District) 9.25%<br />
<strong>May</strong>wood 9.00% Oakbrook Terrace (Outside Above District) 8.25%<br />
McCook 10.00% O'Fallon 7.85%<br />
McHenry 7.00% Old Mill Creek 7.00%<br />
Mettawa 7.00% Onarga 6.25%<br />
Midlothian 9.00% Orland Park 9.75%<br />
Mol<strong>in</strong>e 7.50% Oswego 7.25%<br />
Monee 8.00% Palat<strong>in</strong>e 10.00%<br />
Monmouth 7.25% Park City 8.00%<br />
Morton Grove 10.00% Park Forest (Cook) 9.00%<br />
Mound City 6.25% Park Forest (Will) 7.00%<br />
Mount Prospect 10.00% Park Ridge 10.00%<br />
Mount Vernon 7.50% Pek<strong>in</strong> (Peoria) 8.00%<br />
Muddy 7.00% Pek<strong>in</strong> (Tazewell) 8.00%<br />
Mundele<strong>in</strong> 8.00% Peoria (Bus<strong>in</strong>ess District) 9.25%<br />
Murphysboro 7.25% Peoria (Outside Above District) 8.25%<br />
Naperville 7.25% Peoria Heights (Peoria) 7.75%<br />
Naples 6.25% Peoria Heights (Tazewell) 7.75%<br />
Nauvoo 7.00% Peru 7.00%<br />
New Lenox 8.00% Phoenix 9.00%<br />
Niles 10.00% Pla<strong>in</strong>field (Kendall) 8.25%<br />
Normal 7.50% Pla<strong>in</strong>field (Will) 8.00%<br />
-32-
Appendix 5. ILLINOIS HOME RULE UNITS<br />
(April <strong>2010</strong>)<br />
Home Rule Unit<br />
Comb<strong>in</strong>ed<br />
<strong>Sales</strong> Tax Rate<br />
Home Rule Unit<br />
Comb<strong>in</strong>ed<br />
<strong>Sales</strong> Tax Rate<br />
Posen 9.50% Tilton 7.50%<br />
Prairie Grove 7.00% T<strong>in</strong>ley Park (Cook) 9.00%<br />
Qu<strong>in</strong>cy 7.75% T<strong>in</strong>ley Park (Will) 7.00%<br />
Rantoul 8.50% Tuscola 6.75%<br />
Riverdale 9.00% University Park (Cook) 10.00%<br />
Riverwoods 7.50% University Park (Will) 8.00%<br />
Robb<strong>in</strong>s 9.00% Urbana 8.75%<br />
Rock Island 7.00% Valmeyer 6.50%<br />
Rockdale 7.00% Volo 8.00%<br />
Roll<strong>in</strong>g Meadows 10.00% Warrenville 8.50%<br />
Romeoville 8.50% Wash<strong>in</strong>gton 8.00%<br />
Rosemont 10.25% Watseka 7.00%<br />
Round Lake Beach 7.50% Waukegan 8.00%<br />
Sauget 7.60% West Chicago 7.75%<br />
Schaumburg (Cook) 10.00% West City 7.25%<br />
Schaumburg (DuPage) 8.00% West Dundee 8.50%<br />
Schiller Park 9.75% West Frankfort 7.25%<br />
Sesser 7.25% Westmont 7.75%<br />
Sherman 6.75% Wheaton 8.25%<br />
Skokie 10.00% Wheel<strong>in</strong>g (Cook) 10.00%<br />
South Barr<strong>in</strong>gton 10.00% Wheel<strong>in</strong>g (Lake 8.00%<br />
South Holland 9.50% Williamsville 6.25%<br />
Spr<strong>in</strong>gfield 8.00% Wilmette 9.25%<br />
Standard 6.25% W<strong>in</strong>netka 9.00%<br />
Stickney 10.00% Woodridge (Cook) 9.75%<br />
St. Charles (DuPage) 8.00% Woodridge (DuPage) 7.75%<br />
St. Charles (Kane) 8.00% Woodridge (Will) 7.75%<br />
Stone Park 10.25%<br />
Streamwood 10.00%<br />
Sycamore 7.50%<br />
Thornton 9.00%<br />
Source: Ill<strong>in</strong>ois Secretary of State<br />
-33-
Appendix 6. 2009 STATE SALES TAX<br />
RECEIPTS BY COUNTY<br />
County State <strong>Sales</strong> Tax % of Total Rank<br />
Adams $ 37,434,217 0.63% 23<br />
Alexander $ 1,068,109 0.02% 96<br />
Bond $ 4,346,807 0.07% 78<br />
Boone $ 15,550,608 0.26% 36<br />
Brown $ 1,463,014 0.02% 94<br />
Bureau $ 10,936,079 0.18% 50<br />
Calhoun $ 1,063,358 0.02% 98<br />
Carroll $ 6,065,363 0.10% 63<br />
Cass $ 4,423,356 0.07% 77<br />
Champaign $ 94,795,624 1.60% 13<br />
Christian $ 13,842,351 0.23% 39<br />
Clark $ 5,378,659 0.09% 70<br />
Clay $ 4,745,920 0.08% 75<br />
Cl<strong>in</strong>ton $ 15,127,380 0.25% 37<br />
Coles $ 26,182,110 0.44% 27<br />
Cook $ 2,131,006,758 35.87% 1<br />
Crawford $ 6,647,083 0.11% 58<br />
Cumberland $ 1,852,529 0.03% 91<br />
DeKalb $ 78,633,133 1.32% 15<br />
DeWitt $ 7,381,889 0.12% 57<br />
Douglas $ 8,772,141 0.15% 54<br />
DuPage $ 646,406,595 10.88% 2<br />
Edgar $ 6,003,635 0.10% 64<br />
Edwards $ 2,297,677 0.04% 89<br />
Eff<strong>in</strong>gham $ 28,994,762 0.49% 26<br />
Fayette $ 8,412,503 0.14% 56<br />
Ford $ 5,116,839 0.09% 71<br />
Frankl<strong>in</strong> $ 13,636,139 0.23% 41<br />
Fulton $ 10,789,601 0.18% 52<br />
Gallat<strong>in</strong> $ 991,506 0.02% 100<br />
Greene $ 2,936,294 0.05% 86<br />
Grundy $ 61,628,248 1.04% 18<br />
Hamilton $ 1,788,531 0.03% 92<br />
Hancock $ 4,327,786 0.07% 79<br />
Hard<strong>in</strong> $ 657,842 0.01% 101<br />
Henderson $ 1,345,113 0.02% 95<br />
Henry $ 19,340,918 0.33% 32<br />
Iroquois $ 13,362,662 0.22% 44<br />
Jackson $ 32,581,143 0.55% 24<br />
Jasper $ 3,023,137 0.05% 85<br />
Jefferson $ 23,185,573 0.39% 29<br />
Jersey $ 8,592,885 0.14% 55<br />
JoDaviess $ 10,880,554 0.18% 51<br />
Johnson $ 2,492,298 0.04% 87<br />
Kane $ 212,539,371 3.58% 5<br />
Kankakee $ 126,910,084 2.14% 7<br />
Kendall $ 44,021,590 0.74% 21<br />
Knox $ 22,871,935 0.38% 30<br />
Lake $ 400,057,346 6.73% 3<br />
LaSalle $ 58,561,283 0.99% 19<br />
Lawrence $ 4,324,315 0.07% 80<br />
Source: Ill<strong>in</strong>ois Deaprtment of Revenue<br />
-34-
Appendix 6. 2009 STATE SALES TAX<br />
RECEIPTS BY COUNTY<br />
County State <strong>Sales</strong> Tax % of Total Rank<br />
Lee $ 12,759,716 0.21% 46<br />
Liv<strong>in</strong>gston $ 16,743,607 0.28% 34<br />
Logan $ 10,137,920 0.17% 53<br />
Macon $ 56,555,054 0.95% 20<br />
Macoup<strong>in</strong> $ 13,141,340 0.22% 45<br />
Madison $ 119,142,631 2.01% 10<br />
Marion $ 13,392,946 0.23% 43<br />
Marshall $ 3,087,733 0.05% 84<br />
Mason $ 5,416,764 0.09% 69<br />
Massac $ 3,442,970 0.06% 83<br />
McDonough $ 12,466,134 0.21% 47<br />
McHenry $ 126,371,789 2.13% 8<br />
McLean $ 91,115,002 1.53% 14<br />
Menard $ 2,393,553 0.04% 88<br />
Mercer $ 3,646,433 0.06% 82<br />
Monroe $ 13,588,771 0.23% 42<br />
Montgomery $ 13,790,251 0.23% 40<br />
Morgan $ 15,588,394 0.26% 35<br />
Moultrie $ 4,603,796 0.08% 76<br />
Ogle $ 14,357,673 0.24% 38<br />
Peoria $ 100,847,021 1.70% 12<br />
Perry $ 5,905,119 0.10% 66<br />
Piatt $ 4,751,028 0.08% 74<br />
Pike $ 4,888,994 0.08% 73<br />
Pope $ 507,977 0.01% 102<br />
Pulaski $ 1,067,126 0.02% 97<br />
Putnam $ 6,593,763 0.11% 59<br />
Randolph $ 21,044,700 0.35% 31<br />
Richland $ 6,296,968 0.11% 60<br />
Rock Island $ 68,946,327 1.16% 17<br />
Sal<strong>in</strong>e $ 11,166,556 0.19% 49<br />
Sangamon $ 117,115,734 1.97% 11<br />
Schuyler $ 1,770,451 0.03% 93<br />
Scott $ 1,024,248 0.02% 99<br />
Shelby $ 5,103,631 0.09% 72<br />
St. Clair $ 124,949,800 2.10% 9<br />
Stark $ 1,863,728 0.03% 90<br />
Stephenson $ 18,580,888 0.31% 33<br />
Tazewell $ 69,821,406 1.18% 16<br />
Union $ 5,552,100 0.09% 67<br />
Vermilion $ 29,246,165 0.49% 25<br />
Wabash $ 3,965,716 0.07% 81<br />
Warren $ 5,532,220 0.09% 68<br />
Wash<strong>in</strong>gton $ 6,105,687 0.10% 61<br />
Wayne $ 6,092,582 0.10% 62<br />
White $ 5,995,253 0.10% 65<br />
Whiteside $ 23,853,694 0.40% 28<br />
Will $ 281,994,362 4.75% 4<br />
Williamson $ 40,915,959 0.69% 22<br />
W<strong>in</strong>nebago $ 141,986,261 2.39% 6<br />
Woodford $ 11,266,899 0.19% 48<br />
Source: Ill<strong>in</strong>ois Deaprtment of Revenue<br />
-35-
BACKGROUND<br />
The Commission on Government Forecast<strong>in</strong>g and Accountability (CGFA), a bipartisan, jo<strong>in</strong>t<br />
legislative commission, provides the <strong>General</strong> <strong>Assembly</strong> with <strong>in</strong>formation relevant to the<br />
Ill<strong>in</strong>ois economy, taxes and other sources of revenue and debt obligations of the State. The<br />
Commission's specific responsibilities <strong>in</strong>clude:<br />
1) Preparation of annual revenue estimates with periodic updates;<br />
2) Analysis of the fiscal impact of revenue bills;<br />
3) Preparation of "State Debt Impact Notes" on legislation which would<br />
appropriate bond funds or <strong>in</strong>crease bond authorization;<br />
4) Periodic assessment of capital facility plans;<br />
5) Annual estimates of public pension fund<strong>in</strong>g requirements and preparation of<br />
pension impact notes;<br />
6) Annual estimates of the liabilities of the State's group health <strong>in</strong>surance<br />
program and approval of contract renewals promulgated by the Department of<br />
Central Management Services;<br />
7) Adm<strong>in</strong>istration of the State Facility Closure Act.<br />
The Commission also has a mandate to report to the <strong>General</strong> <strong>Assembly</strong> ". . . on economic<br />
trends <strong>in</strong> relation to long-range plann<strong>in</strong>g and budget<strong>in</strong>g; and to study and make such<br />
recommendations as it deems appropriate on local and regional economic and fiscal policies<br />
and on federal fiscal policy as it may affect Ill<strong>in</strong>ois. . . ." This results <strong>in</strong> several reports on<br />
various economic issues throughout the year.<br />
The Commission publishes several reports each year. In addition to a Monthly Brief<strong>in</strong>g, the<br />
Commission publishes the "Revenue Estimate and Economic Outlook" which describes and<br />
projects economic conditions and their impact on State revenues. The “Bonded Indebtedness<br />
Report" exam<strong>in</strong>es the State's debt position as well as other issues directly related to<br />
conditions <strong>in</strong> the f<strong>in</strong>ancial markets. The “F<strong>in</strong>ancial Conditions of the Ill<strong>in</strong>ois Public<br />
Retirement Systems” provides an overview of the fund<strong>in</strong>g condition of the State’s retirement<br />
systems. Also published are an Annual Fiscal Year Budget Summary; Report on the<br />
Liabilities of the State Employees’ Group Insurance Program; and Report of the Cost and<br />
Sav<strong>in</strong>gs of the State Employees’ Early Retirement Incentive Program. The Commission also<br />
publishes each year special topic reports that have or could have an impact on the economic<br />
well be<strong>in</strong>g of Ill<strong>in</strong>ois. All reports are available on the Commission’s website.<br />
These reports are available from:<br />
Commission on Government Forecast<strong>in</strong>g and Accountability<br />
703 Stratton Office Build<strong>in</strong>g<br />
Spr<strong>in</strong>gfield, Ill<strong>in</strong>ois 62706<br />
(217) 782-5320 (217) 782-3513 (FAX)<br />
http://www.ilga.gov/commission/cgfa/cgfa_home.html