Modeling hemodynamic response for analysis of functional MRI time ...
Modeling hemodynamic response for analysis of functional MRI time ...
Modeling hemodynamic response for analysis of functional MRI time ...

Create successful ePaper yourself
Turn your PDF publications into a flip-book with our unique Google optimized e-Paper software.
Human Brain Mapping 6:283–300(1998) <br />
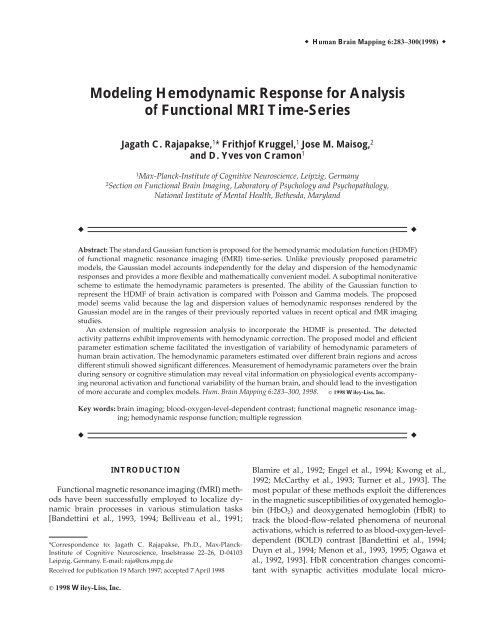
<strong>Modeling</strong> Hemodynamic Response <strong>for</strong> Analysis<br />
<strong>of</strong> Functional <strong>MRI</strong> Time-Series<br />
Jagath C. Rajapakse, 1 * Frithj<strong>of</strong> Kruggel, 1 Jose M. Maisog, 2<br />
and D. Yves von Cramon 1<br />
1<br />
Max-Planck-Institute <strong>of</strong> Cognitive Neuroscience, Leipzig, Germany<br />
2<br />
Section on Functional Brain Imaging, Laboratory <strong>of</strong> Psychology and Psychopathology,<br />
National Institute <strong>of</strong> Mental Health, Bethesda, Maryland<br />
<br />
<br />
Abstract: The standard Gaussian function is proposed <strong>for</strong> the <strong>hemodynamic</strong> modulation function (HDMF)<br />
<strong>of</strong> <strong>functional</strong> magnetic resonance imaging (f<strong>MRI</strong>) <strong>time</strong>-series. Unlike previously proposed parametric<br />
models, the Gaussian model accounts independently <strong>for</strong> the delay and dispersion <strong>of</strong> the <strong>hemodynamic</strong><br />
<strong>response</strong>s and provides a more flexible and mathematically convenient model. A suboptimal noniterative<br />
scheme to estimate the <strong>hemodynamic</strong> parameters is presented. The ability <strong>of</strong> the Gaussian function to<br />
represent the HDMF <strong>of</strong> brain activation is compared with Poisson and Gamma models. The proposed<br />
model seems valid because the lag and dispersion values <strong>of</strong> <strong>hemodynamic</strong> <strong>response</strong>s rendered by the<br />
Gaussian model are in the ranges <strong>of</strong> their previously reported values in recent optical and fMR imaging<br />
studies.<br />
An extension <strong>of</strong> multiple regression <strong>analysis</strong> to incorporate the HDMF is presented. The detected<br />
activity patterns exhibit improvements with <strong>hemodynamic</strong> correction. The proposed model and efficient<br />
parameter estimation scheme facilitated the investigation <strong>of</strong> variability <strong>of</strong> <strong>hemodynamic</strong> parameters <strong>of</strong><br />
human brain activation. The <strong>hemodynamic</strong> parameters estimated over different brain regions and across<br />
different stimuli showed significant differences. Measurement <strong>of</strong> <strong>hemodynamic</strong> parameters over the brain<br />
during sensory or cognitive stimulation may reveal vital in<strong>for</strong>mation on physiological events accompanying<br />
neuronal activation and <strong>functional</strong> variability <strong>of</strong> the human brain, and should lead to the investigation<br />
<strong>of</strong> more accurate and complex models. Hum. Brain Mapping 6:283–300, 1998. 1998 Wiley-Liss, Inc.<br />
Key words: brain imaging; blood-oxygen-level-dependent contrast; <strong>functional</strong> magnetic resonance imaging;<br />
<strong>hemodynamic</strong> <strong>response</strong> function; multiple regression<br />
<br />
<br />
INTRODUCTION<br />
Functional magnetic resonance imaging (f<strong>MRI</strong>) methods<br />
have been successfully employed to localize dynamic<br />
brain processes in various stimulation tasks<br />
[Bandettini et al., 1993, 1994; Belliveau et al., 1991;<br />
*Correspondence to: Jagath C. Rajapakse, Ph.D., Max-Planck-<br />
Institute <strong>of</strong> Cognitive Neuroscience, Inselstrasse 22–26, D-04103<br />
Leipzig, Germany. E-mail: raja@cns.mpg.de<br />
Received <strong>for</strong> publication 19 March 1997; accepted 7 April 1998<br />
Blamire et al., 1992; Engel et al., 1994; Kwong et al.,<br />
1992; McCarthy et al., 1993; Turner et al., 1993]. The<br />
most popular <strong>of</strong> these methods exploit the differences<br />
in the magnetic susceptibilities <strong>of</strong> oxygenated hemoglobin<br />
(HbO 2 ) and deoxygenated hemoglobin (HbR) to<br />
track the blood-flow-related phenomena <strong>of</strong> neuronal<br />
activations, which is referred to as blood-oxygen-leveldependent<br />
(BOLD) contrast [Bandettini et al., 1994;<br />
Duyn et al., 1994; Menon et al., 1993, 1995; Ogawa et<br />
al., 1992, 1993]. HbR concentration changes concomitant<br />
with synaptic activities modulate local micro-<br />
1998 Wiley-Liss, Inc.
Rajapakse et al. <br />
scopic B 0 field gradients in the vicinity <strong>of</strong> blood cells<br />
and veins [Bandettini et al., 1994], altering the signal<br />
intensities <strong>of</strong> T 2 - and T* 2 -weighted MR sequences.<br />
There are still controversies as to the vascular and<br />
tissue origin <strong>of</strong> the f<strong>MRI</strong> intensity changes observed at<br />
various field strengths. A transient shortening <strong>of</strong> T* 2<br />
within milliseconds after the onset <strong>of</strong> stimulus, which<br />
is attributed to the rapid increase in O 2 consumption<br />
upon onset <strong>of</strong> neural firing, has been reported [Ernst<br />
and Henning, 1994; Menon et al., 1994]. This is followed<br />
by an increase <strong>of</strong> f<strong>MRI</strong> signal due to slower<br />
<strong>hemodynamic</strong> <strong>response</strong>, which overcompensates the<br />
initial hypooxygenation and oversupplies the active<br />
region, leading to an increase in HbO 2 concentration<br />
with respect to the baseline value. In vivo optical<br />
imaging <strong>of</strong> intrinsic signals [Frostig et al., 1990] revealed<br />
a transient increase <strong>of</strong> blood flow within the<br />
first 1,000 msec <strong>of</strong> neuronal activity, and recent MR<br />
imaging experiments demonstrated a maximal rise in<br />
oxyhemoglobin, 5–8 sec after the onset <strong>of</strong> neuronal<br />
activity [Bandettini et al., 1993; Lee et al., 1995]. The<br />
above observations evince that the <strong>hemodynamic</strong> <strong>response</strong>s<br />
due to synaptic activities are delayed and<br />
dispersed in <strong>time</strong>, and transient at the onset and <strong>of</strong>fset<br />
<strong>of</strong> the stimulus condition.<br />
Our interpretation and application <strong>of</strong> f<strong>MRI</strong> techniques<br />
are based on the observation that the BOLD<br />
effect correlates with local energy consumption, which<br />
in turn correlates with neuronal firing [Raichle et al.,<br />
1976; Fox and Raiche, 1986; Fox et al., 1988; Jueptner<br />
and Weiller, 1995]. The mechanism <strong>of</strong> coupling <strong>of</strong><br />
neuronal activations to the vascular system is still<br />
unknown and produces significant blurring and delay<br />
to the original neuronal <strong>response</strong>s over <strong>time</strong>, indicating<br />
a low-pass filtering operation. Hemodynamic<br />
events have <strong>time</strong> scales <strong>of</strong> a few seconds, whereas<br />
neuronal events have <strong>time</strong> constants <strong>of</strong> milliseconds.<br />
Without knowing the proper mechanism <strong>of</strong> coupling<br />
between neuronal <strong>response</strong>s and <strong>hemodynamic</strong>s, exact<br />
modeling <strong>of</strong> the complex function <strong>of</strong> vascular<br />
coupling is currently impossible.<br />
Recent linear convolution models where vascular<br />
coupling is considered as a <strong>functional</strong> convolution<br />
provide a reasonable approximation [Friston et al.,<br />
1994; Villringer and Dirnagl, 1995; Lange and Zeger,<br />
1997; Cohen, 1997]. Following this linear approach, we<br />
will investigate the standard Gaussian function [Maisog<br />
et al., 1995] as the point spread function <strong>of</strong> vascular<br />
coupling <strong>of</strong> neuronal activations or the <strong>hemodynamic</strong><br />
modulating function (HDMF). HDMFs are characterized<br />
by two parameters, namely lag and dispersion, where<br />
lag represents the <strong>time</strong> delay between the <strong>hemodynamic</strong><br />
<strong>response</strong> and ensuing neural activations, and<br />
dispersion represents the temporal smoothness or<br />
autocorrelation <strong>of</strong> <strong>hemodynamic</strong> <strong>response</strong>. The Poisson<br />
function was the first to be proposed as the HDMF<br />
<strong>of</strong> the brain [Friston et al., 1994], and the first to render<br />
global values <strong>of</strong> lag and dispersion <strong>of</strong> 7.67 sec in a<br />
visual stimulation experiment. A disadvantage <strong>of</strong> the<br />
Poisson HDMF is its discrete nature and the representation<br />
<strong>of</strong> delay and dispersion with a single parameter.<br />
The Gamma function has been proposed recently<br />
[Lange and Zeger, 1997; Cohen, 1997]; however, the lag<br />
and dispersion provided by the Gamma function are<br />
not independent (see Appendix). Another major obstacle<br />
<strong>for</strong> the practical use <strong>of</strong> the Gamma model is the<br />
need <strong>for</strong> nonlinear iterative optimization schemes to<br />
estimate its parameters. Though the data-driven nonparametric<br />
approaches have shown their capabilities<br />
to handle transients, the Gamma function has been<br />
superior in modeling lag and dispersion aspects <strong>of</strong><br />
<strong>hemodynamic</strong> <strong>response</strong>s [Nielsen et al., 1997]. In what<br />
follows, our focus will be restricted only to parametric<br />
models <strong>of</strong> HDMF.<br />
The primary aim <strong>of</strong> this paper was to introduce the<br />
standard Gaussian model as a more natural, flexible,<br />
and mathematically tractable HDMF, especially when<br />
a space-variant and stimulation-dependent approach<br />
is taken. The Gaussian model is validated by comparing<br />
the lag and dispersion values reported in the<br />
optical intrinsic imaging literature and recent f<strong>MRI</strong><br />
experiments. The ability <strong>of</strong> the Gaussian model to<br />
represent HDMF <strong>of</strong> human brain activation will be<br />
compared with Poisson and Gamma models. In fact, at<br />
large lag and dispersion values, both Poisson and<br />
Gamma models approximate the Gaussian model. It<br />
will be shown how knowledge <strong>of</strong> the HDMF is utilized<br />
to improve the <strong>analysis</strong> <strong>of</strong> f<strong>MRI</strong> data with univariate<br />
multiple regression <strong>analysis</strong>.<br />
Frequency-domain observations <strong>of</strong> f<strong>MRI</strong> <strong>time</strong>-series<br />
in the motor cortex [Bandettini et al., 1993] and<br />
occipital cortex [Bullmore et al., 1996] have demonstrated<br />
peak neural activities at the first and second<br />
harmonics <strong>of</strong> the fundamental frequency <strong>of</strong> the stimulus<br />
conditions. Here we utilize all sufficiently powerful<br />
harmonics <strong>of</strong> the frequency <strong>of</strong> the <strong>time</strong>-series to devise<br />
a suboptimal and noniterative scheme to estimate the<br />
<strong>hemodynamic</strong> parameters. This scheme provides an<br />
efficient and fast method <strong>of</strong> evaluating <strong>hemodynamic</strong><br />
parameters at every brain voxel, facilitating the investigation<br />
<strong>of</strong> their variability over different brain regions<br />
and different stimuli. Previously, the same parameters<br />
were used <strong>for</strong> <strong>hemodynamic</strong> <strong>response</strong>s over the entire<br />
brain and <strong>for</strong> all types <strong>of</strong> stimulations [Friston et al.,<br />
1994b; Worsley and Friston, 1995], mainly because <strong>of</strong><br />
the lack <strong>of</strong> an efficient and pragmatic scheme to<br />
284
HDMF <strong>of</strong> f<strong>MRI</strong> Time-Series <br />
evaluate these parameters at every brain voxel. The<br />
f<strong>MRI</strong> experiments with visual-stimulation, worddiscrimination,<br />
and sentence-processing tasks demonstrate<br />
the need <strong>for</strong> a space-variant and stimulationdependent<br />
model <strong>for</strong> the HDMF <strong>of</strong> the brain.<br />
Knowledge <strong>of</strong> the <strong>hemodynamic</strong> parameters at a brain<br />
site may provide vital in<strong>for</strong>mation on local metabolic<br />
events, synaptic activities, and blood flow ensuing<br />
upon neuronal activation. For instance, the different<br />
delays in <strong>hemodynamic</strong> <strong>response</strong>s have been used to<br />
distinguish veins and capillaries in activated tissue<br />
areas and beyond [Singh et al., 1995; Lee et al., 1995].<br />
The idea <strong>of</strong> the HDMF is phenomenological and<br />
provides an approximation and approach to investigate<br />
vascular coupling <strong>of</strong> brain activation and associated<br />
neuronal events. A candidate <strong>for</strong> HDMF should<br />
have enough degrees <strong>of</strong> freedom to fit the actual<br />
<strong>hemodynamic</strong> <strong>response</strong>, and its parameters should<br />
highlight salient aspects <strong>of</strong> related biological events.<br />
We favor the Gaussian model because <strong>of</strong> its two<br />
degrees <strong>of</strong> freedom to independently represent lag and<br />
dispersion and its mathematical convenience. The<br />
reason reported <strong>for</strong> the selection <strong>of</strong> the Gamma family<br />
<strong>for</strong> HDMF was the existence <strong>of</strong> continuous Fourier<br />
trans<strong>for</strong>ms <strong>of</strong> their derivatives [Lange and Zeger,<br />
1997]. However, due to insufficient knowledge <strong>of</strong> the<br />
exact process <strong>of</strong> <strong>hemodynamic</strong> coupling and there<strong>for</strong>e<br />
the absence <strong>of</strong> a gold standard <strong>for</strong> human brain<br />
activation, it is not possible to accurately judge the<br />
superiority <strong>of</strong> a particular model. Nevertheless, these<br />
models have the potential to investigate and quantitate<br />
<strong>hemodynamic</strong> and neuronal events in <strong>response</strong> to<br />
sensory and cognitive stimulation [see Rajapakse and<br />
Kruggel, 1997].<br />
The organization <strong>of</strong> this paper is as follows. The next<br />
section introduces the Gaussian HDMF to model<br />
<strong>hemodynamic</strong> <strong>response</strong>s, and is followed by the frequency-domain<br />
<strong>analysis</strong> to estimate its parameters. We<br />
then explain the <strong>analysis</strong> <strong>of</strong> f<strong>MRI</strong> <strong>time</strong>-series and the<br />
adjustments necessary <strong>for</strong> the univariate multiple regression<br />
<strong>analysis</strong> to cope with the spatial and temporal<br />
correlations. Results <strong>of</strong> f<strong>MRI</strong> experiments follow. Finally,<br />
our approach, its limitations, and our results are<br />
discussed.<br />
A MODEL FOR CEREBRAL HEMODYNAMIC<br />
RESPONSE<br />
Intensities <strong>of</strong> f<strong>MRI</strong> image voxels obtained using a<br />
T* 2 -weighted sequence in a sensory or cognitive stimulation<br />
represent changes in local concentrations <strong>of</strong><br />
HbR, which are referred to as <strong>hemodynamic</strong> <strong>response</strong>s at<br />
brain voxels. To sustain neuronal firing in <strong>response</strong> to<br />
sensory or cognitive stimuli, metabolic events concur<br />
with increased local energy consumption. Due to the<br />
finite size <strong>of</strong> the image voxels, the <strong>hemodynamic</strong><br />
<strong>response</strong>s represent the average changes <strong>of</strong> HbR concentration<br />
within the space occupied by the corresponding<br />
brain voxels. By neuronal activity, we mean the<br />
energy consumption within a brain voxel which is<br />
physiologically coupled to local <strong>hemodynamic</strong>s. The<br />
image resolution in f<strong>MRI</strong> permits detecting <strong>hemodynamic</strong><br />
contributions from both capillaries and veins<br />
which carry deoxygenated blood in <strong>response</strong> to some<br />
neuronal activity [Fahm et al., 1994].<br />
If the <strong>hemodynamic</strong> <strong>response</strong> at a brain site at <strong>time</strong> t<br />
due to neuronal activity v(t) is denoted by w(t), the<br />
coupling between the neuronal activity and <strong>hemodynamic</strong><br />
<strong>response</strong> <strong>of</strong> our model is given by<br />
w(t) v(t) h(t) (t) (1)<br />
where denotes the gain <strong>of</strong> the vascular coupling, h(t)<br />
represents the HDMF, and (t) is the noise in the<br />
<strong>hemodynamic</strong> <strong>response</strong>. The convolution operation<br />
denoted by ‘‘’’ is referred to as <strong>hemodynamic</strong> modulation.<br />
A unit impulse <strong>of</strong> neuronal activity produces<br />
<strong>hemodynamic</strong> <strong>response</strong> equal to the gain . The<br />
<strong>hemodynamic</strong> noise is assumed to be random and<br />
(t) N(0, s h 2 ) where s h 2 is the variance <strong>of</strong> the noise.<br />
The major assumptions <strong>of</strong> our model <strong>for</strong> f<strong>MRI</strong><br />
<strong>time</strong>-series are that 1) the input stimulus pattern<br />
appears without distortion as the synaptic input to the<br />
brain voxel, and 2) the <strong>hemodynamic</strong> <strong>response</strong>s at<br />
brain voxels are completely recoded at the f<strong>MRI</strong> image<br />
voxels. That is, if y(t) denotes the <strong>time</strong>-series signal and<br />
x(t) the sensory or cognitive stimulation, we presume<br />
x(t) v(t) and y(t) w(t). By substituting these in Eq.<br />
(1), we obtain:<br />
y(t) x(t) h(t) (t) (2)<br />
where denotes the gain <strong>of</strong> the fMR imaging process<br />
and (t) represents the noise in the <strong>time</strong>-series with<br />
(t) N(0, s 2 ). The gain was introduced to separately<br />
account <strong>for</strong> the scaling <strong>of</strong> signals, and this necessitates<br />
the integral <strong>of</strong> the h(t) over <strong>time</strong> to be unity:<br />
<br />
h(t) dt 1. (3)<br />
<br />
This condition is mandatory <strong>for</strong> the probability<br />
density functions and, in fact, all three parametric<br />
models, Poisson, Gamma, and Gaussian, are widelyused<br />
density functions in the theory <strong>of</strong> probability.<br />
285
Rajapakse et al. <br />
Below, we define two parameters, namely, lag and<br />
dispersion <strong>of</strong> a given HDMF h(t):<br />
<br />
lag th(t) dt (4)<br />
<br />
dispersion <br />
<br />
(t lag) 2 h(t) dt. (5)<br />
The lag and dispersion are the first moment and<br />
second central moment <strong>of</strong> the HDMF, respectively. If<br />
the condition in Eq. (3) is not mandatory, these parameters<br />
need to be defined as their normalized moments.<br />
It can be easily shown that a function, when convolved<br />
with h(t), will be delayed with an amount equal to lag<br />
and smoothed with a scale equal to the square root <strong>of</strong><br />
dispersion. In <strong>hemodynamic</strong> <strong>response</strong>s, lag represents<br />
the delay in the excess blood supply to the activated<br />
sites following the onset <strong>of</strong> neuronal firing, which<br />
depends on blood pressure, blood regulation, etc., and<br />
dispersion represents the amount <strong>of</strong> autocorrelation<br />
present in the <strong>hemodynamic</strong> <strong>response</strong>s, which depends<br />
on the differential rates <strong>of</strong> neuronal firing and<br />
blood flow, and the events across the blood-brain<br />
barrier. Interestingly, the two parameters <strong>of</strong> mean and<br />
variance <strong>of</strong> the Gaussian function are equal to the lag<br />
and dispersion <strong>of</strong> the HDMF. Ironically, the lag and<br />
dispersion values provided by Poisson and Gamma<br />
models are related to each other (see Appendix).<br />
In our model, h(t) G(t; µ, ) where:<br />
G(t; µ, ) 1<br />
2 2 e (t µ) 2 /2 2 . (6)<br />
µ and 2 are the lag and dispersion, respectively. The<br />
space <strong>of</strong> the HDMFs <strong>of</strong>fered by the Gaussian model is<br />
5G(t; µ, ), µR, 2 R 6, where an element <strong>of</strong> this <strong>functional</strong><br />
space produces a Gaussian <strong>for</strong>m <strong>of</strong> autocorrelation<br />
in the neuronal <strong>response</strong>s. Figure 1 shows the<br />
plots <strong>of</strong> HDMFs <strong>of</strong> Poisson, Gamma, and Gaussian<br />
models and their frequency spectra (the parameters <strong>of</strong><br />
these plots correspond to the largest activated region<br />
in the representative slice in the visual-stimulation<br />
experiment shown in Figure 2.<br />
Our model defined by Eqs. (2) and (6) is linear, and<br />
the complexity <strong>of</strong> the convolution operation is conveniently<br />
handled by the frequency-domain <strong>analysis</strong>. By<br />
taking the Fourier trans<strong>for</strong>m <strong>of</strong> Eq. (2), one can write:<br />
Y() H()X() E() (7)<br />
where F() represents the Fourier trans<strong>for</strong>m <strong>of</strong> the<br />
function f(t). Except <strong>for</strong> the Poisson function, which<br />
Figure 1.<br />
Parametric models <strong>of</strong> <strong>hemodynamic</strong> modulation functions (HDMFs)<br />
a: Time-domain plots. b: Their frequency spectra. Parameters <strong>for</strong><br />
the plots were those obtained from the largest activation region in<br />
a representative slice in a visual-stimulation experiment; parameters<br />
<strong>for</strong> Poisson model 3.0 sec, <strong>for</strong> Gamma model 1 0.46<br />
and 2 0.15, and Gaussian model µ 4.50 s and 2 4.721 s 2 .<br />
does not have an analytical expression <strong>for</strong> the Fourier<br />
trans<strong>for</strong>m, the parameters <strong>of</strong> both Gamma and Gaussian<br />
models are estimated using the frequency-domain<br />
<strong>analysis</strong>.<br />
ESTIMATION OF HEMODYNAMIC<br />
PARAMETERS<br />
In the above <strong>analysis</strong>, the f<strong>MRI</strong> <strong>time</strong>-series and<br />
stimulus conditions were considered to be continuous-<br />
286
HDMF <strong>of</strong> f<strong>MRI</strong> Time-Series <br />
where F( l ) T1 i0 f T (t)e ill and l 2l/T. l represents<br />
the lth harmonic <strong>of</strong> the fundamental frequency<br />
l 2/T <strong>of</strong> the <strong>time</strong>-series. The f T (t) represents the<br />
average period <strong>of</strong> the periodic function f(t) with a<br />
period T. Because the experimental design determines<br />
X( l ), the set <strong>of</strong> equations defined by Eq. (8) can be<br />
utilized to determine the optimal parameters <strong>of</strong> the<br />
HDMF, h(t). The standard approach is to attempt to<br />
find the 2 -fitting or weighted least-square estimation<br />
which minimizes the cost function 2 [Press et al., 1994]:<br />
T1<br />
2 t1<br />
(Y( l )<br />
H( l )X( l ))*(Y( l ) H( l )X( l ))/ l<br />
2<br />
(9)<br />
Figure 2.<br />
Significant activations on a single axial slice obtained in a visualstimulation<br />
experiment using univariate multiple regression <strong>analysis</strong>.<br />
a: Without <strong>hemodynamic</strong> correction (z 3.0). b–d: With<br />
<strong>hemodynamic</strong> correction (z 3.5), using (b) Poisson, (c) Gamma,<br />
and (d) Gaussian models.<br />
<strong>time</strong> functions. Although the brain <strong>response</strong>s are continuous-<strong>time</strong><br />
functions, the f<strong>MRI</strong> <strong>time</strong>-series are discrete-<strong>time</strong><br />
functions defined over a finite duration <strong>of</strong><br />
<strong>time</strong>, and hence<strong>for</strong>th our <strong>analysis</strong> will be in discrete<strong>time</strong><br />
domain. We suppose that the input sensory and<br />
cognitive stimulations are periodic and presented at<br />
regular intervals synchronized to the f<strong>MRI</strong> image<br />
scans. Let us denote the scanning interval by and the<br />
ith stimulation sample in the <strong>time</strong>-series by y i . Then<br />
y i y(i) where i 1,2,...,n.Thetotal number <strong>of</strong><br />
samples in the <strong>time</strong>-series, or <strong>of</strong> scans in the f<strong>MRI</strong><br />
image, is n. Let us denote the input stimulation by<br />
vector x (x 1 ,x 2 ,...,x n ) T , and the <strong>time</strong>-series output<br />
by vector y (y 1 ,y 2 ,...,y n ) T .<br />
Consider an input stimulus having T samples per<br />
period with N stimulation cycles. For such a stimulus,<br />
the discrete Fourier trans<strong>for</strong>m (DFT) corresponding to<br />
Eq. (7) is given by<br />
Y( l ) H( l )X( l ) E( l ) l0...T1 (8)<br />
where * denotes the complex conjugate and 2<br />
l the<br />
variance <strong>of</strong> the noise at the lth harmonic frequency. The<br />
above cost function is usually a nonlinear function <strong>of</strong><br />
<strong>hemodynamic</strong> parameters, which requires the use <strong>of</strong><br />
iterative and numerical optimization techniques to<br />
determine optimal parameters [Press et al., 1994].<br />
Finding the 2 -fitting is further complicated by the<br />
involvement <strong>of</strong> the complex quantities in Eq. (9). A<br />
major pitfall <strong>of</strong> this iterative and rigorous approach is<br />
the instability caused by attempting to fit the <strong>time</strong>series<br />
<strong>of</strong> nonactivated voxels to the model, because the<br />
<strong>time</strong>-series parameters need to be evaluated be<strong>for</strong>e the<br />
identification <strong>of</strong> activated and nonactivated voxels. To<br />
avoid this problem, we propose a noniterative suboptimal<br />
scheme <strong>for</strong> the parameter estimation <strong>of</strong> the Gaussian<br />
HDMF in the rest <strong>of</strong> this section.<br />
Neglecting noise E( l ), substituting H( l ) <br />
e 2<br />
l <br />
2 /2<br />
e j l µ [Papoulis, 1991] <strong>for</strong> the Gaussian<br />
HDMF, and equating magnitudes <strong>of</strong> frequency <strong>response</strong>s<br />
<strong>of</strong> both sides <strong>of</strong> Eq. (8), one can obtain:<br />
2 log () l 2 l 2 L l (10)<br />
where L l log (0Y( l )0 2 /0X( l )0 2 ). By equating phase<br />
angles <strong>of</strong> both sides <strong>of</strong> Eq. (8), one can write:<br />
µ l l (11)<br />
where l tan 1 (Y( l )/X( l )) and l 0,1,...,T1.<br />
For each harmonic frequency l , we have two<br />
equations consisting <strong>of</strong> three parameters in the set<br />
5, µ, 2 6. Because we have a large number <strong>of</strong> equations<br />
to evaluate three parameters, optimal parameters are<br />
obtained using the least square estimations <strong>of</strong> Eqs. (10)<br />
and (11). To compensate <strong>for</strong> the errors and instability<br />
caused by our assumption on noise, only the harmon-<br />
287
Rajapakse et al. <br />
ics which have sufficient power in the input stimulus<br />
are considered <strong>for</strong> the least square estimation. If <br />
denotes the set <strong>of</strong> harmonics which have power above<br />
the minimum power P, 5l;0X( l )0 2 P,<br />
l 0,1,...,T16. Then, the following equations <strong>for</strong><br />
least-square estimation can be easily obtained:<br />
ˆ exp 5(S 3 S 4 S 5 S 2 )/2(S 1 S 4 S 2 S 2 )6 (12)<br />
µˆ S 6 /S 2 (13)<br />
ˆ 2 (S 3 S 2 S 5 S 2 )/(S 1 S 4 S 2 S 2 ) (14)<br />
where S 1 l ,S 2 l l 2 ,S 3 l L l 2 ,S 4 l l 4 ,<br />
S 5 l L l l 2 , and S 6 l 1 l . The estimates <strong>of</strong> the<br />
parameters 5ˆ,µˆ,ˆ26 do not necessarily minimize the<br />
2 cost function and provide a suboptimal solution in<br />
the least-squares sense. The noise difference is evaluated<br />
as the difference <strong>of</strong> the actual and modeled<br />
<strong>time</strong>-series.<br />
ANALYSIS OF F<strong>MRI</strong> TIME-SERIES<br />
In this section, we demonstrate how knowledge <strong>of</strong><br />
the HDMF facilitates the evaluation <strong>of</strong> significant<br />
activations in <strong>response</strong> to a sensory or cognitive<br />
experiment. Although the discussion is confined to the<br />
univariate multiple regression, it is applicable to other<br />
statistical tests used in f<strong>MRI</strong> <strong>analysis</strong> as well.<br />
With our notation, Eq. (2) in discrete-<strong>time</strong> domain<br />
becomes:<br />
n<br />
y i l1<br />
h i(il) x l i i1,2,...,n (15)<br />
where h ij (1/2 2 )e (ijµ)2 /2 2 and i is the noise<br />
<strong>for</strong> the ith sample <strong>of</strong> the <strong>time</strong>-series. Using matrix<br />
notation, the above equation may be succinctly written<br />
as<br />
y Hx (16)<br />
where H 5h ij 6 nxn is referred to as the modulation matrix<br />
and ( 1 , 2 ,..., n ) T .<br />
The above equation <strong>for</strong> a single stimulus condition<br />
may be extended to experiments where a number <strong>of</strong><br />
stimuli are simultaneously involved, assuming that<br />
their effects in producing the <strong>time</strong>-series are linear.<br />
For an experiment with a design matrix [x 1 ,x 2 ,...<br />
x q , x q1 ,...,x qp ], where x 1 , x 2 ,...,x q represent q<br />
stimulus conditions and x q1 ,x q2 ,..., x qp represent<br />
p dummies [Friston et al., 1995a], Eq. (16) can be<br />
written as a standard regression equation:<br />
y X (17)<br />
where X [H 1 x 1 ,H 2 x 2 ,...,H q x q ,x q1 ,...,x qp ] represents<br />
the set <strong>of</strong> <strong>hemodynamic</strong>ally modulated sensory<br />
stimuli, and ( 1 , 2 ,..., qp ) T represents the<br />
regression coefficients relating each stimulus condition<br />
to the <strong>time</strong>-series. H k denotes the modulation matrix<br />
<strong>for</strong> the kth stimulus condition x k . Note that the dummy<br />
covariates were not modulated in the modified design<br />
matrix and that the gain <strong>of</strong> the model <strong>for</strong> each stimulus<br />
is now represented by the regression coefficients.<br />
In order to find the values <strong>of</strong> regression coefficients,<br />
it is not possible to use inverse matrices <strong>for</strong> demodulation<br />
because <strong>of</strong> their ill-conditioned nature and sensitivity<br />
to the choice <strong>of</strong> HDMF. There<strong>for</strong>e, a different<br />
approach is taken here by modulating only the stimulus<br />
condition x k when evaluating <strong>for</strong> the effect <strong>of</strong> the<br />
kth stimulus and finding the significance <strong>of</strong> the particular<br />
regression coefficient in predicting the <strong>time</strong>-series<br />
data, i.e., in order to check the effect <strong>of</strong> the stimulus<br />
condition x k , Eq. (17) is written as<br />
y X k (18)<br />
where X k [x 1 ...x k1 H k x k x k1 ...x pq ] and k q. In<br />
other words, the stimulation condition x k is subjected<br />
to the same modulation as experienced by the <strong>time</strong>series,<br />
which is referred to as the <strong>hemodynamic</strong> correction<br />
<strong>of</strong> the <strong>time</strong>-series. Here the <strong>hemodynamic</strong> correction<br />
implies shifting <strong>of</strong> the input stimulus by a value<br />
equal to the lag and subjecting to temporal smoothing<br />
with a scale given by the square root <strong>of</strong> dispersion.<br />
Using Eq. (18), the significance <strong>of</strong> each condition in the<br />
design matrix in producing the <strong>time</strong>-series y is evaluated.<br />
To test a single k <strong>for</strong> significance or the hypothesis<br />
H 0 : k 0, we arrange k last in such that ( k , k )<br />
and consider a reduced model without the condition<br />
x k , i.e.,<br />
y X* k k k (19)<br />
where X* k [x 1 ...x k1 x k1 ...x pq ] is the design<br />
matrix and k is the noise vector <strong>for</strong> the reduced model.<br />
The following F-statistic measures the significance <strong>of</strong><br />
the kth stimulus condition <strong>of</strong> producing y [Rencher,<br />
1995]:<br />
(ˆ T X T k y ˆk<br />
T X* kT y)<br />
F k d k<br />
(y T y ˆT X T k y)<br />
(20)<br />
288
HDMF <strong>of</strong> f<strong>MRI</strong> Time-Series <br />
where d k denotes degrees <strong>of</strong> freedom and ˆ <br />
(X k T X k ) 1 X k T y is the least-square estimate <strong>of</strong> the regression<br />
coefficients <strong>of</strong> the complete model. The estimate<br />
<strong>for</strong> the reduced model ˆ k is similarly obtained.<br />
The data vector y in Eq. (17) represents a <strong>time</strong>-series<br />
which is smooth or autocorrelated in <strong>time</strong>, violating a<br />
major assumption <strong>of</strong> independence among data<br />
samples in regression <strong>analysis</strong>. The effective degrees <strong>of</strong><br />
freedom associated with the correlated data are smaller<br />
than those associated with uncorrelated data, and the<br />
presence <strong>of</strong> autocorrelations increases the probability<br />
<strong>of</strong> spurious or high correlation coefficients by chance.<br />
The correlations among data points are compensated<br />
<strong>for</strong> by adjusting the degrees <strong>of</strong> freedom <strong>of</strong> the data. We<br />
use an approximate result <strong>for</strong> the effective degrees <strong>of</strong><br />
freedom derived considering the error terms in the<br />
frequency-domain [Friston et al., 1995b]. If g is the<br />
error between the actual and estimated values <strong>of</strong> the<br />
<strong>time</strong>-series, then<br />
g y X k ˆ . (21)<br />
If G( i ) is the spectral density <strong>of</strong> the process g obtained<br />
using a discrete Fourier trans<strong>for</strong>m when i 2i/<br />
(n rank(X k )), the approximate value <strong>for</strong> the effective<br />
degrees <strong>of</strong> freedom d k is given by<br />
d k ( i G( i )) 2<br />
i G 2 ( i ) . (22)<br />
Using Eq. (20), an F-statistical score indicating the<br />
significance <strong>of</strong> a stimulus in predicting the <strong>time</strong>-series is<br />
computed. An f<strong>MRI</strong> image consists <strong>of</strong> a set <strong>of</strong> <strong>time</strong>-series<br />
taken at contiguous spatial sites. If y j represents the<br />
<strong>time</strong>-series at the jth spatial location or voxel site, the<br />
f<strong>MRI</strong> image is given by the matrix Y [y 1 ,y 2 ,...,y m ]<br />
where m denotes the total number <strong>of</strong> voxel sites. By<br />
following the above <strong>analysis</strong>, <strong>for</strong> each <strong>time</strong>-series y j<br />
and stimulus condition x k ,anF-statistical score F jk may<br />
be computed. The set f k 5F k1 , F k2 ...F km 6 represents<br />
an F-statistical map <strong>for</strong> the kth stimulus condition, and<br />
is obtained using all the <strong>time</strong>-series in the f<strong>MRI</strong> image.<br />
Defining a threshold <strong>for</strong> the statistical map to detect<br />
significant activations at a given probability level or<br />
P-value is not straight<strong>for</strong>ward, because corrections <strong>for</strong><br />
multiple independent statistical comparisons, and adjustments<br />
<strong>for</strong> spatial correlations due to correlated<br />
neural activities, need to be made. Because the activations<br />
appear as contiguous groups <strong>of</strong> image elements<br />
or make clusters <strong>of</strong> activated sites, this threshold has<br />
been related to the size <strong>of</strong> the activated regions. The<br />
minimum size <strong>of</strong> the regions <strong>of</strong> significant activations<br />
above a given threshold <strong>for</strong> z-statistical maps has been<br />
derived using the theory <strong>of</strong> Gaussian random fields<br />
[Friston et al., 1994a]. F-statistical maps obtained in the<br />
<strong>analysis</strong> are trans<strong>for</strong>med to z-statistical maps using the<br />
trans<strong>for</strong>mation (F) (z) where (·) is the<br />
F-distribution function and (·) is the cumulative<br />
standard Gaussian function. With an experimentally<br />
determined threshold and a predetermined P-value,<br />
significantly activated regions from z-statistical maps<br />
<strong>for</strong> each stimulus condition are obtained. Subsequently,<br />
the significant activations are color-coded and<br />
registered onto the corresponding anatomical scans <strong>for</strong><br />
display. The routines <strong>for</strong> processing f<strong>MRI</strong> images using<br />
the techniques described in this section were written in<br />
C and incorporated to the BRIAN image <strong>analysis</strong><br />
system [Kruggel and Lohmann, 1996].<br />
EXPERIMENTS AND RESULTS<br />
FMR images presented in this section were obtained<br />
on a 3.0 Tesla Medspec 30/100 scanner (Bruker Medizintechnik<br />
GmbH, Ettlingen, Germany) at the <strong>MRI</strong><br />
Center <strong>of</strong> the Max-Planck-Institute <strong>of</strong> Cognitive Neuroscience.<br />
Images were obtained in visual-stimulation<br />
and word-recognition experiments using a FLASH<br />
protocol, and sentence-processing experiments were<br />
per<strong>for</strong>med with an echo-planar imaging (EPI) protocol.<br />
All experiments were per<strong>for</strong>med by Germanspeaking<br />
normal volunteers between age 20–30 years.<br />
The particular experiments were selected because <strong>of</strong><br />
their pertinence to the ongoing research at the institute.<br />
In FLASH experiments, each slice was obtained<br />
separately by repeated application <strong>of</strong> the stimulation,<br />
while all the slices in the EPI experiments were<br />
obtained during a single presentation <strong>of</strong> the stimulation.<br />
Experiments with FLASH protocols<br />
While a subject was per<strong>for</strong>ming the experiment, 3–6<br />
two-dimensional T* 2 -weighted images, each with 64<br />
scans, were acquired using a gradient-echo FLASH<br />
sequence (TR 80.5 msec; TE 40 msec; matrix<br />
128 64; The image matrices were zero-filled to<br />
obtain 128 128 images with a spatial resolution <strong>of</strong><br />
1.953 1.953 mm; slice thickness 5-mm and 2-mm<br />
gap). The corresponding two-dimensional anatomical<br />
slices were also acquired with a T 1 -weighted IR RARE<br />
sequence (TI 900 msec; TR 40 msec; TE 3,900<br />
msec; matrix 512 512) in the same experiment<br />
session. In all experiments, ON and OFF stimuli were<br />
presented at a rate <strong>of</strong> 5.162 sec/sample. Each stimulation<br />
period had four successive stimulation ON states<br />
followed by four stimulation OFF states. The stimula-<br />
289
Rajapakse et al. <br />
TABLE I. Characteristics <strong>of</strong> largest activated region on a<br />
selected slice in a visual-stimulation experiment obtained<br />
without <strong>hemodynamic</strong> correction (regression) and with<br />
<strong>hemodynamic</strong> correction using Poisson, Gamma, and<br />
Gaussian HDMFs*<br />
Model Regression Poisson Gamma Gaussian<br />
Location (68, 92) (67, 93) (67, 93) (67, 94)<br />
Size 48.00 44.00 39.00 43.00<br />
z-score 3.46 4.45 4.34 5.00<br />
Gain 0.03 0.05 0.05 0.05<br />
Lag (s) 3.35 3.18 4.50<br />
Dispersion (s 2 ) 3.35 20.87 4.72<br />
Square error 0.05 0.05 0.06 0.05<br />
(S/N) z-map (dB) 16.68 18.23 17.92 19.53<br />
* Location is given relative to the left topmost point <strong>of</strong> the image, size<br />
is given as number <strong>of</strong> voxels, and square error is the sum <strong>of</strong> the<br />
square error computed between the actual <strong>time</strong>-series and the fitted<br />
<strong>time</strong> courses by the model.<br />
tions were repeated <strong>for</strong> eight cycles (total experiment<br />
<strong>time</strong> 5.5 min), and experiments were carried out at<br />
different sessions with different subjects.<br />
Visual-stimulation task<br />
An 8-Hz alternating checkerboard pattern with a<br />
central fixation point was projected on a LCD system,<br />
and subjects were asked to fixate on the point during<br />
stimulations. Images were acquired at three axial<br />
levels <strong>of</strong> the brain at the visual cortex.<br />
Word-discrimination task<br />
During the stimulation period, subjects heard a random<br />
series <strong>of</strong> words and pronounceable nonwords (1.5 words<br />
per sec, 1:6 nonwords vs. words). Subjects were asked<br />
to count the nonwords per stimulation period (generally<br />
6–7). Images at three sagittal levels were taken<br />
through the center <strong>of</strong> the temporal lobe on each side.<br />
Experiments with EPI protocols<br />
Four T* 2 -weighted axial images (image matrix<br />
128 64; slice thickness 5 mm; gap 2 mm; echo<br />
<strong>time</strong> TE 40 msec; TR 2.0 sec; flip angle 40°)<br />
were acquired using a gradient echo, EPI protocol. The<br />
corresponding anatomical images were acquired as in<br />
FLASH experiments in the same session. Each stimulus<br />
period had three successive stimulus ON states and<br />
nine stimulus OFF states during stimulation presentation<br />
at 2 sec sample. An 18 sec intertrial interval<br />
completed a 24-sec run, <strong>for</strong> a total <strong>of</strong> 76 runs.<br />
Sentence-processing task<br />
Single sentences which were correct or syntactically<br />
violated were binaurally presented to the subjects in a<br />
pseudorandomized order. Subjects were requested to<br />
respond by pressing a left button <strong>for</strong> a correct or a right<br />
button <strong>for</strong> an incorrect sentence.<br />
Data processing<br />
The f<strong>MRI</strong> scans were corrected <strong>for</strong> possible subject<br />
movements by estimating the movement parameters<br />
by comparing each scan in the fMR image to a<br />
reference scan and realigning the scans using the parameters<br />
[Friston et al., 1996]. Movement-corrected images<br />
were filtered using a Gaussian filter with a standard<br />
deviation <strong>of</strong> 1 pixel and a spatial extent <strong>of</strong> 7 pixels<br />
in diameter (i.e., FWHM <strong>of</strong> 4.47 mm). The filtered images<br />
were analyzed using univariate multiple regression<br />
with <strong>hemodynamic</strong> correction, assuming a stimulationdependent<br />
and space-variant Gaussian HDMF. The<br />
drift in the image intensities <strong>of</strong> the scans was considered<br />
as a linear dummy covariate. Significant activations<br />
were detected by thresholding the z-statistical maps<br />
and testing <strong>for</strong> significant regions at P 0.05. The detected<br />
activities <strong>for</strong> each stimulus were mapped onto the corresponding<br />
anatomical slice <strong>for</strong> visual display. For EPI<br />
protocols, the lag values were corrected <strong>for</strong> the <strong>time</strong> delays<br />
between the stimulus presentation and the actual scanning<br />
<strong>of</strong> the slices [Van de Moortele et al., 1997], which were 0.52<br />
sec, 1.11 sec, 0.67 sec, and 1.26 sec from the first to the<br />
fourth slice, respectively.<br />
Comparison <strong>of</strong> different HDMFs<br />
Twenty FLASH data sets in our database were<br />
analyzed without making any adjustment <strong>for</strong> the lag<br />
and dispersion <strong>of</strong> the <strong>hemodynamic</strong> <strong>response</strong>s. Then<br />
they were analyzed after applying the <strong>hemodynamic</strong><br />
correction separately with Poisson, Gamma, and Gaussian<br />
HDMFs. The parameters <strong>of</strong> the Poisson model<br />
were obtained using the modified-FJT method [Sorensen<br />
and Wang, 1997], and the parameters <strong>of</strong> the<br />
Gamma model were obtained by 2 -fitting using the<br />
Levenberg-Marquardt method [Press et al., 1994]. The<br />
one-pass algorithm presented above was used to determine<br />
the Gaussian model parameters.<br />
For all the data sets compared, the adjustments <strong>for</strong><br />
<strong>hemodynamic</strong> <strong>response</strong> resulted in visually better<br />
activations in the predicted areas <strong>of</strong> the brain with less<br />
spurious noise. The detected significant activations <strong>of</strong><br />
a representative slice in a visual-stimulation experiment<br />
are shown in Figure 2, which is color-coded<br />
290
HDMF <strong>of</strong> f<strong>MRI</strong> Time-Series <br />
Figure 3.<br />
Model fits obtained from <strong>time</strong>-series <strong>for</strong> the largest activation region in a visual-stimulation<br />
experiment using FLASH protocol at a sampling rate <strong>of</strong> 5.126 sec sample. a: Without <strong>hemodynamic</strong><br />
correction. b–d: With <strong>hemodynamic</strong> correction, using (b) Poisson, (c) Gamma, and (d) Gaussian models.<br />
according to the z-statistic. Significant activations were<br />
detected by thresholding z-maps at a threshold <strong>of</strong> 3.0<br />
<strong>for</strong> regression <strong>analysis</strong> without <strong>hemodynamic</strong> correction,<br />
and 3.5 <strong>for</strong> the <strong>hemodynamic</strong>ally corrected <strong>analysis</strong>.<br />
Note that the <strong>hemodynamic</strong> correction reflected an<br />
increase in the average z-scores <strong>of</strong> the activated regions<br />
without generating spurious activities. The characteristics<br />
obtained by averaging over all the voxels in the<br />
largest activated region are shown in Table I. To<br />
compare the improvement <strong>of</strong> z-maps with the introduction<br />
<strong>of</strong> <strong>hemodynamic</strong> correction, the S/N ratio <strong>for</strong> the<br />
z-maps in dB is defined as follows:<br />
(S/N) z-map 10 log<br />
5<br />
2<br />
z noise<br />
z activations<br />
2 6<br />
(23)<br />
2<br />
where z noise is the variance <strong>of</strong> the z-statistics <strong>of</strong> the<br />
nonactivated voxels, which is presumed to be superimposed<br />
on the average z-score <strong>of</strong> the activated voxels<br />
z activations . Theoretically, the <strong>hemodynamic</strong> correction<br />
increases the z-scores <strong>of</strong> the activated voxels, but its<br />
291
Rajapakse et al. <br />
Figure 4.<br />
Parameter maps computed over a representative slice obtained during a visual-stimulation<br />
experiment. Maps <strong>of</strong> (a) gain, (b) lag, (c) dispersion, and (d) noise where the intensity at a voxel<br />
represents values <strong>of</strong> the parameters.<br />
292
HDMF <strong>of</strong> f<strong>MRI</strong> Time-Series <br />
TABLE II. Comparison <strong>of</strong> <strong>hemodynamic</strong> parameters <strong>of</strong> the largest activated region<br />
and nonactivated region in a visual-stimulation experiment, using the t-test*<br />
Region<br />
Gain Lag (s) Dispersion (s 2 ) Noise<br />
Mean SD Mean SD Mean SD Mean SD<br />
Activated region 0.053 0.024 4.504 0.915 4.721 2.628 0.050 0.032<br />
Nonactivated region 0.000 0.004 0.577 2.308 0.471 2.356 0.013 0.031<br />
Significance (P-value) P 0.001 P 0.001 P 0.001 P 0.169<br />
* Significance <strong>of</strong> the comarison in the tests is given as P-values.<br />
effectiveness depends on its ability to avoid false<br />
alarms in the correction process. Hence, the above S/N<br />
ratio gives a quantitative measure <strong>for</strong> the improvement<br />
achieved in the <strong>hemodynamic</strong> correction.<br />
Figure 3 shows the f<strong>MRI</strong> <strong>time</strong> courses obtained by<br />
averaging the <strong>time</strong>-series over the voxels <strong>of</strong> the largest<br />
activation blob and the fitted model wave<strong>for</strong>ms using<br />
each HDMF. Note the drift in our data, which was<br />
corrected by using a linear dummy variable in the<br />
regression <strong>analysis</strong>. The actual <strong>time</strong> courses seen in the<br />
plots <strong>for</strong> the different models are different because the<br />
sizes <strong>of</strong> the detected regions slightly differ in some<br />
cases. Poisson and Gamma functions gave similar fits,<br />
while Gaussian functions gave a symmetrical fit at the<br />
rise and fall <strong>of</strong> stimulations.<br />
Maps <strong>of</strong> gain, lag, dispersion, and noise values<br />
obtained in the particular slice in the visual-stimulation<br />
experiment are shown in Figure 4, where the<br />
intensities <strong>of</strong> the voxels represent the values <strong>of</strong> each<br />
parameter. The parameters <strong>of</strong> the largest region and<br />
the nonactivated voxels with their standard deviations<br />
are given in Table II. (The <strong>hemodynamic</strong> parameters<br />
<strong>for</strong> nonactivated voxels do not have any meaning, but<br />
result as a by-product <strong>of</strong> the <strong>analysis</strong>.) The differences<br />
<strong>of</strong> the <strong>hemodynamic</strong> parameters measured over the<br />
activated and nonactivated voxels were compared<br />
using t-tests. The significances or P-values <strong>of</strong> their<br />
differences <strong>of</strong> lag and dispersion at the two sites are<br />
also shown.<br />
Data obtained in six EPI experiments were analyzed<br />
similarly as above, and improvements in the activity<br />
patterns were seen with <strong>hemodynamic</strong> correction <strong>for</strong><br />
all data sets. The results <strong>of</strong> <strong>hemodynamic</strong> correction<br />
applied to all four slices <strong>of</strong> a representative experiment<br />
are shown in Figure 5. Note the improvement <strong>of</strong> the<br />
activations or z-maps with <strong>hemodynamic</strong> correction.<br />
Table III shows the characteristics <strong>of</strong> the largest activated<br />
region with and without <strong>hemodynamic</strong> correction<br />
and using multiple regression <strong>analysis</strong> <strong>for</strong> the<br />
third slice <strong>of</strong> the sequence.<br />
Space-dependence <strong>of</strong> <strong>hemodynamic</strong> parameters<br />
In order to find the dependence <strong>of</strong> <strong>hemodynamic</strong><br />
parameters on various brain sites during a sensory<br />
simulation, the images taken at six sagittal levels<br />
(W 1 ...W 6 ) in a representative word-discrimination<br />
experiment were analyzed. Figure 6 shows the detected<br />
activations <strong>of</strong> the corresponding slices with and<br />
without <strong>hemodynamic</strong> correction, assuming a Gaussian<br />
HDMF. The largest activation regions <strong>of</strong> six slices<br />
were compared among one another with t-tests <strong>for</strong> any<br />
discrepancies in lag and dispersion values. Significance<br />
<strong>of</strong> the differences or P-values is shown in Table<br />
IV. As seen in Table IV, the lag and dispersion values<br />
computed over some regions showed significant differences,<br />
while others were statistically similar.<br />
Intersubject variability <strong>of</strong> <strong>hemodynamic</strong><br />
parameters<br />
To investigate the intersubject variability <strong>of</strong> the<br />
<strong>hemodynamic</strong> parameters, three data sets (V 1 ,V 2 , and<br />
V 3 ) at the same axial level, obtained while 3 different<br />
subjects separately per<strong>for</strong>med the same visual-stimulation<br />
task, were analyzed. In all 3 cases, activations<br />
appear in the visual cortex, as seen in Figure 7, both<br />
with and without <strong>hemodynamic</strong> correction. The <strong>hemodynamic</strong><br />
parameters <strong>of</strong> the largest activated regions <strong>of</strong><br />
different subjects were compared using t-tests and<br />
their significances are shown in Table V. The lag values<br />
were significantly different between V 1 and V 3 and<br />
between V 2 and V 3 , whereas the dispersions were<br />
statistically different between V 1 and V 2 and between<br />
V 1 and V 3 .<br />
DISCUSSION<br />
In the absence <strong>of</strong> proper understanding <strong>of</strong> the<br />
coupling between cerebral neuronal activity and associated<br />
<strong>hemodynamic</strong>s, the linear convolution models<br />
293
Figure 5.<br />
Significant activations detected in a sentence-processing task imaged with an EPI protocol (sampling<br />
rate 2 sec/sample). Activities obtained (a) without <strong>hemodynamic</strong> correction (z 3.5) and with<br />
<strong>hemodynamic</strong> correction (z 4.0) using (b) Poisson, (c) Gamma, and (d) Gaussian models.
HDMF <strong>of</strong> f<strong>MRI</strong> Time-Series <br />
TABLE III. Characteristics <strong>of</strong> largest activated region on<br />
a selected slice in a sentence-processing task obtained<br />
without <strong>hemodynamic</strong> correction (regression) and with<br />
<strong>hemodynamic</strong> correction using Poisson, Gamma, and<br />
Gaussian models*<br />
Slice no. Regression Poisson Gamma Gaussian<br />
Location (88, 38) (87, 39) (88, 39) (87, 39)<br />
Size 58.00 88.00 45.00 41.00<br />
z-score 5.72 7.38 5.51 5.80<br />
Gain 0.01 0.21 0.01 0.01<br />
Lag (s) 20.65 0.05 3.81<br />
Dispersion (s 2 ) 20.65 0.27 1.58<br />
Square error 0.27 0.33 0.28 0.27<br />
(S/N) z-map (dB) 18.56 20.68 18.85 19.36<br />
* Location is given relative to the left topmost point <strong>of</strong> the image, the<br />
size is given by the number <strong>of</strong> voxels, and the square error is the sum<br />
<strong>of</strong> error squares computed between the actual <strong>time</strong>-series and the<br />
fitted <strong>time</strong> course by the model.<br />
present an approximate paradigm to study <strong>hemodynamic</strong><br />
<strong>response</strong>s <strong>of</strong> human brain activation. The Gaussian<br />
HDMF presents a reasonable and flexible model to<br />
represent the delay and temporal correlations seen in<br />
f<strong>MRI</strong> <strong>time</strong>-series, and seems valid because the <strong>hemodynamic</strong><br />
parameters determined in our experiments are<br />
closer to those previously reported [Frostig et al., 1990;<br />
Bandettini et al., 1993; Friston et al., 1994b]. Both<br />
Gamma and Poisson models are unable to account<br />
independently <strong>for</strong> the lag and dispersion <strong>of</strong> f<strong>MRI</strong><br />
<strong>time</strong>-series because these parameters are linearly related.<br />
Our experiments with visual-stimulation, worddiscrimination,<br />
and sentence-processing tasks demonstrated<br />
no clear relationship between the values <strong>of</strong> lag<br />
and dispersion <strong>of</strong> the <strong>hemodynamic</strong> <strong>response</strong>s <strong>of</strong> the<br />
activated regions. The two-parameter Gaussian model<br />
<strong>of</strong>fers more flexibility and mathematical convenience<br />
to analyze <strong>hemodynamic</strong> <strong>response</strong>s in the brain than<br />
the previously proposed Poisson and Gamma models.<br />
However, the superiority <strong>of</strong> any model cannot be<br />
definitively concluded with our study, and comparison<br />
<strong>of</strong> different models is only possible with chi-by-see<br />
approach or by looking at the activities produced by<br />
different models in the same experiment.<br />
The different models provide different temporal<br />
structures, and hence the values <strong>of</strong> <strong>hemodynamic</strong><br />
parameters given by different models are different. A<br />
major disadvantage <strong>of</strong> the Gaussian function <strong>of</strong> HDMF<br />
is its symmetrical and infinite tails, precluding it from<br />
modeling asymmetries seen in the <strong>hemodynamic</strong> <strong>response</strong><br />
and its reliance on past <strong>hemodynamic</strong> activities.<br />
Unlike the Gaussian model, the Poisson and<br />
Gamma models achieve the shape <strong>of</strong> HDMF by compromising<br />
between lag and dispersion values. The<br />
shapes <strong>of</strong> the fitted <strong>time</strong>-series using Poisson and<br />
Gamma functions are similar, whereas the Gaussian<br />
provides symmetric patterns at the onset and <strong>of</strong>fset <strong>of</strong><br />
the stimulus presentation. However, the asymmetry<br />
seen at the onset and <strong>of</strong>fset <strong>of</strong> stimuli may be attributed<br />
to the different rise- and fall-<strong>time</strong>s <strong>of</strong> neuronal activations<br />
[Rajapakse and Kruggel, 1997]. In the present<br />
study, we do not address transient aspects such as<br />
rise-<strong>time</strong>, fall-<strong>time</strong>, undershoot, and overshoot present<br />
in the f<strong>MRI</strong>, because they are initiated at the neuronal<br />
level and then modulated with HDMF. Nevertheless,<br />
these events can alter the frequency <strong>response</strong>s <strong>of</strong><br />
<strong>time</strong>-series. This is a major limitation <strong>of</strong> all linear<br />
convolution models <strong>of</strong> <strong>hemodynamic</strong> <strong>response</strong>. Our<br />
experience with parametric models suggests that the<br />
HDMF behaves more likely as a Gamma function <strong>for</strong> a<br />
brief stimulus and as a Gaussian function <strong>for</strong> a prolonged<br />
stimulus. This may be because the negative tail<br />
<strong>of</strong> the Gaussian function allows considerable error <strong>for</strong><br />
brief stimuli. However, there is no evidence to support<br />
our conjecture.<br />
An advantage <strong>of</strong> the frequency-domain <strong>analysis</strong> is<br />
its ability to account <strong>for</strong> the noise in both <strong>time</strong>- and<br />
frequency-domains. Because frequency <strong>response</strong>s are<br />
computed on an average <strong>time</strong>-series cycle, the random<br />
noise and other variations <strong>of</strong> intensity that appear over<br />
the duration <strong>of</strong> the experiment are compensated <strong>for</strong>.<br />
Because only the <strong>response</strong>s at the harmonics <strong>of</strong> the<br />
fundamental frequency <strong>of</strong> <strong>time</strong>-series are considered<br />
in parameter estimation, frequency <strong>of</strong> stimulations can<br />
be designed to discount the artifactual changes contributed<br />
by other physiological processes such as heartbeat<br />
or pulsations in the cerebro-spinal fluid. Further<br />
investigation <strong>of</strong> the effects <strong>of</strong> these events and the<br />
frequencies used in our experiments <strong>for</strong> the <strong>analysis</strong><br />
need to be done. The mathematical expressions used in<br />
frequency-domain <strong>analysis</strong> assume continuous and<br />
infinite <strong>time</strong>-series, which is practically prohibitive<br />
because stimuli are presented at discrete <strong>time</strong>s within a<br />
finite period <strong>of</strong> <strong>time</strong>. The finite duration <strong>of</strong> f<strong>MRI</strong><br />
<strong>time</strong>-series reflects as a rippling effect, and the sampling<br />
reflects as an aliasing effect in the frequency<br />
spectra [Brigham, 1988], introducing errors into the<br />
parameter estimations. These errors may be reduced<br />
by using high sampling rates and longer <strong>time</strong>-series.<br />
Another disadvantage <strong>of</strong> frequency-domain <strong>analysis</strong> is<br />
that it is applicable only <strong>for</strong> periodic stimulations.<br />
Frequency-domain <strong>analysis</strong> renders <strong>hemodynamic</strong> parameters<br />
<strong>for</strong> a Gaussian HDMF in a noniterative<br />
manner while with the Gamma model, parameter<br />
estimation leads to iterative and nonlinear optimization<br />
schemes. For nonperiodic stimulations, the param-<br />
295
Figure 6.<br />
Detected activities on six sagittal levels (W 1 ...W 6 ) <strong>of</strong> a representative subject per<strong>for</strong>ming a<br />
word-discriminating task. Using multiple regression (a) without <strong>hemodynamic</strong> correction (z 3.5)<br />
and (b) with <strong>hemodynamic</strong> correction, assuming a Gaussian HDMF (z 4.0).
Rajapakse et al. <br />
TABLE IV. Comparison <strong>of</strong> <strong>hemodynamic</strong> parameter-evaluated activities on six<br />
sagittal levels (W 1 ...W 6 ) on the same subject, assuming a Gaussian HDMF*<br />
Lag<br />
W 1 W 2 W 3 W 4 W 5 W 6<br />
W 1 1.000 0.000 0.099 0.070 0.000 0.056<br />
W 2 0.000 1.000 0.000 0.068 0.000 0.000<br />
W 3 0.099 0.000 1.000 0.008 0.173 0.182<br />
W 4 0.070 0.068 0.008 1.000 0.000 0.000<br />
W 5 0.000 0.000 0.173 0.000 1.000 0.000<br />
W 6 0.056 0.000 0.182 0.000 0.000 1.000<br />
Dispersion<br />
W 1 W 2 W 3 W 4 W 5 W 6<br />
W 1 1.000 0.026 0.806 0.000 0.004 0.853<br />
W 2 0.026 1.000 0.222 0.000 0.000 0.019<br />
W 3 0.806 0.222 1.000 0.000 0.055 0.744<br />
W 4 0.000 0.000 0.000 1.000 0.000 0.000<br />
W 5 0.004 0.000 0.055 0.000 1.000 0.005<br />
W 6 0.853 0.019 0.744 0.000 0.005 1.000<br />
* Values indicated are the significance levels or P-values yielded in the comparison <strong>of</strong> the parameters <strong>of</strong><br />
the two regions, using t-tests.<br />
eters need to be computed <strong>for</strong> each cycle separately in<br />
frequency-domain or via piecewise model-fitting in<br />
the <strong>time</strong>-domain [Cohen, 1997], but both processes are<br />
computationally expensive.<br />
The proposed Gaussian model with the parameter<br />
estimation scheme presented here facilitates the evaluation<br />
<strong>of</strong> <strong>hemodynamic</strong> <strong>response</strong>s at every voxel site.<br />
As demonstrated in our experiment, the concept <strong>of</strong> a<br />
global HDMF over the entire brain is incorrect. The<br />
<strong>hemodynamic</strong> <strong>response</strong> to neuronal activations is a<br />
complex function depending on the neuronal and<br />
vascular microarchitecture and the cognitive load in<br />
the region, and modulated by physiological factors<br />
such as pH, blood pressure, or metabolism. Because<br />
most <strong>of</strong> these factors may not be considered constant<br />
over the entire brain, we favored a space-variant<br />
approach. Our f<strong>MRI</strong> experiments resulted in different<br />
values <strong>of</strong> lag and dispersion <strong>for</strong> the activated regions<br />
<strong>for</strong> visual-stimulation and word-discrimination tasks,<br />
supporting our conjecture <strong>of</strong> a spatially-variant and<br />
stimulation-dependent <strong>hemodynamic</strong> <strong>response</strong> function<br />
<strong>for</strong> the brain. Although our experiments were not<br />
sufficient to make definitive conclusions about the<br />
nature <strong>of</strong> the variation <strong>of</strong> <strong>hemodynamic</strong> parameters, it<br />
became evident that they depended on a multitude <strong>of</strong><br />
factors such as brain site, stimulus condition and<br />
frequency, or individual subject. Also, the comparison<br />
<strong>of</strong> <strong>functional</strong> activities based on the same experiment<br />
with different subjects is affected by the anatomical<br />
variability <strong>of</strong> the human brain, especially at the sulcal<br />
and gyral patterns, as seen in Figure 7. In other words,<br />
the <strong>functional</strong> variability is confounded by the anatomical<br />
variability <strong>of</strong> the human brain.<br />
An exact <strong>for</strong>mulation <strong>for</strong> the degrees <strong>of</strong> freedom was<br />
presented [Worsley and Friston, 1995] to compensate<br />
<strong>for</strong> the temporal correlations present in f<strong>MRI</strong> <strong>time</strong>series.<br />
The idea <strong>of</strong> the smoothness matrix is not<br />
applicable when <strong>hemodynamic</strong>s depend both on spatial<br />
location and on stimulation conditions. There<strong>for</strong>e,<br />
the <strong>hemodynamic</strong> modulation needs to be applied to<br />
each stimulus separately. The threshold <strong>for</strong> the statistical<br />
maps to determine significant activation regions<br />
was determined empirically, considering all the data<br />
sets. There is no proper criterion <strong>for</strong> the selection <strong>of</strong><br />
this threshold, although major developments were<br />
reported [Friston et al., 1994a] in this area with the<br />
theory <strong>of</strong> random Gaussian fields. Although smoothing<br />
in both <strong>time</strong> and space improves signal-to-noise<br />
ratios <strong>of</strong> the images, it might introduce artificial temporal<br />
or spatial correlations to the images and result in<br />
poor resolution <strong>of</strong> activation maps. In our approach,<br />
the spatial and temporal effects are handled separately,<br />
but a synergetic spatiotemporal approach may be<br />
more elegant and fruitful.<br />
Univariate multiple regression <strong>analysis</strong> has been<br />
used earlier <strong>for</strong> statistical inference on significant<br />
activations with global <strong>hemodynamic</strong> parameters [Friston<br />
et al., 1995a], and an extension was presented to<br />
297
HDMF <strong>of</strong> f<strong>MRI</strong> Time-Series <br />
Figure 7.<br />
Detected activities taken at the same axial level when 3 subjects (V 1 ,V 2 , and V 3 ) separately<br />
per<strong>for</strong>ming the same visual-stimulation task (a) without <strong>hemodynamic</strong> correction (z 3.0) and (b)<br />
with <strong>hemodynamic</strong> correction, using a Gaussian HDMF (z 3.5).<br />
TABLE V. Comparison <strong>of</strong> <strong>hemodynamic</strong> parameters<br />
evaluated over the largest activated region at the same<br />
axial level on the different subjects (V 1 ,V 2 , and V 3 )<br />
separately per<strong>for</strong>ming the same visual task, assuming a<br />
Gaussian HDMF*<br />
Lag<br />
Dispersion<br />
V 1 V 2 V 3 V 1 V 2 V 3<br />
V 1 1.000 0.824 0.001 1.000 0.009 0.003<br />
V 2 0.824 1.000 0.007 0.009 1.000 0.916<br />
V 3 0.001 0.007 1.000 0.003 0.916 1.000<br />
* Values indicated are the significance levels or P-values obtained by<br />
comparing the parameters <strong>of</strong> the two regions, using t-tests.<br />
handle locally varying <strong>hemodynamic</strong> parameters. Hemodynamic<br />
correction <strong>for</strong> lag and dispersion <strong>of</strong> f<strong>MRI</strong><br />
<strong>time</strong>-series increased the sensitivity <strong>of</strong> our <strong>analysis</strong>,<br />
with an increase <strong>of</strong> the S/N ratio over the statistical<br />
maps. Incorporation <strong>of</strong> the <strong>hemodynamic</strong> correction<br />
<strong>for</strong> the statistical <strong>analysis</strong> is especially important when<br />
the frequency <strong>of</strong> the experimental stimulus is high<br />
with respect to the lag and dispersion values. Even<br />
though the experiments presented here had only a<br />
single stimulus condition, the <strong>analysis</strong> is applicable to<br />
experiments involving multiple stimuli and extendible<br />
in order to consider interactions among stimuli. Also,<br />
the methodology presented here is readily applicable<br />
to three-dimensional f<strong>MRI</strong> scans.<br />
In deriving our simplified model, we neglected a<br />
number <strong>of</strong> important factors affecting the human brain<br />
298
Rajapakse et al. <br />
activation, e.g., the delay due to synaptic propagation<br />
<strong>of</strong> activity from sensory receptors to the brain voxels,<br />
the effect <strong>of</strong> ongoing activities over the brain, especially<br />
high level activities such as perception [Cerf et<br />
al., 1995] and their effect on experimental stimulus,<br />
and the nonlinearities posed by the MR scanners. Also,<br />
the psychological effects may not be significant in the<br />
tasks presented here, but may be significant in experiments<br />
involving multiple stimuli and higher cognitive<br />
tasks. The present model may be a basis <strong>for</strong> more<br />
complicated models to include other events that are<br />
assumed to be negligible in deriving our model. (For<br />
instance, our model may be extended adding another<br />
convolution term p(t) to account <strong>for</strong> the ‘‘perception’’<br />
effect, which couples the neuronal activity extending<br />
Eq. (3): y(t) x(t) h(t) (t).) The subjects were<br />
presumed to have per<strong>for</strong>med the experimental tasks<br />
identically over all the repeated presentations <strong>of</strong> the<br />
stimuli; nevertheless, the reaction <strong>time</strong>s and behavior<br />
may well be different <strong>for</strong> each period. This violates our<br />
assumption <strong>of</strong> the stationarity <strong>of</strong> f<strong>MRI</strong> <strong>time</strong>-series and<br />
our deterministic approach. An extension to consider<br />
<strong>hemodynamic</strong> parameters as stochastic variables may<br />
be useful.<br />
Physiologically, finite values <strong>of</strong> lag and dispersion<br />
<strong>for</strong> activated regions indicate that the change in bloodoxygenation<br />
takes <strong>time</strong> to respond to a change in<br />
neural firing at a slower pace than the changes <strong>of</strong> the<br />
stimulus condition. These parameters were different<br />
<strong>for</strong> activated and nonactivated sites and may be<br />
related to the structure, morphology, vasculature, and<br />
metabolism <strong>of</strong> the cortex and useful in characterizing<br />
and categorizing the activated sites. Further investigation<br />
<strong>of</strong> these parameters throughout the cortex may<br />
unravel salient aspects <strong>of</strong> its <strong>functional</strong> specificity.<br />
However, it is necessary to further validate the Gaussian<br />
and other models representing brain <strong>hemodynamic</strong>s<br />
be<strong>for</strong>e making conclusions about brain functions.<br />
Until the process <strong>of</strong> vascular coupling <strong>of</strong> neuronal<br />
activations is well-understood and an accurate and<br />
well-parameterized model <strong>for</strong> <strong>functional</strong>ly induced<br />
MR signal changes is established, our model may serve<br />
as a valuable tool <strong>for</strong> <strong>functional</strong> neuroimaging studies.<br />
It may be useful as a prototype <strong>for</strong> more complex<br />
models <strong>of</strong> HDMF to include other aspects <strong>of</strong> <strong>hemodynamic</strong><br />
<strong>response</strong>s, such as transient and habituation<br />
effects during sensory or cognitive stimulation tasks.<br />
ACKNOWLEDGMENTS<br />
We thank our colleagues Ulrich Müller, Stephan<br />
Pollmann, and Christian Uhl <strong>for</strong> their input into the<br />
manuscript. Experiments were conducted by Chris<br />
Wiggins, Margret Hund, and Thoralf Niendorf.<br />
REFERENCES<br />
Bandettini PA, Jesmanowicz A, Wong EC, Hyde JS (1993): Processing<br />
strategies <strong>for</strong> <strong>time</strong>-course data sets in <strong>functional</strong> <strong>MRI</strong> <strong>of</strong> human<br />
brain. Magn Reson Med 30:161–173.<br />
Bandettini PA, Wong EC, Jesmanowicz A, Hinks RS, Hyde JS (1994):<br />
Spin-echo and gradient-echo EPI <strong>of</strong> human brain activation using<br />
BOLD contrast: A comparative study at 1.5T. NMR Biomed 7:12–20.<br />
Belliveau JW, Kennedy DN, McKinstry RC, Buchbinder BR, Weissk<strong>of</strong>f<br />
RM, Cohen MS, Vevea JM, Brady TJ, Rosen BR (1991):<br />
Functional mapping <strong>of</strong> the human cortex by magnetic resonance<br />
imaging. Science 254:716–719.<br />
Blamire AM, Ogawa S, Ugurbil K, Rothman D, McCarthy G,<br />
Ellermann JM, Hyder F, Rattner Z, Shulman RG (1992): Dynamic<br />
mapping <strong>of</strong> the human visual cortex by high-speed magnetic<br />
resonance imaging. Proc Natl Acad Sci USA 89:11069–11073.<br />
Brigham EO (1988): The Fast Fourier Trans<strong>for</strong>m and Its Applications,<br />
Englewood Cliffs: Prentice Hall.<br />
Bullmore E, Brammer M, Williams SCR, Rabe-Hesketh S, Janot N,<br />
David A, Mellers J, Howard R, Sham P (1996): Statistical methods<br />
<strong>of</strong> estimation and inference <strong>for</strong> <strong>functional</strong> MR image <strong>analysis</strong>.<br />
Magn Reson Med 35:261–277.<br />
Cerf B, Van de Moortele E, Giacomini E, MacLeod P, Faurion D, Le<br />
Bihan D (1996): Correlation <strong>of</strong> perception to temporal variations <strong>of</strong><br />
f<strong>MRI</strong> signal: A taste study. Proceedings <strong>of</strong> the Fourth Meeting <strong>of</strong> the<br />
International Society <strong>for</strong> Magnetic Resonance in Medicine, Berkeley:<br />
International Society <strong>for</strong> Magnetic Resonance in Medicine, p. 477.<br />
Cohen MS (1997): Parametric <strong>analysis</strong> <strong>of</strong> f<strong>MRI</strong> data using linear<br />
systems methods. Neuroimage 6:93–103.<br />
Duyn JH, Moonen CTW, van Yperen GH, de Boer RW, Luyten PR<br />
(1994): Inflow versus deoxyhemoglobin effects in BOLD <strong>functional</strong><br />
<strong>MRI</strong> using gradient echoes at 1.5T. NMR Biomed 7:83–88.<br />
Engel SA, Rumelhart DE, Wandell BA, Lee AT, Glover GH, Chichilnisky<br />
E-J, Shadlen MN (1994): f<strong>MRI</strong> <strong>of</strong> human visual cortex. Nature 369:525.<br />
Ernst T, Henning J (1994): Observation <strong>of</strong> fast <strong>response</strong> in <strong>functional</strong><br />
MR. Magn Reson Med 32:146–149.<br />
Fox PT, Raichle ME (1986): Focal physiological uncoupling <strong>of</strong><br />
cerebral blood flow and oxidative metabolism during somatosensory<br />
stimulation in human subjects. Proc Natl Acad Sci USA<br />
83:1140–1144.<br />
Fox PT, Raichle ME, Mintun MA, Dence C (1988): Nonoxidative<br />
glucose consumption during focal physiologic neural activity.<br />
Science 241:462–464.<br />
Frahm J, Merboldt K-D, Hanicke W, Kleinschmidt A, Boecker H<br />
(1994): Brain or vein—Oxygenation <strong>of</strong> flow? On signal physiology<br />
in <strong>functional</strong> <strong>MRI</strong> <strong>of</strong> human brain activation. NMR Biomed<br />
7:45–53.<br />
Friston KJ, Worsley KJ, Frackowiak RSJ, Mazziotta JC, Evans AC<br />
(1994a): Assessing the significance <strong>of</strong> focal activations using their<br />
spatial extent. Hum Brain Mapp 1:210–220.<br />
Friston KJ, Jezzard P, Turner R (1994b): Analysis <strong>of</strong> <strong>functional</strong> <strong>MRI</strong><br />
<strong>time</strong>-series. Hum Brain Mapp 1:153–171.<br />
Friston KJ, Holmes AP, Worsley KJ, Poline JB, Frith CD, Frackowiak<br />
RSJ (1995a): Statistical parametric maps in <strong>functional</strong> imaging: A<br />
general linear approach. Hum Brain Mapp 2:189–210.<br />
Friston KJ, Holmes AP, Poline J-B, Grasby PJ, Williams CR, Frackowiak<br />
SJ, Turner R (1995b): Analysis <strong>of</strong> f<strong>MRI</strong> <strong>time</strong>-series revisited.<br />
Neuroimage 2:45–53.<br />
299
Rajapakse et al. <br />
Friston KJ, Williams S, Howard R, Frackowiak RSJ, Turner R (1996):<br />
Movement-related effects in f<strong>MRI</strong> <strong>time</strong>-series. Magn Reson Med<br />
35:346–355.<br />
Frostig RD, Lieeke EE, Ts’o YD, Grinvald A (1990): Cortical <strong>functional</strong><br />
architecture and local coupling between neuronal activity<br />
and the microcirculation revealed by in vivo high-resolution<br />
optical imaging <strong>of</strong> intrinsic signal. Proc Natl Acad Sci USA<br />
87:6082–6086.<br />
Jueptner M, Weiller C (1995): Review: Does measurement <strong>of</strong> regional<br />
cerebral blood flow reflect synaptic activity? Implications <strong>for</strong> PET<br />
and f<strong>MRI</strong>. Neuroimage 2:148–156.<br />
Kruggel F, Lohmann G (1996): BRIAN—A toolkit <strong>for</strong> the <strong>analysis</strong> <strong>of</strong><br />
multimodal brain data sets. In: Lemke HV, Inamura K, Jaffe CC,<br />
Vannier MW (eds): Proceedings <strong>of</strong> the Computer Assisted Radiology<br />
(CAR 96). Berlin: Springer-Verlag, pp 323–328.<br />
Kwong KK, Belliveau JW, Chesler DA, Goldberg IE, Weissk<strong>of</strong>f RM,<br />
Poncelet BP, Kennedy DN, Hoppel BE, Cohen MS, Turner R,<br />
Cheng H-M, Brady TJ, Rosen BR (1992): Dynamic magnetic<br />
resonance imaging <strong>of</strong> human brain activity during primary<br />
sensory stimulation. Proc Natl Acad Sci USA 89:5675–5679.<br />
Lange N, Zeger SL (1997): Non-linear Fourier <strong>time</strong> series <strong>analysis</strong> <strong>for</strong><br />
human brain mapping by <strong>functional</strong> magnetic resonance imaging.<br />
J R Stat Soc Appl Stat 46:1–29.<br />
Lee AT, Glover GH, Meyer GH (1995): Discrimination <strong>of</strong> large<br />
venous vessels in <strong>time</strong>-course spiral blood-oxygen-level-dependent<br />
magnetic resonance <strong>functional</strong> neuroimaging. Magn Reson<br />
Med 33:745–754.<br />
Maisog JM, Clark V, Courtney S, Haxby J (1995): Estimating the<br />
<strong>hemodynamic</strong> <strong>response</strong> and effective degrees <strong>of</strong> freedom in<br />
<strong>functional</strong> <strong>MRI</strong> <strong>time</strong> series. First International Conference on Functional<br />
Mapping <strong>of</strong> the Human Brain Abstracts, Supplement 1, p 147.<br />
McCarthy G, Blamire AM, Rothman DL, Gruetter R, Shulman RG<br />
(1993): Echo-planar magnetic resonance imaging studies <strong>of</strong> frontal<br />
cortex activation during word generation in humans. Proc<br />
Natl Acad Sci USA 90:4952–4956.<br />
Menon RS, Ogawa S, Tank DW, Ugurbil K (1993): 4 Tesla gradient<br />
recalled echo characteristics <strong>of</strong> photic stimulation-induced signal<br />
changes in the human primary visual cortex. Magn Reson Med<br />
30:380–386.<br />
Menon RS, Ogawa S, Hu X, Strupp JP, Anderson P, Ugurbil K (1995):<br />
BOLD based <strong>functional</strong> <strong>MRI</strong> at 4 Tesla includes a capillary<br />
bet contribution: Echo-planar imaging correlates with previous<br />
optical imaging using intrinsic signals. Magn Reson Med 33:<br />
453–459.<br />
Nielsen FA, Hansen LK, T<strong>of</strong>t P, Goutte C, Lange N, Strother SC,<br />
Morch N, Svarer C, Savoy R, Rosen B, Rostrup E, Born P (1997):<br />
Comparison <strong>of</strong> two convolution models <strong>for</strong> f<strong>MRI</strong> <strong>time</strong> series.<br />
Toga A., Frachouide RSY, Mazzotta JC (Eds.) Third International<br />
Conference on Functional Mapping <strong>of</strong> the Human Brain, San<br />
Diego: Academic Press, p. 473.<br />
Ogawa S, Tank DW, Menon R, Ellermann JM, Kim S-G, Merkle H,<br />
Ugurbil K (1992): Intrinsic signal changes accompanying sensory<br />
stimulation: Functional brain mapping with magnetic resonance<br />
imaging. Proc Natl Acad Sci USA 89:5951–5955.<br />
Ogawa S, Menon RS, Tank DW, Kim S-G, Merkle H, Ellermann JM,<br />
Ugurbil K (1993): Functional brain mapping by blood oxygenation<br />
level-dependent contrast magnetic resonance imaging.<br />
Biophys J 64:803–812.<br />
Papoulis A (1991): Probability, Random Variables, and Stochastic<br />
Processes, Third Edition, New York: McGraw-Hill, Inc.<br />
Press WH, Teukolsky SA, Vetterling WT, Flamery BP (1994): Numerical<br />
Recipies in C, Cambridge: Cambridge University Press.<br />
Raichle ME, Grubb RL, Gado MH, Eichling JO, Ter-Pogossian MM<br />
(1976): Correlation between regional cerebral blood flow and<br />
oxidative metabolism. Arch Neurol 33:523–526.<br />
Rajapakse JC, Kruggel F (1997): Neuronal and <strong>hemodynamic</strong> <strong>response</strong>s<br />
from f<strong>MRI</strong> <strong>time</strong>-series. Proceedings <strong>of</strong> International<br />
Conference on Neural In<strong>for</strong>mation Processing, New Zealand.<br />
Rencher AC (1995): Methods <strong>of</strong> Multivariate Analysis, New York:<br />
John Wiley & Sons, Inc., p 360.<br />
Turner R, Jezzard P, Wen H, Kwong KK, Le Bihan D, Zeffiro T,<br />
Balaban RS (1993): Functional mapping <strong>of</strong> the human visual<br />
cortex at 4 and 1.5 Tesla using deoxygenation contrast EPI. Magn<br />
Reson Med 29:277–279.<br />
Singh M, Kim T, Kim H, Khosla D (1995): Separation <strong>of</strong> veins from<br />
activated brain tissue in <strong>functional</strong> magnetic resonance images at<br />
1.5T. IEEE Trans Nucl Sci 42:1338–1340.<br />
Sorenson JA, Wang X (1997): Problems in estimating <strong>hemodynamic</strong><br />
<strong>response</strong> parameters from f<strong>MRI</strong> data. Hum Brain Mapp 4:<br />
265–272.<br />
Van de Moortele PF, Lobel E, Paradis AL, Le Bihan D (1997): Brain<br />
activation <strong>analysis</strong> <strong>of</strong> EPI f<strong>MRI</strong> <strong>time</strong> series needs correction <strong>for</strong><br />
slice dependent phase shifts. Proceedings <strong>of</strong> the Fifth Meeting <strong>of</strong><br />
the International Society <strong>for</strong> Magnetic Resonance in Medicine,<br />
Berkeley: International Society <strong>for</strong> Magnetic Resonance in Medicine,<br />
p. 129.<br />
Villringer A, Dirnagl U (1995): Coupling <strong>of</strong> brain activity and<br />
cerebral blood flow: Basis <strong>of</strong> <strong>functional</strong> neuroimaging. Cerebrovasc<br />
Brain Metab Rev 7:240–276.<br />
Worsley KJ, Friston KJ (1995): Analysis <strong>of</strong> f<strong>MRI</strong> <strong>time</strong>-series revisited—<br />
again. Neuroimage 2:173–181.<br />
APPENDIX<br />
Parametric models <strong>for</strong> Hemodynamic Modulation Function (HDMF)<br />
Model HDMF Fourier trans<strong>for</strong>m (Lag, dispersal) Comments<br />
Poisson P(i) i e /i! (, )<br />
Gamma (t) 2<br />
1<br />
t 11 e 2t /( 1 ) (1 jw i / 2 ) 1 1 1<br />
2<br />
, 1<br />
2<br />
22<br />
iN ; R <br />
Lag dispersion<br />
1 , 2 R <br />
Lag dispersion 2<br />
Gaussian G(t) 1<br />
e<br />
(tµ)2 / 2 e 2 2 /2<br />
e jµ (µ, 2 ) µR; 2 R <br />
22 )<br />
300