Entropy Inference and the James-Stein Estimator, with Application to ...
Entropy Inference and the James-Stein Estimator, with Application to ...
Entropy Inference and the James-Stein Estimator, with Application to ...

Create successful ePaper yourself
Turn your PDF publications into a flip-book with our unique Google optimized e-Paper software.
ENTROPY INFERENCE AND THE JAMES-STEIN ESTIMATOR<br />
Probability density<br />
MSE cell frequencies<br />
MSE entropy<br />
Bias entropy<br />
probability<br />
0.0 0.2 0.4 0.6<br />
H = 1.11<br />
Dirichlet<br />
a=0.0007, p=1000<br />
estimated MSE<br />
0.0 0.2 0.4<br />
ML<br />
1/2<br />
1<br />
1/p<br />
minimax<br />
Shrink<br />
estimated MSE<br />
0 20 40 60 80<br />
Miller−Madow<br />
Chao−Shen<br />
NSB<br />
estimated Bias<br />
0 2 4 6 8<br />
0 200 400 600 800<br />
10 50 500 5000<br />
10 50 500 5000<br />
10 50 500 5000<br />
probability<br />
0.000 0.004 0.008<br />
H = 6.47<br />
Dirichlet<br />
a=1, p=1000<br />
estimated MSE<br />
0.00 0.04 0.08<br />
estimated MSE<br />
0 10 20 30<br />
estimated Bias<br />
−6 −4 −2 0<br />
0 200 400 600 800<br />
10 50 500 5000<br />
10 50 500 5000<br />
10 50 500 5000<br />
probability<br />
0.000 0.010 0.020<br />
Dirichlet<br />
a=1, p=500 + 500 zeros<br />
H = 5.77<br />
estimated MSE<br />
0.00 0.04 0.08<br />
estimated MSE<br />
0 5 10 15 20 25<br />
estimated Bias<br />
−5 −3 −1 0 1<br />
probability<br />
0.00 0.05 0.10 0.15<br />
0 200 400 600 800<br />
Zipf<br />
p=1000<br />
H = 5.19<br />
estimated MSE<br />
0.00 0.04 0.08<br />
10 50 500 5000<br />
estimated MSE<br />
0 5 10 15 20<br />
10 50 500 5000<br />
estimated Bias<br />
−4 −2 0 1 2<br />
10 50 500 5000<br />
0 200 400 600 800<br />
10 50 500 5000<br />
10 50 500 5000<br />
10 50 500 5000<br />
bin number<br />
sample size n<br />
sample size n<br />
sample size n<br />
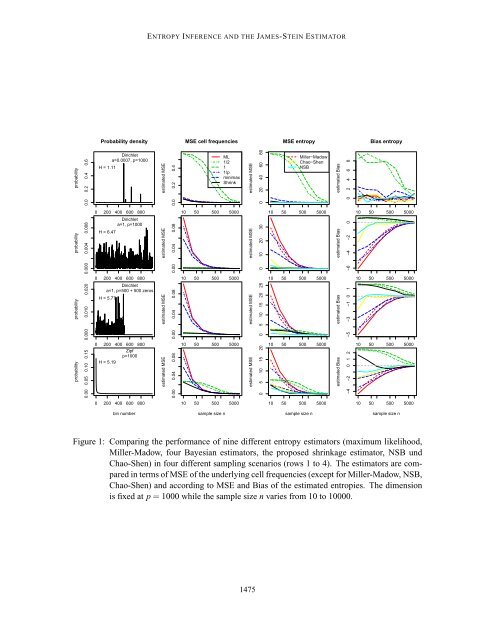
Figure 1: Comparing <strong>the</strong> performance of nine different entropy estima<strong>to</strong>rs (maximum likelihood,<br />
Miller-Madow, four Bayesian estima<strong>to</strong>rs, <strong>the</strong> proposed shrinkage estima<strong>to</strong>r, NSB und<br />
Chao-Shen) in four different sampling scenarios (rows 1 <strong>to</strong> 4). The estima<strong>to</strong>rs are compared<br />
in terms of MSE of <strong>the</strong> underlying cell frequencies (except for Miller-Madow, NSB,<br />
Chao-Shen) <strong>and</strong> according <strong>to</strong> MSE <strong>and</strong> Bias of <strong>the</strong> estimated entropies. The dimension<br />
is fixed at p = 1000 while <strong>the</strong> sample size n varies from 10 <strong>to</strong> 10000.<br />
1475