FINAL REPORT - Grand River Conservation Authority
FINAL REPORT - Grand River Conservation Authority
FINAL REPORT - Grand River Conservation Authority

You also want an ePaper? Increase the reach of your titles
YUMPU automatically turns print PDFs into web optimized ePapers that Google loves.
<strong>Grand</strong> <strong>River</strong> Watershed-Wide Wastewater Optimization Pilot Project<br />
(kg/person/d)<br />
45<br />
40<br />
35<br />
30<br />
25<br />
20<br />
15<br />
10<br />
5<br />
0<br />
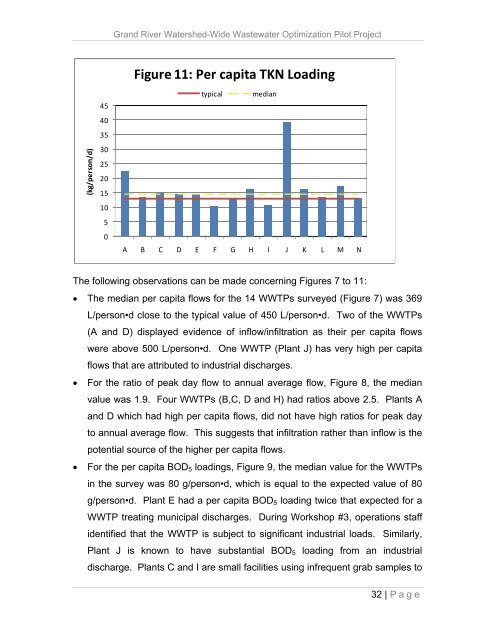
Figure 11: Per capita TKN Loading<br />
typical median<br />
A B C D E F G H I J K L M N<br />
The following observations can be made concerning Figures 7 to 11:<br />
The median per capita flows for the 14 WWTPs surveyed (Figure 7) was 369<br />
L/person•d close to the typical value of 450 L/person•d. Two of the WWTPs<br />
(A and D) displayed evidence of inflow/infiltration as their per capita flows<br />
were above 500 L/person•d. One WWTP (Plant J) has very high per capita<br />
flows that are attributed to industrial discharges.<br />
For the ratio of peak day flow to annual average flow, Figure 8, the median<br />
value was 1.9. Four WWTPs (B,C, D and H) had ratios above 2.5. Plants A<br />
and D which had high per capita flows, did not have high ratios for peak day<br />
to annual average flow. This suggests that infiltration rather than inflow is the<br />
potential source of the higher per capita flows.<br />
For the per capita BOD 5 loadings, Figure 9, the median value for the WWTPs<br />
in the survey was 80 g/person•d, which is equal to the expected value of 80<br />
g/person•d. Plant E had a per capita BOD 5 loading twice that expected for a<br />
WWTP treating municipal discharges. During Workshop #3, operations staff<br />
identified that the WWTP is subject to significant industrial loads. Similarly,<br />
Plant J is known to have substantial BOD 5 loading from an industrial<br />
discharge. Plants C and I are small facilities using infrequent grab samples to<br />
32 | Page