U.S. Fixed Income 2004 Outlook & 2003 Year-in ... - Securitization.Net
U.S. Fixed Income 2004 Outlook & 2003 Year-in ... - Securitization.Net
U.S. Fixed Income 2004 Outlook & 2003 Year-in ... - Securitization.Net

Create successful ePaper yourself
Turn your PDF publications into a flip-book with our unique Google optimized e-Paper software.
Nomura <strong>Fixed</strong> <strong>Income</strong> Research<br />
<strong>2004</strong> <strong>Outlook</strong> & <strong>2003</strong> <strong>Year</strong>-<strong>in</strong>-Review<br />
Summary Table of Contents<br />
Full Table of Contents on page 2<br />
Economics...........................................................................................................................1<br />
Market Strategy...................................................................................................................7<br />
Corporate Bonds ...............................................................................................................10<br />
Residential MBS................................................................................................................20<br />
Commercial MBS ..............................................................................................................26<br />
Asset-Backed Securities ...................................................................................................45<br />
Collateralized Debt Obligations .........................................................................................51<br />
Recent Nomura <strong>Fixed</strong> <strong>Income</strong> Research ..........................................................................57<br />
18 December <strong>2003</strong><br />
I. Economics<br />
David Resler (212) 667-2415<br />
Parul Ja<strong>in</strong> (212) 667-2418<br />
A. Overview<br />
Just six months ago, skepticism that the long-awaited acceleration <strong>in</strong> economic activity would f<strong>in</strong>ally<br />
materialize ran deep. Deep enough, <strong>in</strong> fact, to persuade the Federal Reserve to cut the federal funds<br />
rate to a 40-year low AND to take the extraord<strong>in</strong>ary step of effectively committ<strong>in</strong>g itself to ma<strong>in</strong>ta<strong>in</strong><br />
this accommodative stance <strong>in</strong>def<strong>in</strong>itely. Nonetheless, we held fast to our expectations for a much<br />
stronger second half, <strong>in</strong> part because the economy's exceptional resilience <strong>in</strong> the face of so much first<br />
half adversity seemed to warrant even greater optimism about the outlook. Moreover, a<br />
complementary blend of expansive fiscal and monetary policies also made a most compell<strong>in</strong>g case<br />
for a substantial upturn <strong>in</strong> economic activity.<br />
Such optimism proved justified as real GDP growth accelerated significantly <strong>in</strong> the second half of<br />
<strong>2003</strong>. The modest pick-up <strong>in</strong> activity that began <strong>in</strong> the second quarter when real output grew at a<br />
3.1% rate turned explosive <strong>in</strong> the third quarter as real GDP soared at a spectacular 8.2% pace, the<br />
fastest quarterly growth <strong>in</strong> almost twenty years. An assortment of tax cuts aimed at <strong>in</strong>dividuals and<br />
families provided a powerful lift to disposable <strong>in</strong>come, which households wasted no time <strong>in</strong> spend<strong>in</strong>g.<br />
Provid<strong>in</strong>g further impetus to the buy<strong>in</strong>g b<strong>in</strong>ge, valuations of f<strong>in</strong>ancial assets began to rise for the first<br />
time <strong>in</strong> three years, complement<strong>in</strong>g the steady wealth ga<strong>in</strong>s aris<strong>in</strong>g from the strong real estate<br />
market. Round<strong>in</strong>g out this "perfect storm" of spend<strong>in</strong>g <strong>in</strong>centives, low mortgage rates made it<br />
especially easy to ref<strong>in</strong>ance mortgage debt and extract some of the capital ga<strong>in</strong>s from real estate and<br />
equities. As a result, consumer spend<strong>in</strong>g surged ahead at a 6.4% rate <strong>in</strong> the third quarter, the<br />
strongest <strong>in</strong> six years. Unlike previous quarters, the economy also derived considerable strength<br />
from an upturn <strong>in</strong> capital spend<strong>in</strong>g. Here too, the tax cuts played a big part. Reductions <strong>in</strong> dividend<br />
and capital ga<strong>in</strong>s taxes, as well as a more generous depreciation schedule spurred bus<strong>in</strong>esses to<br />
<strong>in</strong>vest <strong>in</strong> new plant and equipment. Not surpris<strong>in</strong>gly, evidence of the revival <strong>in</strong> bus<strong>in</strong>ess <strong>in</strong>vestment<br />
spend<strong>in</strong>g first emerged <strong>in</strong> the spr<strong>in</strong>g, just after the new depreciation schedule took effect.<br />
Consequently, capital spend<strong>in</strong>g, which grew at the fastest rate s<strong>in</strong>ce early 2000, dur<strong>in</strong>g the third<br />
quarter, now appears on a path to recover from the decl<strong>in</strong>es of the past three years.<br />
Please read the important disclosures and analyst certifications<br />
appear<strong>in</strong>g on the last page.<br />
Contacts:<br />
David Jacob<br />
(212) 667-2255<br />
djacob@us.nomura.com<br />
David Resler<br />
(212) 667-2415<br />
dresler@us.nomura.com<br />
Mark Adelson<br />
(212) 667-2337<br />
madelson@us.nomura.com<br />
Arthur Q. Frank, CFA<br />
(212) 667-1477<br />
afrank@us.nomura.com<br />
Louis (Trey) Ott<br />
(212) 667-9521<br />
lott@us.nomura.com<br />
Nomura Securities International, Inc.<br />
Two World F<strong>in</strong>ancial Center<br />
Build<strong>in</strong>g B<br />
New York, NY 10281-1198<br />
Fax: (212) 667-1046
Nomura <strong>Fixed</strong> <strong>Income</strong> Research<br />
Table of Contents<br />
Economics........................................................................................................................................................................1<br />
Overview ...................................................................................................................................................................1<br />
Interest Rate <strong>Outlook</strong> ................................................................................................................................................4<br />
Themes and Cross Market Strategy for the First Half of <strong>2004</strong> .........................................................................................7<br />
Trade Ideas for the First Half of <strong>2004</strong>........................................................................................................................9<br />
Corporate Bonds ............................................................................................................................................................10<br />
<strong>Outlook</strong> for the First Half of <strong>2004</strong> ............................................................................................................................10<br />
Review of <strong>2003</strong> Second Half...................................................................................................................................16<br />
Residential MBS.............................................................................................................................................................20<br />
Summary.................................................................................................................................................................20<br />
Prepayment <strong>Outlook</strong> ...............................................................................................................................................21<br />
Spreads...................................................................................................................................................................22<br />
Coupon Stack .........................................................................................................................................................23<br />
Relative Value.........................................................................................................................................................24<br />
Commercial MBS ...........................................................................................................................................................26<br />
<strong>Outlook</strong> for <strong>2004</strong> .....................................................................................................................................................26<br />
Review of <strong>2003</strong> .......................................................................................................................................................30<br />
Real Estate Markets................................................................................................................................................38<br />
Introduction .............................................................................................................................................................31<br />
Asset-Backed Securities ................................................................................................................................................45<br />
<strong>Outlook</strong> for <strong>2004</strong> .....................................................................................................................................................45<br />
Review of Second Half of <strong>2003</strong>...............................................................................................................................46<br />
Developments .........................................................................................................................................................48<br />
Off-Balance Sheet Account<strong>in</strong>g.........................................................................................................................48<br />
Fraud ...............................................................................................................................................................49<br />
Credit Card ABS ..............................................................................................................................................50<br />
NERA Study – Notch<strong>in</strong>g...................................................................................................................................50<br />
Collateralized Debt Obligations ......................................................................................................................................51<br />
<strong>Outlook</strong> for <strong>2004</strong> .....................................................................................................................................................51<br />
Review of <strong>2003</strong> .......................................................................................................................................................51<br />
Recent Nomura <strong>Fixed</strong> <strong>Income</strong> Research .......................................................................................................................57<br />
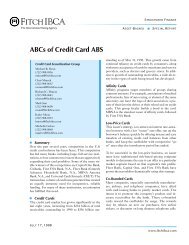
While the heady Q3 growth surge would be difficult to repeat, growth <strong>in</strong> the fourth quarter rema<strong>in</strong>s<br />
strong and we now estimate that real GDP growth <strong>in</strong> the second half of <strong>2003</strong> will exceed 6%, more<br />
that double the rate of expansion <strong>in</strong> the first six quarters of "recovery" from the 2001 recession.<br />
Moreover, the strength of this resurgence appears to have f<strong>in</strong>ally provided enough traction to keep<br />
the economy on a trajectory of faster-than-normal growth <strong>in</strong> the com<strong>in</strong>g year. We rema<strong>in</strong> optimistic<br />
that the economy can cont<strong>in</strong>ue to generate growth of around 4% through the first half of <strong>2004</strong> before<br />
retreat<strong>in</strong>g modestly <strong>in</strong> the second half.<br />
(2)
Nomura <strong>Fixed</strong> <strong>Income</strong> Research<br />
U.S. Economic <strong>Outlook</strong><br />
9<br />
8<br />
7<br />
Actual<br />
CPI Inflation<br />
Real GDP Growth (annualized quarterly rate)<br />
Real GDP Growth (4-Quarter)<br />
Percent<br />
6<br />
5<br />
4<br />
Forecast<br />
3<br />
2<br />
1<br />
0<br />
<strong>2003</strong>Q1 <strong>2003</strong>Q3 <strong>2004</strong>Q1 <strong>2004</strong>Q3 2005Q1 2005Q3<br />
The greater balance of aggregate demand across the economy's key sectors is also likely to persist<br />
<strong>in</strong> the year ahead. Ow<strong>in</strong>g ma<strong>in</strong>ly to the <strong>in</strong>evitable "payback" for the strong sales pace of the third<br />
quarter, consumer spend<strong>in</strong>g is track<strong>in</strong>g a seem<strong>in</strong>gly anemic growth of about 1.5% <strong>in</strong> the fourth<br />
quarter. Except for the drop <strong>in</strong> vehicle sales, however, spend<strong>in</strong>g on other consumer goods and<br />
services appears to be ris<strong>in</strong>g at a healthy and susta<strong>in</strong>able pace. The <strong>2003</strong> tax cuts will deliver a<br />
second punch early next year as people claim refunds for overpaid taxes dur<strong>in</strong>g the past year. Most<br />
importantly, however, the improvement <strong>in</strong> labor market conditions should cont<strong>in</strong>ue to generate the<br />
<strong>in</strong>come needed to fuel household spend<strong>in</strong>g. Six months ago, we argued that employment conditions<br />
MUST improve for our rather sangu<strong>in</strong>e forecast for the second half of <strong>2003</strong> and beyond to become<br />
reality. Fortuitously, the job market appears to be rega<strong>in</strong><strong>in</strong>g its vitality. Four straight <strong>in</strong>creases have<br />
lifted nonfarm payrolls some 320,000. Data drawn from the household survey <strong>in</strong>dicates the<br />
improvement may be much better than implied by the establishment survey. The unemployment rate,<br />
for <strong>in</strong>stance, has fallen 0.5% from its June <strong>2003</strong> peak.<br />
By shor<strong>in</strong>g up expectations that consumer spend<strong>in</strong>g will rema<strong>in</strong> strong, a stronger labor market<br />
should also help fuel a cont<strong>in</strong>u<strong>in</strong>g revival <strong>in</strong> capital spend<strong>in</strong>g. The three-year slump <strong>in</strong> capital<br />
spend<strong>in</strong>g has left much of the <strong>in</strong>dustry strapped with outmoded equipment that firms will be anxious<br />
to replace now that overall demand is strengthen<strong>in</strong>g. Not only are bus<strong>in</strong>esses cont<strong>in</strong>u<strong>in</strong>g to <strong>in</strong>vest <strong>in</strong><br />
new plant and equipment, they f<strong>in</strong>ally seem ready to replenish <strong>in</strong>ventories that have been depleted to<br />
historically low levels relative to sales. Bus<strong>in</strong>esses already appear to have taken the lead <strong>in</strong> growthenhanc<strong>in</strong>g<br />
activity. Nonetheless, even at the double-digit growth <strong>in</strong> bus<strong>in</strong>ess <strong>in</strong>vestment that we<br />
foresee, such spend<strong>in</strong>g will rema<strong>in</strong> below the third quarter 2000 peak until the fourth quarter of next<br />
year.<br />
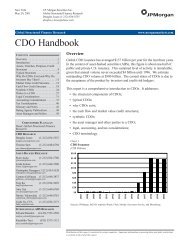
Stronger bus<strong>in</strong>ess <strong>in</strong>vestment will counteract the expected decl<strong>in</strong>e <strong>in</strong> residential <strong>in</strong>vestment.<br />
Respond<strong>in</strong>g to the faster growth <strong>in</strong> real output, market <strong>in</strong>terest rates are projected to move higher,<br />
cool<strong>in</strong>g the superheated hous<strong>in</strong>g market. After yet another record year, sales of new and exist<strong>in</strong>g<br />
homes are likely to fall off but rema<strong>in</strong> at levels that still rank as historically high. As a legacy of<br />
historically low mortgage rates <strong>in</strong> recent years, the proportion of households own<strong>in</strong>g their own homes<br />
has risen to an all-time high, averag<strong>in</strong>g 68.2% this year. Regionally, the West recorded the biggest<br />
(0.9%) <strong>in</strong>crease <strong>in</strong> ownership. Low mortgage rates, which have <strong>in</strong>creased "affordability," appear to<br />
(3)
Nomura <strong>Fixed</strong> <strong>Income</strong> Research<br />
have encouraged household to acquire their own home earlier. Thus, the ownership rate of<br />
households headed by the young (under 35) is up 0.7% so far <strong>in</strong> <strong>2003</strong>, while rates among other age<br />
cohorts have changed little. As a result, the vacancy rate for rental homes has risen to a record high<br />
9.9%. These data suggest that the forecasted upward drift <strong>in</strong> mortgage rates could slow or even<br />
reverse these trends. If so, it should help improve the credit quality of multi-family rental properties.<br />
Ownership Increases Rental Vacancies<br />
43<br />
10.0<br />
Ownership Rate (under 35 years) (%)<br />
42<br />
41<br />
40<br />
39<br />
38<br />
Ownership Rate (under 35 years) (left scale)<br />
Rental Vacancy Rate (right scale)<br />
9.5<br />
9.0<br />
8.5<br />
8.0<br />
7.5<br />
Rental Vacancy Rate (%)<br />
37<br />
1993 1994 1995 1996 1997 1998 1999 2000 2001 2002 <strong>2003</strong><br />
7.0<br />
Despite the stronger growth we envision for the year ahead, we expect <strong>in</strong>flation pressures to rema<strong>in</strong><br />
dormant. The complex of factors that have enhanced labor efficiency rema<strong>in</strong> <strong>in</strong>tact and though<br />
productivity growth is likely to moderate, its cont<strong>in</strong>ued strength will mitigate aga<strong>in</strong>st an early<br />
resumption of <strong>in</strong>flation pressures. Moreover, the surfeit of underutilized resources both here and<br />
abroad is likely to dim<strong>in</strong>ish only gradually. Until the economy fully absorbs that excess productive<br />
slack it can grow at a rapid rate without encounter<strong>in</strong>g <strong>in</strong>flation-caus<strong>in</strong>g stra<strong>in</strong>s. Consequently, the<br />
forecast highlights a comb<strong>in</strong>ation of low <strong>in</strong>flation and strong economic growth, rem<strong>in</strong>iscent of<br />
recoveries follow<strong>in</strong>g the contractions of 1958 and 1961.<br />
Rate Forecast<br />
End of June <strong>2004</strong> End of December <strong>2004</strong><br />
Federal Funds Rate 1.00% 1.00%<br />
2-year Treasuries 2.55% 3.10%<br />
10-year Treasuries 4.65% 5.00%<br />
B. Interest Rate <strong>Outlook</strong><br />
As the pace of economic activity has accelerated, market <strong>in</strong>terest rates have edged higher. So far,<br />
these <strong>in</strong>creases have not been especially severe, <strong>in</strong> part, because the markets seem confident that<br />
<strong>in</strong>flation will rema<strong>in</strong> low. Our forecasted path of long-term <strong>in</strong>terest rates mirrors a similar judgment<br />
about one of the two key determ<strong>in</strong>ants of nom<strong>in</strong>al <strong>in</strong>terest rates. Follow<strong>in</strong>g the <strong>in</strong>sight attributed to<br />
Irv<strong>in</strong>g Fisher, nom<strong>in</strong>al <strong>in</strong>terest rates can be dissected <strong>in</strong>to two constituent elements: a "real" <strong>in</strong>terest<br />
rate, which over time is determ<strong>in</strong>ed by the economy's long-run growth potential; and, a premium to<br />
compensate for the loss of purchas<strong>in</strong>g power caused by <strong>in</strong>flation. The phenomenal growth <strong>in</strong><br />
productivity <strong>in</strong> recent years warrants optimism that the economy has the potential to grow at a 3.5%<br />
rate, if not higher. As the cyclical pressures that have held real <strong>in</strong>terest rates below their long-run<br />
(4)
Nomura <strong>Fixed</strong> <strong>Income</strong> Research<br />
potential subside, real <strong>in</strong>terest rates will need to climb toward a rate consistent with potential growth<br />
to ensure that resources are efficiently allocated and to prevent <strong>in</strong>flationary imbalances. With the<br />
bus<strong>in</strong>ess expansion exert<strong>in</strong>g upward pressure on real <strong>in</strong>terest rates, nom<strong>in</strong>al long-term <strong>in</strong>terest rates<br />
are likely to climb gradually higher. At the same time, prospects that <strong>in</strong>flation will rema<strong>in</strong> subdued<br />
until the economy beg<strong>in</strong>s to bump <strong>in</strong>to capacity constra<strong>in</strong>ts should limit the rise <strong>in</strong> nom<strong>in</strong>al <strong>in</strong>terest<br />
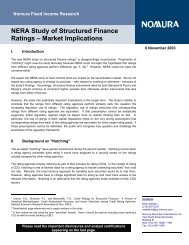
rates. However, the extraord<strong>in</strong>arily sharp gyrations <strong>in</strong> market <strong>in</strong>terest rates that have surfaced<br />
periodically dur<strong>in</strong>g the past two years reflects the <strong>in</strong>stability of perceptions about future <strong>in</strong>flation and<br />
growth. In the months ahead, the cyclical uptrend <strong>in</strong> <strong>in</strong>terest rates will rema<strong>in</strong> vulnerable to similar<br />
episodes of heightened volatility. Thus, it seems all but certa<strong>in</strong> that the path of long-term <strong>in</strong>terest<br />
rates will be more erratic than <strong>in</strong> our forecast, which primarily reflects our assessment of the<br />
implications of the growth and <strong>in</strong>flation path we envision. The accompany<strong>in</strong>g chart plots our basel<strong>in</strong>e<br />
projection and also a forecast range suggested by the <strong>in</strong>tra-quarter range of the recent past.<br />
7<br />
6<br />
Yield on 10-<strong>Year</strong> Treasury Notes<br />
(actual and projected)<br />
Intra-Quarter Range<br />
Quarterly Average<br />
Percent<br />
5<br />
4<br />
3<br />
2000Q1<br />
2000Q3<br />
2001Q1<br />
2001Q3<br />
2002Q1<br />
2002Q3<br />
<strong>2003</strong>Q1<br />
<strong>2003</strong>Q3<br />
<strong>2004</strong>Q1<br />
<strong>2004</strong>Q3<br />
2005Q1<br />
2005Q3<br />
Two other cyclical regularities are likely to characterize the structure of <strong>in</strong>terest rates with<strong>in</strong> and<br />
across asset classes. First, the profile of the yield curve is likely to shift considerably <strong>in</strong> the year<br />
ahead. For most of the next year, a steady monetary policy will anchor short-term rates. Though<br />
short-term rates also tend toward a long-run equilibrium, they typically respond more violently than<br />
long-term rates to actual or perceived cyclical shifts. Near turn<strong>in</strong>g po<strong>in</strong>ts, the money markets often<br />
become preoccupied with the tim<strong>in</strong>g of a shift <strong>in</strong> monetary policy. In anticipation of expected policy<br />
moves or <strong>in</strong> response to unexpected ones, short-term rates move more closely with changes <strong>in</strong><br />
monetary policy than do long-term rates. The Federal Open Market Committee has reaffirmed a<br />
commitment to ma<strong>in</strong>ta<strong>in</strong> an accommodative policy "for a considerable period." S<strong>in</strong>ce our forecast<br />
implies it will be some time before demand will beg<strong>in</strong> to stra<strong>in</strong> productive capacity and beg<strong>in</strong> to pose<br />
a threat of <strong>in</strong>flation, we expect this "considerable period" to last throughout the com<strong>in</strong>g year. While<br />
policy limits the movement of yields at the shortest end of the curve, longer maturities will rise <strong>in</strong><br />
anticipation of the <strong>in</strong>evitable tighten<strong>in</strong>g of monetary policy. Generally, the bus<strong>in</strong>ess cycle generates<br />
larger departures from "normal" for shorter-term securities. Consequently, yields at this segment of<br />
the yield curve are currently further below their long-run equilibrium. Yields over <strong>in</strong>termediate (2- to<br />
5-year) horizons will probably rise more sharply than yields on securities with longer maturities (10- to<br />
30-year). Thus, the cyclical expansion should be associated with a flatten<strong>in</strong>g of the yield curve.<br />
Specifically, we expect the spread between 2- and 10-year Treasury notes to decl<strong>in</strong>e from an<br />
unprecedented third quarter average of 255 bp to about 175 bp by the end of <strong>2004</strong>. Even this lower<br />
spread would be nearly double the long-run average spread of about 89 bp, but it would be more<br />
typical of the yield curve configuration dur<strong>in</strong>g the early phase of an economic expansion.<br />
A second cyclical regularity is the compression of credit risk premiums. A strengthen<strong>in</strong>g economy<br />
can be expected to reduce bankruptcy and default risks and generally enhance the credit quality of<br />
(5)
Nomura <strong>Fixed</strong> <strong>Income</strong> Research<br />
risky assets. That process has already begun. Default rates have begun to recede, and credit risk<br />
spreads have narrowed considerably. As the recovery ga<strong>in</strong>s <strong>in</strong>tensity <strong>in</strong> the year ahead, improved<br />
corporate performance could be expected to foster further compression of credit risk premia.<br />
The Yield Curve: Average of Monthly Spreads 1982-Present<br />
3 mo 1-yr 2-yr 3-yr 5-yr<br />
3mo --<br />
1yr 45 --<br />
2y 91 46 --<br />
3y 113 68 22 --<br />
5y 145 100 54 32 --<br />
10y 180 135 89 67 35<br />
(6)
Nomura <strong>Fixed</strong> <strong>Income</strong> Research<br />
II.<br />
Themes and Cross Market Strategy<br />
for the First Half of <strong>2004</strong><br />
David Jacob (212) 667-2255<br />
In our view, the overrid<strong>in</strong>g theme for the fixed <strong>in</strong>come markets at the start of <strong>2004</strong> is this: The<br />
economic recovery cont<strong>in</strong>ues to generate growth without significantly <strong>in</strong>creas<strong>in</strong>g <strong>in</strong>flation. On<br />
balance, the Fed's accommodative monetary policy and the President's tax cuts are work<strong>in</strong>g. Both<br />
consumers and bus<strong>in</strong>esses cont<strong>in</strong>ue to spend. Bus<strong>in</strong>esses are start<strong>in</strong>g to hire more workers. The<br />
equity markets are up, credit quality is improv<strong>in</strong>g, and core <strong>in</strong>flation has reached a 40-year low. If the<br />
economy holds a steady course, even further trouble <strong>in</strong> the Middle East probably would not derail the<br />
re-election of the President. In sum, we expect the first half of <strong>2004</strong> to be benign for the fixed <strong>in</strong>come<br />
markets.<br />
Our economic forecast calls for a mid-<strong>2004</strong> <strong>in</strong>terest rate environment as follows: 4.65% on 10-year<br />
Treasuries, 2.55% on 2-year Treasuries, and 1.00% on Fed Funds. Our economic forecast also calls<br />
for GDP to grow at a rate of 4% dur<strong>in</strong>g the first half of the year. Aga<strong>in</strong>st this backdrop, we present<br />
our themes for the next six months:<br />
1. The recovery cont<strong>in</strong>ues to generate growth<br />
2. Consumer spend<strong>in</strong>g cont<strong>in</strong>ues due to a stronger labor market<br />
3. Bus<strong>in</strong>ess <strong>in</strong>vestment <strong>in</strong> plant and equipment grows<br />
4. Credit quality improves <strong>in</strong> the corporate sector<br />
5. Residential ref<strong>in</strong>anc<strong>in</strong>g wave ends<br />
6. Interest rate volatility decl<strong>in</strong>es<br />
7. Inflation rema<strong>in</strong>s tame<br />
8. Interest rates <strong>in</strong>crease modestly and the curve flattens a bit (2/10 spread)<br />
9. Forward rates are overstat<strong>in</strong>g future rates<br />
10. Commercial real estate lags <strong>in</strong> the recovery<br />
From the standpo<strong>in</strong>t of a U.S. fixed <strong>in</strong>come <strong>in</strong>vestor, our themes imply three ma<strong>in</strong> trade ideas and two<br />
secondary ones:<br />
1. Trade down <strong>in</strong> credit<br />
2. Keep on a carry trade<br />
3. Position portfolio slightly short of duration targets<br />
4. Sell volatility<br />
5. Buy out-of-the money caps<br />
<strong>Fixed</strong> <strong>in</strong>come <strong>in</strong>vestors should rema<strong>in</strong> m<strong>in</strong>dful that <strong>in</strong>terest rates might have reached their cyclical<br />
lows <strong>in</strong> <strong>2003</strong>. Thus, from a duration standpo<strong>in</strong>t, <strong>in</strong>vestors should be slightly short their duration<br />
target. We emphasize "slightly," because we do not expect <strong>in</strong>terest rates to rise as much as the<br />
forward market suggests that they will. Given a tame <strong>in</strong>flation forecast, we expect the Fed to<br />
ma<strong>in</strong>ta<strong>in</strong> its current posture for some time. This means that <strong>in</strong>vestors should be able to benefit from a<br />
carry trade – f<strong>in</strong>anc<strong>in</strong>g longer duration assets with short-term borrow<strong>in</strong>gs – dur<strong>in</strong>g the first half of<br />
<strong>2004</strong>. An <strong>in</strong>vestor whose goal is to maximize total rate of return should favor bonds that roll down the<br />
duration curve to garner excess return.<br />
In the corporate bond sector, we feel that the down-<strong>in</strong>-credit trade is attractive because we expect<br />
corporate credit quality to improve, boost<strong>in</strong>g the ratio of upgrades to downgrades. Moreover, despite<br />
the seem<strong>in</strong>gly tight spread levels now, historically spreads have been tighter. In our view this,<br />
comb<strong>in</strong>ed with the supply-demand equation, will lead corporate spreads tighter yet.<br />
Across all sectors, we believe that credit quality improvement has so far been concentrated <strong>in</strong><br />
stronger credits. Thus, an <strong>in</strong>vestor who is restricted to <strong>in</strong>vestment-grade securities should heighten<br />
his focus on securities <strong>in</strong> the triple-B-m<strong>in</strong>us range. While spreads on such securities have already<br />
tightened markedly, there is still room for them to tighten further before they reach their long-term<br />
historic tightest levels. Of course, particular caution is warranted as one reaches down to<br />
(7)
Nomura <strong>Fixed</strong> <strong>Income</strong> Research<br />
triple-B-m<strong>in</strong>us credit level. Keen security-specific selection skills are required to avoid the land<br />
m<strong>in</strong>es.<br />
In our view, premium-priced MBS are too expensive; current spread levels do not fully compensate<br />
<strong>in</strong>vestors for prepayment risk. If <strong>in</strong>terest rates, on their upward march, were to temporarily dip below<br />
4%, some re-f<strong>in</strong>anc<strong>in</strong>g activity probably would emerge, which could hurt the performance of premium<br />
MBS. We perceive that many MBS <strong>in</strong>vestors have already positioned themselves for a rise <strong>in</strong> <strong>in</strong>terest<br />
rates. Their fear of extension risk has bid-up premium-priced MBS. However, they may have<br />
underestimated the possibility of a dip.<br />
We feel that residential mortgage credit quality is <strong>in</strong> reasonable shape. While we do not expect home<br />
prices to cont<strong>in</strong>ue grow<strong>in</strong>g at the rapid pace of the past few years, neither do we expect them to<br />
collapse, particularly given our forecast of moderate <strong>in</strong>terest rates and an improv<strong>in</strong>g labor market.<br />
Thus, a down-<strong>in</strong>-credit trade from agency MBS to private-label product may make sense. However,<br />
two notes of caution: First, credit enhancement levels on private-label MBS are quite low <strong>in</strong> historical<br />
terms. The absolute levels of protection leave little marg<strong>in</strong> for error. Second, as we move toward a<br />
higher-rate environment, mortgage brokers who miss the high orig<strong>in</strong>ation volumes of recent years<br />
may try to qualify, un-creditworthy borrowers.<br />
The weak commercial real estate markets <strong>in</strong> a recover<strong>in</strong>g economy lead to a more complicated<br />
analysis for CMBS. Commercial real estate generally lags the rest of the economy. Accord<strong>in</strong>gly, we<br />
expect greater improvement to arrive <strong>in</strong> 2005 than <strong>in</strong> <strong>2004</strong>.<br />
Bush re-election with improv<strong>in</strong>g economy should lead to further bus<strong>in</strong>ess growth and more rate rise <strong>in</strong><br />
2005.<br />
First Half <strong>2004</strong> Market Sector Weight<strong>in</strong>gs<br />
Treasuries<br />
Underweight<br />
Agency Debt<br />
Neutral<br />
Residential MBS<br />
Slight Underweight<br />
Corporate Bonds<br />
Overweight<br />
ABS<br />
Overweight<br />
CMBS<br />
Slight Underweight<br />
(8)
Nomura <strong>Fixed</strong> <strong>Income</strong> Research<br />
Trade Ideas for the First Half of <strong>2004</strong><br />
• Corporate Bonds<br />
○ Trade down <strong>in</strong> credit to quality BBB bonds.<br />
○ Buy autos from all maturities. Our top recommendation is Ford Motor Credit, followed by<br />
GMAC and then by Chrysler.<br />
○ Industrials: buy GE and Boe<strong>in</strong>g<br />
○ Information Technology: buy Hewlett-Packard<br />
○ Media: buy Time Warner and Disney<br />
○ Food: buy Altria (maturities 36 months and less) and Kraft<br />
○ Domestic long distance providers: sell Spr<strong>in</strong>t and AT&T.<br />
• Residential MBS<br />
○ Buy/slight overweight 30-yr TBA 5s and 5.5s (FNMA, GOLD, and GNMA II only, note<br />
that this recommendation applies to roll accounts only)<br />
○ Buy/slight overweight 15-yr TBA 4.5s and 5s (FNMA and GOLD only, note that this<br />
recommendation applies to roll accounts only)<br />
○ Buy/overweight conventional low loan balance and new WALA/low WAC 6s and 6.5s<br />
○ Buy/overweight 6.5% and 7% passthroughs backed by FHA/VA reperform<strong>in</strong>g<br />
mortgages<br />
○ Buy/overweight well-structured 7/10-<strong>Year</strong> PACs backed by conventional 4.5s<br />
○ Buy/overweight GNMA (I and II) Buydown 6s & 6.5s<br />
○ Sell/underweight conventional TBA 6s, 6.5s, and 7s<br />
○ Sell/underweight conventional 4.5% passthroughs<br />
○ Sell/underweight GNMA TBA 6s & 6.5s<br />
○ Avoid IOs backed by 6% and 6.5% collateral<br />
• Commercial MBS<br />
○ In the <strong>in</strong>vestment grade sector, trade down <strong>in</strong> credit. The best spot will be BBB- from new<br />
issue deals. The most spread tighten<strong>in</strong>g will be <strong>in</strong> new issue sub-<strong>in</strong>vestment grade bonds.<br />
○ Sell seasoned lower rated CMBS because they may experience downgrades and losses<br />
as del<strong>in</strong>quencies <strong>in</strong>crease <strong>in</strong> <strong>2004</strong>. Investors are not be<strong>in</strong>g compensated <strong>in</strong> premium<br />
priced triple-A-rated CMBS. Front pay triple-A-rated bonds from 2000 v<strong>in</strong>tage should be<br />
avoided.<br />
• ABS<br />
○<br />
○<br />
○<br />
Buy triple-A-rated 5-year fixed rate home equity ABS.<br />
For more aggressive <strong>in</strong>vestors, favor subord<strong>in</strong>ate and mezzan<strong>in</strong>e HELs from top-tier<br />
issuers. Also, consider new issue manufactured hous<strong>in</strong>g and short-maturity exotics.<br />
Avoid subord<strong>in</strong>ate and mezzan<strong>in</strong>e tranches from lower-tier HEL issuers.<br />
(9)
Nomura <strong>Fixed</strong> <strong>Income</strong> Research<br />
III.<br />
Corporate Bonds<br />
A. <strong>Outlook</strong> for the first half of <strong>2004</strong><br />
1. Spreads<br />
Trey Ott (212) 667-9521<br />
Market momentum po<strong>in</strong>ts to a cont<strong>in</strong>ued bull market for corporate bonds <strong>in</strong> the first half of <strong>2004</strong>. It is<br />
unlikely that the high 10.4% return seen over the past 11 months can be susta<strong>in</strong>ed, but with strong<br />
technicals and cont<strong>in</strong>ued improvement <strong>in</strong> corporate profits, our outlook for the corporate bond market<br />
is very positive. With the market flush with cash, decl<strong>in</strong><strong>in</strong>g supply and expectations of cont<strong>in</strong>ued<br />
economic improvement should drive spread compression <strong>in</strong> the months ahead.<br />
One of the largest drivers of spread compression <strong>in</strong> the first half of <strong>2004</strong> will likely be the technical<br />
component of the corporate bond market. Not only are <strong>in</strong>vestors hold<strong>in</strong>g a larger than desired<br />
amount of cash, we also expect supply to lag demand, compound<strong>in</strong>g the effect. This compound<strong>in</strong>g<br />
will exert technical pressure on already tight spreads as <strong>in</strong>vestors chase an ever-decreas<strong>in</strong>g number<br />
of bonds. The lower supply of new issuance will primarily result from several reasons. First, issuers<br />
do not need capital to fund fixed asset <strong>in</strong>vestment. Second, pre-fund<strong>in</strong>g of short-term maturities has<br />
decl<strong>in</strong>ed s<strong>in</strong>ce <strong>in</strong>terest rates are expected to rema<strong>in</strong> low. Third, the shift <strong>in</strong> capital structure from<br />
short-term to long-term debt has played out. In fact, accord<strong>in</strong>g to the Federal Reserve, outstand<strong>in</strong>g<br />
commercial paper is at its lowest level <strong>in</strong> 11 years, down from its peak <strong>in</strong> November 2000. F<strong>in</strong>ally,<br />
pension fund issues are abat<strong>in</strong>g. Additionally, on a monthly basis, we expect corporate bond<br />
issuance to average $38 billion, below the $41 billion that <strong>in</strong>vestors will receive <strong>in</strong> <strong>2004</strong> from coupon<br />
<strong>in</strong>terest and matur<strong>in</strong>g debt.<br />
Fundamentally, corporations cont<strong>in</strong>ue to improve. Over the last 18 months stronger fundamentals<br />
have been a larger driver of spreads than they will likely be <strong>in</strong> the early months of <strong>2004</strong>. However,<br />
cont<strong>in</strong>ued improvement should support spread tighten<strong>in</strong>g. As the chart below reflects, <strong>in</strong>ternally<br />
generated funds have <strong>in</strong>creased to highs not realized s<strong>in</strong>ce the fourth quarter of 2001. Meanwhile,<br />
capex has fallen to levels associated with the first quarter of 2002. Companies have cont<strong>in</strong>ued to<br />
generate cash, but have not been rushed to spend or <strong>in</strong>vest it. With a f<strong>in</strong>anc<strong>in</strong>g gap of almost zero,<br />
companies are not required to tap the capital markets to fund expenditures, <strong>in</strong>dicat<strong>in</strong>g a more<br />
conservative capital structure and f<strong>in</strong>ancial policy. As we mentioned, we expect this to cont<strong>in</strong>ue at<br />
least <strong>in</strong> the near term until solid evidence <strong>in</strong>dicates that the U.S. is expand<strong>in</strong>g for at least 12 months.<br />
Internally Generated Funds vs. Capex and F<strong>in</strong>anc<strong>in</strong>g Gap<br />
1,000<br />
950<br />
900<br />
850<br />
800<br />
750<br />
700<br />
650<br />
600<br />
1996<br />
1997<br />
1998<br />
1999<br />
2000<br />
2001<br />
2002<br />
Q1 - 2001<br />
Q2 - 2001<br />
Q3 - 2001<br />
Q4 - 2001<br />
Q1 - 2002<br />
Q2 - 2002<br />
Q3 - 2002<br />
Q4 - 2002<br />
Q1 - <strong>2003</strong><br />
Q2 - <strong>2003</strong><br />
Billions ($)<br />
350<br />
290<br />
230<br />
170<br />
110<br />
50<br />
Billions ($)<br />
-10<br />
Internal Funds Capex F<strong>in</strong>anc<strong>in</strong>g Gap (right scale)<br />
(10)
Nomura <strong>Fixed</strong> <strong>Income</strong> Research<br />
Although spreads are tight on a 5-year historical basis, spreads are still much wider than the tightest<br />
they have traded <strong>in</strong> the last 10-15 years. Over the past 18 months, average spreads have tightened<br />
80bp, with 55bp of that occurr<strong>in</strong>g <strong>in</strong> <strong>2003</strong>. With expectations high and positive event risk already<br />
embedded <strong>in</strong> current spreads we expect most credits to trade on average tighter by another 10-15<br />
bp.<br />
Another enabler of spread tighten<strong>in</strong>g is the low current Treasury rates. Due to the historically low<br />
rates, the corporate spread, as a percentage of total yield, is much greater now than <strong>in</strong> the past.<br />
When spreads were this tight ten years ago, the Treasury basis was higher and as a result, the<br />
<strong>in</strong>cremental corporate spread was a much smaller component of the total yield. For example, a<br />
typical ten-year corporate bond trades at a 75 bp spread to Treasuries. The Treasury is yield<strong>in</strong>g<br />
4.28%. Therefore, the spread component of the yield is 15% of the 5.03% total yield. Ten years ago<br />
the total yield was 5.73%, of which the 75 bp spread on the corporate accounted for 13% of the total<br />
yield.<br />
2. Issuance<br />
We anticipate corporate bond issuance of approximately $450 billion <strong>in</strong> <strong>2004</strong>, well below the $521<br />
billion placed <strong>in</strong> <strong>2003</strong>. On average we expect issuance to run about $38 billion a month compared to<br />
the $44 billion issued <strong>in</strong> <strong>2003</strong>. At the same time, we expect demand to rema<strong>in</strong> strong over the next<br />
several months.<br />
For <strong>2004</strong>, we do not expect the many factors that <strong>in</strong>creased issuance <strong>in</strong> <strong>2003</strong> to rema<strong>in</strong> or recur.<br />
Over the past year, historically low <strong>in</strong>terest rates drove a shift <strong>in</strong> balance sheet structure from shortterm<br />
to long-term debt, propell<strong>in</strong>g issuance well above our <strong>in</strong>itial expectations. Outstand<strong>in</strong>g<br />
commercial paper is at its lowest s<strong>in</strong>ce 1992. Accord<strong>in</strong>g to the Federal Reserve, $126.8 billion was<br />
outstand<strong>in</strong>g <strong>in</strong> November <strong>2003</strong> compared to the historical high of $315.3 billion <strong>in</strong> November 2000.<br />
Some issuers, tak<strong>in</strong>g cues from the improv<strong>in</strong>g economy and ahead of any <strong>in</strong>flationary pressure and<br />
higher <strong>in</strong>terest rates, came to market <strong>in</strong> <strong>2003</strong> to lock <strong>in</strong> low rates, essentially pre-fund<strong>in</strong>g maturities<br />
through <strong>2004</strong>.<br />
For example, Ford Motor Company over-funded Ford Motor Credit by $18.0 billion, partly through the<br />
corporate bond market. Also, General Motors raised $14.0 billion to partially cure its under-funded<br />
pension plan. These two issuers accounted for 5% of the overall market <strong>in</strong> <strong>2003</strong>.<br />
In <strong>2003</strong> there was an unusual environment that promoted the issuance of corporate bonds that will<br />
not likely persist <strong>in</strong>to the first few months of <strong>2004</strong>. 1) In an environment of cont<strong>in</strong>ued low <strong>in</strong>terest<br />
rates, companies are not expected to pre-fund as much future debt as they have already and 2) as<br />
the stock market cont<strong>in</strong>ues to advance, many companies will likely tap the equity market <strong>in</strong>stead of<br />
the bond market for <strong>in</strong>vestment capital. 3) F<strong>in</strong>ally, the shift from short-term to long-term debt is likely<br />
complete by <strong>in</strong> large. As these reasons for issu<strong>in</strong>g more debt decl<strong>in</strong>e, we expect issuance to fall as<br />
well.<br />
As noted, we expect corporate bond new issuance <strong>in</strong> <strong>2004</strong> to be about $450 billion, well below the<br />
$521 billion raised <strong>in</strong> the bond market <strong>in</strong> <strong>2003</strong>. We assume that at least 10-15% of the issuance <strong>in</strong><br />
<strong>2003</strong> was due to companies opportunistically com<strong>in</strong>g to market to raise capital at low <strong>in</strong>terest rates,<br />
primarily to pre-fund maturities for the next 12-18 months, or to term out or lengthen short-term debt.<br />
General Electric termed out $30 billion of short-term debt alone. Companies like General Motors<br />
used the bond market to fund contributions to under-funded pensions. At the close of <strong>2003</strong>, the<br />
term<strong>in</strong>g out is mostly completed, the shift to long-term debt is decl<strong>in</strong><strong>in</strong>g and pension returns are<br />
improv<strong>in</strong>g with a recover<strong>in</strong>g economy. Additionally, <strong>in</strong> our op<strong>in</strong>ion, many companies will <strong>in</strong>creas<strong>in</strong>gly<br />
use the equity market as a means to fund <strong>in</strong>vestment <strong>in</strong> capital projects and expansion rather than<br />
the bond market, each of which will dim<strong>in</strong>ish the need to raise capital via the bond market.<br />
(11)
Nomura <strong>Fixed</strong> <strong>Income</strong> Research<br />
3. Credit<br />
We expect credit to ma<strong>in</strong>ta<strong>in</strong> its current trajectory of improv<strong>in</strong>g fundamentals. The bulk of<br />
improvement has been achieved over the past 18 months, and an improv<strong>in</strong>g stock market and<br />
economy should further bolster balance sheets. Programs put <strong>in</strong> place <strong>in</strong> <strong>2003</strong> to improve the capital<br />
structure and lower overall risk, are expected to cont<strong>in</strong>ue through the first half of <strong>2004</strong>. We expect<br />
some expansionary capital expenditures, but companies' risk tolerance should still be low at least <strong>in</strong><br />
the first few months, until new plans for growth can be drawn up. Expansionary capital expenditures<br />
are likely to have low risk and approached cautiously, at least <strong>in</strong> the first quarter, until economic<br />
growth is assured.<br />
One of the key components of credit improvement should come from decl<strong>in</strong><strong>in</strong>g pension fund losses.<br />
Over the past 11 months, many pension funds have realized <strong>in</strong>vestment returns <strong>in</strong> excess of 15%.<br />
General Motors is expected to earn an <strong>in</strong>vestment return of 20% for the 12 months ended 12/31/03.<br />
This is far greater than it's expected 9% return. Although returns <strong>in</strong> excess of 15% do not appear<br />
realistic over the long-term, if the economy cont<strong>in</strong>ues to improve, stock market performance should<br />
likewise be strong and under-funded pension liabilities should beg<strong>in</strong> to subside. Boe<strong>in</strong>g, Ford and<br />
most other large <strong>in</strong>dustrial companies should see the same benefit. This means more cash flow from<br />
operations could go towards re<strong>in</strong>vestment <strong>in</strong> the bus<strong>in</strong>ess <strong>in</strong>stead of reduc<strong>in</strong>g an under-funded<br />
pension liability.<br />
F<strong>in</strong>ally, we look to the rat<strong>in</strong>g agencies for <strong>in</strong>dications of future credit performance. The chart below<br />
graphs the ratio of negative credit watch list<strong>in</strong>g and the ratio of actual negative rat<strong>in</strong>g changes. As<br />
you can see from the chart, the movement of actual downgrades follows the shift <strong>in</strong> credit watches by<br />
about 18 months, which has been relatively consistent s<strong>in</strong>ce 1994. Thus, accord<strong>in</strong>g to the chart, it<br />
appears that as credit watch list<strong>in</strong>gs decl<strong>in</strong>ed <strong>in</strong> <strong>2003</strong> there should be a correspond<strong>in</strong>g decl<strong>in</strong>e <strong>in</strong><br />
downgrades that follows over the next several quarters. This makes sense, as one can assume that<br />
over the last 24 months the economy has likely culled the weaker players, leav<strong>in</strong>g only stronger<br />
corporations stand<strong>in</strong>g.<br />
S&P Rat<strong>in</strong>g Negative Credit Watch Ratio compared to Actual Negative Rat<strong>in</strong>g Change<br />
9<br />
8<br />
7<br />
6<br />
Ratio<br />
5<br />
4<br />
3<br />
2<br />
1<br />
0<br />
1994-Q4<br />
1995-Q4<br />
1996-Q4<br />
1997-Q4<br />
1998-Q4<br />
1999-Q4<br />
2000-Q4<br />
2001-Q4<br />
2002-Q4<br />
<strong>2003</strong>-Q4<br />
Credit Watch Ratio<br />
Actual Rat<strong>in</strong>g Change Ratio<br />
4. Recommendations<br />
Our overall strategy is that <strong>in</strong>vestors cont<strong>in</strong>ue to pick up additional yield by <strong>in</strong>vest<strong>in</strong>g <strong>in</strong> the lower<br />
quality triple-B credits. In our view, this strategy will outperform as the economy gets better, company<br />
fundamentals improve and technical factors play out. As of December 1st, the spread differential<br />
between a s<strong>in</strong>gle-A corporate bond and a triple-B corporate bond accord<strong>in</strong>g to Merrill Lynch was a<br />
(12)
Nomura <strong>Fixed</strong> <strong>Income</strong> Research<br />
very attractive 53 bp. Although this spread has tightened from 123 bp <strong>in</strong> December 2002 accord<strong>in</strong>g<br />
to their <strong>in</strong>dex, it is still much wider than the tightest spread of 23 bp as of December 1996. Therefore,<br />
we believe there is an opportunity for additional tighten<strong>in</strong>g until the <strong>in</strong>herent risk outweighs<br />
compensation for tak<strong>in</strong>g that risk.<br />
a) Recommended Buys<br />
(1) Autos – All Maturities<br />
We expect automotive manufacturer bonds to be the highest perform<strong>in</strong>g sector <strong>in</strong> the first half of<br />
<strong>2004</strong>. Bonds from Ford and General Motors are currently the widest trad<strong>in</strong>g credits <strong>in</strong> the triple-B<br />
<strong>in</strong>dex. As we mentioned <strong>in</strong> our October 17, <strong>2003</strong> Ford Motor Company and Ford Motor Credit report,<br />
we th<strong>in</strong>k auto company bonds are yield<strong>in</strong>g a disproportionate amount of return to their associated<br />
risks. Automakers have proven that they can survive <strong>in</strong> a tough economy, and although they are<br />
los<strong>in</strong>g market share to their Asian competitors, 61% of U.S. consumers still choose to buy one of the<br />
"Big 3" cars or trucks over competitive vehicles.<br />
Over the next few months, all of the manufacturers will be roll<strong>in</strong>g out new products <strong>in</strong> every category.<br />
GM is launch<strong>in</strong>g several crossover vehicles <strong>in</strong> addition to several mid-size sedans to compete with<br />
Honda's Accord and Toyota's Camry. Ford recently launched its new F-series that cont<strong>in</strong>ues to w<strong>in</strong><br />
automotive awards and accolades while ma<strong>in</strong>ta<strong>in</strong><strong>in</strong>g strong sales, as evidenced by a 10% growth <strong>in</strong><br />
unit sales <strong>in</strong> November <strong>2003</strong>. Cost restructur<strong>in</strong>g programs and recently negotiated labor contracts<br />
should cont<strong>in</strong>ue to improve the automakers' bottom l<strong>in</strong>es. Creative market<strong>in</strong>g and aggressive<br />
promotions should cont<strong>in</strong>ue to help them ma<strong>in</strong>ta<strong>in</strong> a high level of automotive sales.<br />
Our top recommendation is Ford Motor Credit, followed by GMAC and then by Chrysler. We are not<br />
aggressively pursu<strong>in</strong>g DCX bonds because we view them as be<strong>in</strong>g more susceptible to negative<br />
headl<strong>in</strong>es right now. DCX is also beh<strong>in</strong>d the other manufacturers <strong>in</strong> terms of new product rollouts<br />
and has not yet successfully <strong>in</strong>tegrated Daimler with Chrysler. Although a scarcity value exists <strong>in</strong> the<br />
DCX bonds, we suggest only slightly over-weight<strong>in</strong>g the credit. Regard<strong>in</strong>g Ford, we recommend that<br />
<strong>in</strong>vestors play the yield curve and own the '08 sector when the spread differential between it and '13's<br />
is 25 bp or less. If the spread differential between the two is greater than 25 bp we recommend<br />
<strong>in</strong>vestors buy the '13's. Due to the current 33 bp differential we recommend that <strong>in</strong>vestors buy the<br />
Ford 7% of 2013 at a spread to Treasuries of 220 bp.<br />
For GMAC, we recommend that <strong>in</strong>vestors buy the 6.875% notes of 8/12 at Treasuries + 160 bp.<br />
Automotive Manufacturers – Spread to Treasuries<br />
Issuer<br />
10-year Benchmark Bond<br />
Ford Motor Credit (A3, outlook negative/BBB-, outlook stable)<br />
220 bp<br />
General Motors (A3, outlook negative/BBB, outlook negative)<br />
160 bp<br />
Daimler-Chrysler AG (A3, outlook negative/BBB, outlook negative) 160 bp<br />
(2) Media<br />
Time Warner (Baa1, outlook negative/BBB+, outlook negative) - Time Warner has been one of our<br />
top picks for the past 18 months. At current levels the bonds are beg<strong>in</strong>n<strong>in</strong>g to lose their relative<br />
value, but we still believe there is some room to tighten. Investors should expect to see several<br />
events drive the bonds tighter over the next six months. The cable IPO will lower debt by a further<br />
$2.5-$3.0 billion, br<strong>in</strong>g<strong>in</strong>g net debt to just below the year-end <strong>2004</strong> target of $20 billion. While<br />
resolution of the Department of Justice and SEC <strong>in</strong>vestigations is likely to yield a small f<strong>in</strong>ancial<br />
statement revision, resolution of the <strong>in</strong>vestigations should be a positive for the bonds. Poor results <strong>in</strong><br />
the AOL division will likely cont<strong>in</strong>ue to plague the company until they f<strong>in</strong>d a way to stem subscriber<br />
losses while ma<strong>in</strong>ta<strong>in</strong><strong>in</strong>g strong marg<strong>in</strong>s. AOL's new <strong>Net</strong>scape $9.99/month service should help stem<br />
subscriber losses, but profitability will likely decrease <strong>in</strong> that division. As each of these events occurs,<br />
we expect the company will get closer to rat<strong>in</strong>gs stability and perhaps even an upgrade over the next<br />
(13)
Nomura <strong>Fixed</strong> <strong>Income</strong> Research<br />
12-24 months. We would recommend <strong>in</strong>vestors buy the 7.70% bonds of 05/01/32 at Treasuries + 80<br />
bp.<br />
Disney (Baa1, outlook stable/BBB+, outlook negative) – Disney should have a strong year after<br />
beat<strong>in</strong>g expectations for its third quarter <strong>in</strong> <strong>2003</strong>. An improv<strong>in</strong>g economy should boost revenues and<br />
profits at its theme parks division. Although we cont<strong>in</strong>ue to expect headl<strong>in</strong>es regard<strong>in</strong>g the current<br />
CEO, Michael Eisner, and Roy Disney's fight for control over the company's future, it's ABC<br />
broadcast<strong>in</strong>g unit is expected to be profitable by 2005 due to higher ad dollars and <strong>in</strong>creased<br />
marg<strong>in</strong>s. The company's studio division is expected to perform well. The company's bonds have one<br />
of the largest <strong>in</strong>vestor bases <strong>in</strong> the world and, as such, Disney debt will likely cont<strong>in</strong>ue to trade <strong>in</strong> its<br />
current range go<strong>in</strong>g forward. We recommend the 6.375% of 3/12 at Treasuries + 60 bp.<br />
(3) Industrials<br />
General Electric (Aaa, stable/AAA, stable) – This is one of our perennial favorite <strong>in</strong>dustrial credits.<br />
Jeff Immelt, the company's CEO, launched a reorganization plan <strong>in</strong> the middle of <strong>2003</strong> through which<br />
the company will divest its slow grow<strong>in</strong>g bus<strong>in</strong>esses and acquire higher growth bus<strong>in</strong>esses. In<br />
October, the company announced its acquisition of Vivendi Enterta<strong>in</strong>ment that will enhance the NBC<br />
group. Also <strong>in</strong> November, the company announced its <strong>in</strong>tention to IPO the Insurance unit to remove<br />
the volatile effect it had on results. For the full year <strong>2004</strong>, the company projected EPS would be flat<br />
to <strong>2003</strong>, but promised double-digit growth <strong>in</strong> the years to follow. Regardless, the company has<br />
improved GE Capital's balance sheet through equity <strong>in</strong>jections to better reflect the triple-A rat<strong>in</strong>g. We<br />
expect GE bonds to perform <strong>in</strong> l<strong>in</strong>e with the economy overall, and recommend the GE 5.45% of<br />
1/15/13 at Treasuries + 60 bp.<br />
Boe<strong>in</strong>g Capital Corp. (A3, credit watch negative/A, outlook stable) – Amidst negative headl<strong>in</strong>es and<br />
bad press, Boe<strong>in</strong>g and Boe<strong>in</strong>g Capital Corp. is expected to generate over $1.5 billion <strong>in</strong> free cash<br />
flow <strong>in</strong> <strong>2003</strong>. This is cash generated by operations less capital expenditures, <strong>in</strong>terest expense and<br />
pension contributions. Additionally, the company is expected to generate $2.5 billion <strong>in</strong> free cash flow<br />
<strong>in</strong> <strong>2004</strong>. The new CEO Harry Stonecipher's first job is to resolve l<strong>in</strong>ger<strong>in</strong>g issues regard<strong>in</strong>g the<br />
missile defense program and the 767-tanker controversy. We have confidence that he will take care<br />
of this quickly so that the company can refocus on its next airl<strong>in</strong>er, the 7E7. Although the bonds are<br />
currently volatile, we expect volatility to dim<strong>in</strong>ish as headl<strong>in</strong>es subside and the above issues are<br />
resolved. Over the longer term, <strong>in</strong>vestors should be rewarded for their patience. We recommend<br />
<strong>in</strong>vestors buy the Boe<strong>in</strong>g Capital 5.80% of 01/13 at Treasuries +100 bp.<br />
(4) Information Technology<br />
Hewlett-Packard (A3, outlook negative/A-, outlook stable) – In November <strong>2003</strong>, HP announced for<br />
the first time s<strong>in</strong>ce the Compaq acquisition that it was profitable across all divisions and posted<br />
earn<strong>in</strong>gs from operations of $1.4 billion. Although the company is often criticized for its merger with<br />
Compaq, it appears to be deliver<strong>in</strong>g on all promises, <strong>in</strong>clud<strong>in</strong>g greater-than-expected cost synergies<br />
and larger scale. The company cont<strong>in</strong>ues to wage war on two fronts -- on the hardware side aga<strong>in</strong>st<br />
Dell, and on the services side aga<strong>in</strong>st IBM -- and is prov<strong>in</strong>g victorious. On the hardware side, HP's<br />
Compaq division has the number-one share of higher marg<strong>in</strong>ed notebooks and the number-two spot<br />
on desktops. On the services side, the company has been able to w<strong>in</strong> significant contracts from IBM<br />
as well as be<strong>in</strong>g highly competitive on those contracts it may not have won. As much as IBM would<br />
rather not admit it, HP is attack<strong>in</strong>g its bread and butter. We recommend <strong>in</strong>vestors buy the HPQ<br />
6.50% notes of 07/12 at Treasuries +55.<br />
(5) Food & Beverage<br />
Altria (Baa2, outlook negative/BBB+, outlook negative) – maturities of less than 36 months – Altria<br />
is another issuer that we th<strong>in</strong>k will outperform over the next six to 12 months. Fundamentally, Altria<br />
and its subsidiaries comprise one of the most profitable corporate entities <strong>in</strong> the U.S. today. The only<br />
negative, albeit a large one, is the litigation risk associated with the company's Philip Morris USA<br />
division. Just as the market has grown more comfortable with the U.S. tobacco component of the<br />
(14)
Nomura <strong>Fixed</strong> <strong>Income</strong> Research<br />
consolidated bus<strong>in</strong>ess, so too have we. Our analysis leads us to conclude that even if Philip Morris<br />
USA were to declare chapter 11 <strong>in</strong> an effort to resolve litigation aga<strong>in</strong>st it, the corporate veil would<br />
isolate Altria. With that said, we recommend that <strong>in</strong>vestors limit their <strong>in</strong>vestments to bonds with<strong>in</strong> a<br />
three year maturity. It is here that we feel most comfortable gaug<strong>in</strong>g the actual risk of the credit and<br />
that the risk/return trade-off is undervalued. We recommend <strong>in</strong>vestors buy the MO 6.375% of 02/06<br />
at Libor + 150 bp.<br />
Kraft (A3, outlook stable/BBB+, outlook stable) – Kraft bonds have performed well over the past six<br />
months and we expect the performance to cont<strong>in</strong>ue through the next six months. Kraft cont<strong>in</strong>ues to<br />
generate significant free cash flow and ma<strong>in</strong>ta<strong>in</strong>s a very conservative balance sheet. The company<br />
has several of the strongest consumer brand names <strong>in</strong> the world. More importantly, the market and<br />
the rat<strong>in</strong>g agencies are beg<strong>in</strong>n<strong>in</strong>g to see Kraft's relationship with its parent for the strategic hold<strong>in</strong>g it<br />
really is. We ma<strong>in</strong>ta<strong>in</strong> our contention that the value <strong>in</strong> Kraft is found by stay<strong>in</strong>g as far away from the<br />
tobacco division as possible. There are rumors that Altria may sp<strong>in</strong>-off the foods company <strong>in</strong> <strong>2004</strong> to<br />
try and monetize its <strong>in</strong>vestment <strong>in</strong> the company. This would be a significant event for bondholders<br />
because the rat<strong>in</strong>gs drag from Altria would fall away. On a stand-alone basis, we believe the<br />
company is a solid s<strong>in</strong>gle-A credit. We are comfortable that ultimately Philip Morris USA's tobacco<br />
concerns should not materialize <strong>in</strong>to an issue for Kraft. At a spread of 90 bp over Treasuries, we<br />
th<strong>in</strong>k the Kraft 5.25% of 10/01/13 are undervalued.<br />
b) Avoid<br />
(1) Domestic Long Distance Providers<br />
Our op<strong>in</strong>ion on long distance providers has not changed over the past 18 months. We cont<strong>in</strong>ue to<br />
believe that the operators exist <strong>in</strong> an extremely competitive marketplace where they are among the<br />
weakest players. The Regional Bell Operat<strong>in</strong>g Companies (RBOCs) repeatedly take customers away<br />
from the long distance providers as they try to <strong>in</strong>crease their top l<strong>in</strong>e. The RBOCs are much better<br />
capitalized and compete with a much stronger foundation of local recurr<strong>in</strong>g revenues. In addition,<br />
MCI (formally WorldCom) is expected to come out of bankruptcy <strong>in</strong> the next six months. The<br />
company will have dramatically lower debt and an IP backbone that is larger than any of its<br />
competitors, a foundation from which it can compete. We believe that competition will not decl<strong>in</strong>e,<br />
and, with MCI out of bankruptcy, it should <strong>in</strong>crease. Revenues per voice m<strong>in</strong>ute are expected to<br />
decl<strong>in</strong>e further and we don't see any product offer<strong>in</strong>gs from the companies that will likely reverse that<br />
trend.<br />
Long Distance Carriers – Spread to Treasuries<br />
Issuer<br />
10-year Benchmark Bond<br />
AT&T (Baa2, outlook negative/BBB, outlook stable) 150 bp<br />
Spr<strong>in</strong>t (Baa3, outlook stable/BBB-, outlook stable)<br />
170 bp<br />
c) Marketweight<br />
(1) RBOCs - Verizon, SBC and Bellsouth<br />
The RBOCs cont<strong>in</strong>ue to surprise us as they utilize significant free cash flow to reduce debt. Although<br />
the markets <strong>in</strong> which they operate are <strong>in</strong>creas<strong>in</strong>gly becom<strong>in</strong>g more competitive, the companies have<br />
managed to improve their balance sheets. Although we are reluctant to raise our recommendation to<br />
a buy, if the companies cont<strong>in</strong>ue to show dom<strong>in</strong>ance <strong>in</strong> their markets and <strong>in</strong>crease cash flow used to<br />
reduce debt, our op<strong>in</strong>ion could change. Look<strong>in</strong>g forward, we are wait<strong>in</strong>g for MCI (the long distance<br />
player) to come out of bankruptcy and see its impact on the competitive landscape before we change<br />
our recommendation on these companies.<br />
(15)
Nomura <strong>Fixed</strong> <strong>Income</strong> Research<br />
RBOCs - Spread to Treasuries (bp)<br />
Issuer<br />
10-year Benchmark Bond<br />
Verizon Communications (A2, stable/A+, stable)<br />
90 bp<br />
SBC Communications (A1, stable/A+, stable)<br />
80 bp<br />
BellSouth Communications (A1, stable/A+, stable) 45 bp<br />
B. Review of <strong>2003</strong> Second Half<br />
1. Spreads<br />
In <strong>2003</strong>, <strong>in</strong>vestors allocated more <strong>in</strong>vestments to bonds at attractive spreads due to l<strong>in</strong>ger<strong>in</strong>g<br />
concerns about the stock market, the situation <strong>in</strong> Iraq, the economy and improv<strong>in</strong>g fundamentals <strong>in</strong><br />
the bond market. As a result, corporate spreads tightened significantly and are currently at the<br />
tightest levels seen <strong>in</strong> 5 years. It is <strong>in</strong>terest<strong>in</strong>g to observe the difference <strong>in</strong> spreads between different<br />
rat<strong>in</strong>g categories. Accord<strong>in</strong>g to Merrill Lynch, the average spread differential of 55 bp between 10-<br />
year triple-B and s<strong>in</strong>gle-A bonds is at its tightest s<strong>in</strong>ce June 1998. This is significantly tighter than the<br />
widest we experienced at the end of <strong>2003</strong> of 123 bp, but is not as tight as the 22 bp differential seen<br />
<strong>in</strong> December 1996. These movements were strong, but leave room for additional tighten<strong>in</strong>g as the<br />
economy grows. Below is a chart list<strong>in</strong>g spread movements by sector. Autos had the greatest<br />
spread collapse, tighten<strong>in</strong>g over 140 bp s<strong>in</strong>ce June and 190bp s<strong>in</strong>ce January <strong>2003</strong>.<br />
Corporate Spreads - Change <strong>in</strong> Spread to Treasuries (bp)<br />
01/01/03-06/01/03 07/01/03-12/12/03<br />
Industrials -30 -30<br />
Banks -20 -20<br />
Autos -50 -140<br />
F<strong>in</strong>ance -45 -30<br />
High Quality Telecom -40 unch<br />
Source: Nomura Securities International<br />
2. Issuance<br />
Investment grade issuance through November <strong>2003</strong> totaled $486 billion, well above the $451 billion<br />
for the same period <strong>in</strong> 2002. We <strong>in</strong>itially expected companies to clean up their balance sheets rather<br />
than issue new debt, but the lowest <strong>in</strong>terest rates <strong>in</strong> 30 years proved an opportunity too tempt<strong>in</strong>g to<br />
resist.<br />
As seen from the graph below, full-year issuance for <strong>2003</strong> should total approximately $521 billion,<br />
which is well above 2002's $476 billion. Typically, December is one of the slowest months of the<br />
year. December <strong>2003</strong>, however, should see substantially higher issuance than years past as<br />
companies race to issue bonds while rates rema<strong>in</strong> low and demand for new paper is high. We<br />
anticipate issuance for December to reach $35 billion, almost twice our <strong>in</strong>itial expectations for the<br />
month.<br />
(16)
Nomura <strong>Fixed</strong> <strong>Income</strong> Research<br />
Monthly Corporate Investment Grade issuance<br />
90<br />
80<br />
70<br />
Y-Axis Label<br />
60<br />
50<br />
40<br />
30<br />
20<br />
10<br />
0<br />
Jan<br />
Feb<br />
Mar<br />
Apr<br />
May<br />
Jun<br />
Jul<br />
Aug<br />
Sep<br />
Oct<br />
Nov<br />
Dec<br />
2001 2002 <strong>2003</strong> (December is Nomura estimate)<br />
3. Credit<br />
Credit improved significantly <strong>in</strong> <strong>2003</strong>, especially <strong>in</strong> the past six months. As shown <strong>in</strong> the chart below,<br />
<strong>in</strong> the fourth quarter of <strong>2003</strong> the ratio of downgrades to upgrades fell to 0.5:1, its lowest level s<strong>in</strong>ce<br />
the fourth quarter of 1998. This is a substantial decrease from the highs witnessed <strong>in</strong> the fourth<br />
quarter of 2002 at 6.1x. Although the ratio still shows 0.5x more downgrades than upgrades, we<br />
anticipate the ratio to stabilize around zero <strong>in</strong> the near future.<br />
Ratio of negative rat<strong>in</strong>g changes to positive rat<strong>in</strong>g changes<br />
7<br />
6<br />
5<br />
Ratio<br />
4<br />
3<br />
2<br />
1<br />
0<br />
1Q'94<br />
1Q'95<br />
1Q'96<br />
1Q'98<br />
1Q'98<br />
1Q'99<br />
1Q'00<br />
1Q'01<br />
1Q'02<br />
1Q'03<br />
By comb<strong>in</strong><strong>in</strong>g the credit watch events with the actual rat<strong>in</strong>g changes, the new ratio <strong>in</strong>dicates that<br />
credit should be stabiliz<strong>in</strong>g overall. As shown <strong>in</strong> the follow<strong>in</strong>g chart, for the fourth quarter of <strong>2003</strong> the<br />
ratio of negative rat<strong>in</strong>gs movements to positive movements was 0.9, the lowest ratio s<strong>in</strong>ce the second<br />
quarter of 1999 and a substantial improvement over the 2.0x seen <strong>in</strong> the third quarter of <strong>2003</strong>. In the<br />
first half of <strong>2003</strong>, significant downgrades were taken to utilities and f<strong>in</strong>ancial companies. Credit<br />
deterioration cont<strong>in</strong>ued <strong>in</strong>to the second half, but the extent to which credit fell decl<strong>in</strong>ed from the first<br />
half. We expect that the ratio of downgrades to upgrades will improve <strong>in</strong> <strong>2004</strong> as corporations<br />
cont<strong>in</strong>ue to work on their balance sheets and the economy move towards recovery.<br />
(17)
Nomura <strong>Fixed</strong> <strong>Income</strong> Research<br />
Ratio of negative rat<strong>in</strong>g movements to positve movements<br />
4.0<br />
3.5<br />
3.0<br />
2.5<br />
Ratio<br />
2.0<br />
1.5<br />
1.0<br />
0.5<br />
0.0<br />
1Q'94<br />
1Q'95<br />
1Q'96<br />
1Q'98<br />
1Q'98<br />
1Q'99<br />
1Q'00<br />
1Q'01<br />
1Q'02<br />
1Q'03<br />
4. Review of the Mid-year Recommendations<br />
Performance for the past six months was good. Although many of our recommendations performed<br />
well <strong>in</strong> tandem with the overall market, our approach of <strong>in</strong>creas<strong>in</strong>g exposure to riskier credits paid-off.<br />
The market has gradually become comfortable with assum<strong>in</strong>g more risk over the last 12 months, and<br />
as such, re-exam<strong>in</strong>ed some of the wider credits such as Kraft, Hewlett Packard and autos as a<br />
means of outperform<strong>in</strong>g the market. This strategy worked. Our negative op<strong>in</strong>ion on the long distance<br />
companies under-perform dur<strong>in</strong>g the last six months as bonds tightened over 150 bp. As <strong>in</strong>vestors<br />
became more comfortable with risk, they became more comfortable with these credits too.<br />
Regardless, we cont<strong>in</strong>ue to feel that those <strong>in</strong>vestors who avoid the long distance sector <strong>in</strong> the long<br />
run will be v<strong>in</strong>dicated.<br />
(18)
Nomura <strong>Fixed</strong> <strong>Income</strong> Research<br />
Company Name<br />
Recommendation Scorecard<br />
Recommended<br />
Date<br />
Spread or Price<br />
at Rec.<br />
(10-year bench)<br />
Current Price ($) or<br />
Spread over<br />
Treasuries (bp)<br />
BUY<br />
AOL Time Warner Jul-02 330 bp 80 bp<br />
Walt Disney Company Jul-02 155 bp 660 bp<br />
General Electric Dec-02 125 bp 60 bp<br />
Boe<strong>in</strong>g Capital Dec-02 170 bp 100 bp<br />
Ford Motor Credit (1 year) Dec-02 L+275 L+70<br />
Ford Motor Credit Oct-03 +275 220<br />
GMAC (1 year) Dec-02 L+200 L+50<br />
Hewlett Packard Jun-03 T+85 55<br />
Kraft Jun-03 T+95 90<br />
Market Weight<br />
General Motors Dec-02 320 bp 160 bp<br />
Daimler-Chrysler Dec-02 175 bp 170bp<br />
Verizon Communications Dec-02 90 bp 90 bp<br />
SBC Communications Dec-02 68 bp 80 bp<br />
Bellsouth Communications Dec-02 68 bp 45 bp<br />
Avoid<br />
Spr<strong>in</strong>t Dec-02 310 bp 150 bp<br />
AT&T Communications Dec-02 275 bp 170 bp<br />
* In December <strong>2003</strong> we changed our recommendation <strong>in</strong> autos from a market<br />
weight to a Buy.<br />
(19)
Nomura <strong>Fixed</strong> <strong>Income</strong> Research<br />
IV.<br />
Residential MBS<br />
Arthur Frank (212) 667-1477<br />
James Manzi (212) 667-2231<br />
<strong>Outlook</strong> for <strong>2004</strong>: Convexity Inexpensive <strong>in</strong> MBS Market as Bearish Mood Creates Overpriced<br />
Premiums<br />
A. Summary<br />
Premium prepayment speeds slowed dramatically <strong>in</strong> November, with 30-year 6s and higher coupons,<br />
as well as 15-year 5.5s and higher coupons, post<strong>in</strong>g by far their slowest CPRs s<strong>in</strong>ce September<br />
2002, when the 2002-3 ref<strong>in</strong>anc<strong>in</strong>g wave began. The 163 bp <strong>in</strong>crease <strong>in</strong> 30-year current coupon<br />
Fannie Mae yields from an all-time low of 4.18% on June 12 to 5.81% on September 2 ended the<br />
largest ref<strong>in</strong>anc<strong>in</strong>g wave <strong>in</strong> the 33-year history of the MBS market. As is usually the case when a<br />
ref<strong>in</strong>anc<strong>in</strong>g wave ebbs, prepayment speeds decl<strong>in</strong>e more slowly than they sped up when rates were<br />
fall<strong>in</strong>g, a function of mortgage orig<strong>in</strong>ators work<strong>in</strong>g through their backlog of ref<strong>in</strong>anc<strong>in</strong>g applications.<br />
We do not believe that mortgage speeds are go<strong>in</strong>g much lower <strong>in</strong> the near term, however, as the 30-<br />
year Fannie Mae current coupon yield has fallen slightly below 5.20%, and the MBAA Ref<strong>in</strong>anc<strong>in</strong>g<br />
Index (Refi Index) has climbed back above 2000 (see chart on follow<strong>in</strong>g page). Yet both the<br />
passthrough and Trust IO markets are currently priced for a significant slowdown <strong>in</strong> prepayment<br />
speeds. Conversely, pay-ups above TBA prices for premium “specialty pools” (low loan balance,<br />
moderate loan balance, new WALA, low WAC, low FICO, etc.) have decl<strong>in</strong>ed sharply <strong>in</strong> recent<br />
weeks, to levels where add<strong>in</strong>g convexity to an MBS portfolio can be relatively <strong>in</strong>expensive.<br />
With the Freddie Mac primary market 30-year weekly survey rate currently at 5.88%, just 67 bp above<br />
the June’s <strong>2003</strong> all-time low, we do not believe that premium speeds will slow significantly dur<strong>in</strong>g the<br />
first quarter of <strong>2004</strong>. Therefore, we believe that TBA 6s and higher coupons are currently priced<br />
above fair value, and suggest a modest underweight of the premium 30-year sector. In current<br />
coupons, we believe that the MBS market is fully priced, even slightly rich, compared with Treasuries<br />
and agencies, but suggest a market weight nonetheless, as conventional 5 and 5.5s are likely to roll<br />
above carry <strong>in</strong> early <strong>2004</strong> due to stronger demand from CMO underwriters. Although bank portfolio<br />
sponsorship of the CMO market has lagged <strong>in</strong> recent weeks, and <strong>in</strong> fact banks have been net sellers,<br />
not buyers, of short CMOs this month, we expect bank CMO demand to bounce back dur<strong>in</strong>g the first<br />
quarter of <strong>2004</strong>. December bank sell<strong>in</strong>g has been largely motivated by a desire to book capital ga<strong>in</strong>s<br />
or to trim balance sheets go<strong>in</strong>g <strong>in</strong>to year-end rather than reflect<strong>in</strong>g any reduction <strong>in</strong> portfolio appetite<br />
for MBS. With the Federal Reserve Open Market Committee hav<strong>in</strong>g <strong>in</strong>dicated that short term rates<br />
will rema<strong>in</strong> low for at least several months to come, the yield curve will likely rema<strong>in</strong> steep at least<br />
dur<strong>in</strong>g the first half of <strong>2004</strong>, provid<strong>in</strong>g an attractive environment for banks to purchase short average<br />
life CMOs funded at the fed funds rate. At present, PAC/support deals can be priced <strong>in</strong> both 30-year<br />
5s and 5.5s, and hence we th<strong>in</strong>k those coupons are attractive on both an outright and a dollar roll<br />
basis. If, as we expect, these dollar rolls trade special by 1-2 ticks per month, the carry advantage<br />
over Treasuries and agencies will rema<strong>in</strong> substantial, even with spreads on the tight side of their<br />
historical range. Our Economics Department’s forecast for the cont<strong>in</strong>uation of a relatively steep yield<br />
curve for the first half of <strong>2004</strong> also makes a current coupon underweight a risky position for <strong>in</strong>vestors<br />
<strong>in</strong> agreement with this outlook. While swaption implied volatility is currently near its average level of<br />
the past year (17.7% on at-the-money 5x10s – see graph below), it rema<strong>in</strong> over 200 bp above its five<br />
year average of 15.5%, and we th<strong>in</strong>k it is more likely to decl<strong>in</strong>e than rise dur<strong>in</strong>g the first half of <strong>2004</strong>,<br />
which would be a positive development for the relative performance of the MBS market.<br />
At present, call risk seems to pose a greater threat for MBS relative performance than extension risk;<br />
with the MBS <strong>in</strong>dex already hav<strong>in</strong>g extended <strong>in</strong> effective duration from 1.3 years at the end of<br />
February <strong>2003</strong> to 3.6 years at the end of November, much of the conceivable extension of the MBS<br />
market has already occurred. So the real risk of MBS underperformance, other than a major yield<br />
curve flatten<strong>in</strong>g tak<strong>in</strong>g away the bank carry trade, would be if the 10-year Treasury yield were to<br />
plunge to 3.75% or below. Such an <strong>in</strong>terest rate move, unexpected by both our Economics<br />
Department and market consensus, would likely lead to massive activity by mortgage convexity<br />
hedgers, driv<strong>in</strong>g up implied volatility <strong>in</strong> derivative markets and lead<strong>in</strong>g to a renewed wave of<br />
(20)
Nomura <strong>Fixed</strong> <strong>Income</strong> Research<br />
ref<strong>in</strong>anc<strong>in</strong>g. S<strong>in</strong>ce premiums are currently priced as if such a move is a low probability event, this<br />
would likely cause significant underperformance of high coupon mortgages, and hence overall<br />
relative underperfomance compared with Treasuries, agencies, and swaps. On balance, we<br />
advocate a market weight <strong>in</strong> current coupons and a modest underweight <strong>in</strong> premiums, but <strong>in</strong>vestors<br />
who believe <strong>in</strong> our Economics Department’s mildly bearish forecast may want to market weight the<br />
MBS market as a whole.<br />
B. Prepayment <strong>Outlook</strong><br />
The November prepayment speeds reported <strong>in</strong> early December showed the sharp decl<strong>in</strong>e <strong>in</strong> premium<br />
prepayment speeds that had been expected by market participants s<strong>in</strong>ce the major rise <strong>in</strong> mortgage<br />
rates this past summer pulled the MBAA Refi Index from an all-time record high of 9977.8 to the low<br />
2000s by summer’s end. Despite the abrupt decl<strong>in</strong>e <strong>in</strong> the Refi Index, premium prepayment speeds<br />
fell quite modestly through November, due to a huge backlog of ref<strong>in</strong>anc<strong>in</strong>g applications from the<br />
early summer low <strong>in</strong> mortgage rates. We expect a mild rebound of speeds <strong>in</strong> December, largely due<br />
to it be<strong>in</strong>g a 22-bus<strong>in</strong>ess day month, compared with only 18 bus<strong>in</strong>ess days <strong>in</strong> November (count<strong>in</strong>g<br />
Veteran’s Day as a holiday). January and February of <strong>2004</strong> are both light on bus<strong>in</strong>ess days, with 20<br />
and 19 respectively, and accord<strong>in</strong>gly we expect slight decl<strong>in</strong>es <strong>in</strong> prepayment speeds for both<br />
months. From there we expect, at current <strong>in</strong>terest rates (5.20% current coupon conventional yield as<br />
of the December 17 close, Freddie Mac 30-year weekly survey rate at 5.88% as of their December 11<br />
release), relatively stable prepayment speeds., with the MBAA Refi Index dropp<strong>in</strong>g modestly below<br />
2000 but stay<strong>in</strong>g well above 1500. Thus we expect prepayment speeds of 30-year TBA 6s to rema<strong>in</strong><br />
slightly above 30 CPR and speeds of 30-year TBA 6.5s to rema<strong>in</strong> just above 40 CPR for the next four<br />
to five months, somewhat faster than the market seems to expect given prevail<strong>in</strong>g prices <strong>in</strong> both the<br />
passthrough and the IO market.<br />
MBA Ref<strong>in</strong>anc<strong>in</strong>g Index vs. Freddie Mac 30-yr Commitment Rate<br />
11000<br />
6.50<br />
10000<br />
MBA Refi Index<br />
9000<br />
8000<br />
7000<br />
6000<br />
5000<br />
4000<br />
3000<br />
6.20<br />
5.90<br />
5.60<br />
5.30<br />
Commitment Rate (%)<br />
2000<br />
1000<br />
5.00<br />
27-Dec-02<br />
24-Jan-03<br />
21-Feb-03<br />
21-Mar-03<br />
18-Apr-03<br />
16-May-03<br />
13-Jun-03<br />
11-Jul-03<br />
08-Aug-03<br />
05-Sep-03<br />
03-Oct-03<br />
31-Oct-03<br />
28-Nov-03<br />
MBA Refi Index<br />
Freddie Mac 30yr Commitment Rate<br />
Sources: Bloomberg, Nomura<br />
While the MBS market, <strong>in</strong> our view, is correct <strong>in</strong> valu<strong>in</strong>g TBA premiums differently now that the<br />
greatest ref<strong>in</strong>anc<strong>in</strong>g wave ever has ended, it has over-priced TBA premiums relative to alternatives<br />
that offer much more prepayment stability.<br />
In spite of the November slowdown <strong>in</strong> speeds, we believe TBA pools of 6s and especially 6.5s and 7s<br />
are go<strong>in</strong>g to offer sub-par relative returns over the next few months due to prepayment speeds<br />
stabiliz<strong>in</strong>g at close to November levels. For 6.5s and 7s, reperform<strong>in</strong>g FHA/VA passthroughs are a<br />
good substitute for TBA collateral, as we expect the latter’s prepayments to slow from CPRs <strong>in</strong> the<br />
(21)
Nomura <strong>Fixed</strong> <strong>Income</strong> Research<br />
high 20s to low 30s to the low-to-mid 20s over the next few months. Reperform<strong>in</strong>g FHA/VA pools<br />
were slower than TBAs to speed up dur<strong>in</strong>g the summer ref<strong>in</strong>anc<strong>in</strong>g peak and are now tak<strong>in</strong>g longer to<br />
slow down, s<strong>in</strong>ce FHA-to-FHA ref<strong>in</strong>anc<strong>in</strong>g requires more time and paperwork then conventional<br />
ref<strong>in</strong>anc<strong>in</strong>g. 1 We are confident, however, that such a prepayment slowdown will materialize over the<br />
next three months, and with pay-ups above TBA FNMAs hav<strong>in</strong>g decl<strong>in</strong>ed to 1-10 for 6.5s and 1-19 for<br />
7s, there is value <strong>in</strong> this sector. In mid-premium 6s, where we expect TBA to be prepay<strong>in</strong>g at slightly<br />
above 30 over the next few months, we prefer low loan balance and low WALA pools, which offered<br />
strong call protection dur<strong>in</strong>g the recent ref<strong>in</strong>anc<strong>in</strong>g wave, and where pay-ups above TBA prices have<br />
sharply compressed. For example, def<strong>in</strong><strong>in</strong>g low balance as pools with average loan size under<br />
$75,000, moderate balance as pools with average loan size from $75,000 to $100,000, and high<br />
balance as pools with average loan size above $150,000 (the latter likely to be delivered TBA), the<br />
most recent 6-month CPRs for low, moderate, and high balance 2002 production 30-year FNMA 6s<br />
were 20.1, 28.9, and 56.9, respectively. With this amount of call protection, even <strong>in</strong> a more muted<br />
ref<strong>in</strong>anc<strong>in</strong>g environment, the pay-ups of 14 ticks for low balance and n<strong>in</strong>e ticks for moderate balance<br />
conventional 6s will be recovered <strong>in</strong> carry <strong>in</strong> four to five months, after which the <strong>in</strong>vestor owns pools<br />
with much better convexity than generic pools essentially for free. A less expensive alternative to<br />
TBA <strong>in</strong> both 30-year 6s and 6.5s are pools that have both low WALA and low WAC, available <strong>in</strong> 6s for<br />
a pay-up of three ticks and <strong>in</strong> 6.5s for a pay-up of 12 ticks. The pay-ups are ma<strong>in</strong>ly for WALA < 2<br />
months, tak<strong>in</strong>g advantage of the fact that even for mid-premiums, there is a “ref<strong>in</strong>anc<strong>in</strong>g ramp” of<br />
about 12 months; the <strong>in</strong>vestor gets low WAC for just a tick or so more. The near-term prepayment<br />
advantage is quite large; for example, all FNMA 6s with WALA = four months prepaid over the last<br />
three months at 9.6% CPR, while the group of FNMA 6% pools with WALA between 25 and 36<br />
months (likely to be delivered TBA) prepaid at 50.8% CPR. For a new WALA premium pool, the<br />
majority of the prepayment advantage over TBA comes <strong>in</strong> the first four to six months, but the carry is<br />
so much better than TBA that the premium is expected to be recouped <strong>in</strong> one month for 6s and <strong>in</strong><br />
three months for 6.5s.<br />
C. Spreads<br />
While the ultra-fast premium prepayment speeds of the summer and fall of <strong>2003</strong> significantly eroded<br />
MBS total returns, the steady tighten<strong>in</strong>g of current coupon MBS spreads to Treasuries s<strong>in</strong>ce the<br />
beg<strong>in</strong>n<strong>in</strong>g of August (see Graph 2) produced total returns for the fixed rate agency MBS market for<br />
the first eleven months of <strong>2003</strong> of only about 36 basis po<strong>in</strong>ts less than comparable duration<br />
Treasuries, a much better performance than <strong>in</strong> similar high ref<strong>in</strong>anc<strong>in</strong>g environments <strong>in</strong> 1993 and<br />
1998.<br />
1 Frank, A. and Manzi, J., Monthly Update on FHA/VA Reperform<strong>in</strong>g Mortgages: Historical Prepayment Speeds,<br />
Default Losses, and Total Returns, Nomura fixed <strong>in</strong>come research (3 Dec <strong>2003</strong>).<br />
(22)
Nomura <strong>Fixed</strong> <strong>Income</strong> Research<br />
FNMA Current Coupon Spreads to Treasuries & Swaps<br />
160<br />
21<br />
140<br />
20<br />
120<br />
19<br />
Spread (bp)<br />
100<br />
80<br />
18<br />
17<br />
5 x 10 vol.<br />
60<br />
16<br />
40<br />
15<br />
Jan-03<br />
Feb-03<br />
Mar-03<br />
Apr-03<br />
May-03<br />
Jun-03<br />
Jul-03<br />
Aug-03<br />
Sep-03<br />
Oct-03<br />
Nov-03<br />
Dec-03<br />
FNCC / 10yr Treas FNCC vs 10yr Swap 5x10 Vol<br />
Sources: Bloomberg, Nomura<br />
Because we expect premium prepayments to decl<strong>in</strong>e very modestly at least through the first quarter<br />
of <strong>2004</strong>, and because MBS valuations are now at a po<strong>in</strong>t that further tighten<strong>in</strong>g potential is limited, we<br />
doubt that significant outperformance by the MBS sector is likely for the first half of <strong>2004</strong>. At this<br />
po<strong>in</strong>t we suggest limit<strong>in</strong>g MBS to a market weight, with a slight overweight <strong>in</strong> 30-year 5s and 5.5s and<br />
15-year 4.5s and 5s to take advantage of <strong>in</strong>cremental returns <strong>in</strong> the dollar roll market, due to our<br />
expectat<strong>in</strong> of strong dealer demand for these coupons for CMO underwrit<strong>in</strong>g We also suggest a<br />
modest underweight of premiums.<br />
Not only do we anticipate a cont<strong>in</strong>uation of fairly rapid premium speeds for at least the next quarter,<br />
but we th<strong>in</strong>k current coupon passthroughs have become slightly rich compared with agencies and<br />
Treasuries, as mortgage spreads cont<strong>in</strong>ued to tighten even as the sharp decl<strong>in</strong>e <strong>in</strong> implied volatility <strong>in</strong><br />
the swaptions market ended and volatility found a trad<strong>in</strong>g range (see chart above).<br />
Nonetheless, the risk-reward trade-off does not at the present time dictate an underweight either. If<br />
rates rema<strong>in</strong> <strong>in</strong> a trad<strong>in</strong>g range or back up modestly, swaption implied volatility is more likely to<br />
decl<strong>in</strong>e than rise from current levels. Our Economics forecast of the cont<strong>in</strong>uation of a relatively steep<br />
yield curve for the first half of <strong>2004</strong> limits the potential for significant spread widen<strong>in</strong>g, as REMIC<br />
underwriters will likely bid aggressively for current coupon collateral if spreads edge wider <strong>in</strong> the<br />
absence of a significantly flatter curve. The REMIC bid, driven to a large extent by the <strong>in</strong>satiable<br />
appetite of bank portfolios for short average life CMO tranches <strong>in</strong> an environment where the carry<br />
over fund<strong>in</strong>g costs of such paper is very attractive, should keep conventional and GNMA II current<br />
coupons roll<strong>in</strong>g above carry, further limit<strong>in</strong>g the potential for sizeable underperformance. So marketweight<strong>in</strong>g<br />
the MBS sector appears to be the best policy, with <strong>in</strong>cremental return possibilities available<br />
<strong>in</strong> dollar rolls for current coupons and pool selection <strong>in</strong> premiums.<br />
D. The Coupon Stack<br />
After over two years of rapid ref<strong>in</strong>anc<strong>in</strong>g of higher coupon and extensive issuance of lower coupon<br />
mortgages, the coupon distribution of the 30-year fixed rate agency MBS market has radically shifted,<br />
with nearly 70% of the 30-year passthrough market <strong>in</strong> the just three coupons, 5%, 5.5% and 6%. But<br />
because the two largest coupons <strong>in</strong> the MBS market, 5s and 5.5s, have already virtually ceased<br />
ref<strong>in</strong>anc<strong>in</strong>g and are be<strong>in</strong>g priced at speeds not much above hous<strong>in</strong>g turnover, much of the possible<br />
duration extension of the MBS market has already occurred. The graph below demonstrates the<br />
coupon concentration of the current MBS market compared with two and six years ago:<br />
(23)
Nomura <strong>Fixed</strong> <strong>Income</strong> Research<br />
Distribution of the Coupon Stack <strong>in</strong> the Agency MBS Market<br />
100%<br />
90%<br />
80%<br />
>=8<br />
>=8<br />
7.5<br />
7.5<br />
7<br />
6.5<br />
Percentage of Total<br />
70%<br />
60%<br />
50%<br />
40%<br />
30%<br />
7.5<br />
7<br />
7<br />
6.5<br />
6<br />
5.5<br />
>=8<br />
7.5<br />
7<br />
6.5<br />
6<br />
5.5<br />
Nomura <strong>Fixed</strong> <strong>Income</strong> Research<br />
ticks above TBA. S<strong>in</strong>ce for the next three to four months both of these categories are expected to<br />
prepay at about 20 CPR slower than TBA pools, the carry will compensate <strong>in</strong>vestors for the payups,<br />
even <strong>in</strong> the highly unlikely event that the pools trade at TBA prices four months from now. Of course,<br />
the low loan balance pools should permanently prepay more slowly than the universe, due to the<br />
lower mortgagor monthly sav<strong>in</strong>gs and smaller broker <strong>in</strong>centive to ref<strong>in</strong>ance low balance mortgages,<br />
while the advantage of new production pools will dim<strong>in</strong>ish significantly over time.<br />
The 15-year current coupon sector is currently fairly valued versus the 30-year sector, given its lower<br />
option cost, and with extension fears prevalent <strong>in</strong> the market, has become popular collateral for<br />
REMIC underwriters. Thus we expect 15-year 4.5s and 5s to dollar roll above fair value, and would<br />
slightly overweight these coupons to take advantage of the rolls. Premium 15-year 5.5s and 6s are a<br />
little less attractive than lower coupons on an OAS basis and are not as likely to roll as well; we would<br />
therefore avoid TBAs and <strong>in</strong>vest <strong>in</strong> low loan balance and new WALA – low WAC pools <strong>in</strong> these<br />
coupons.<br />
In the CMO market, there is currently good value <strong>in</strong> discount <strong>in</strong>termediate and long PACs backed by<br />
30-year 4.5s and 5s, which are pay<strong>in</strong>g well with<strong>in</strong> their bands and are offered 5-10 bp OAS cheaper<br />
than the underly<strong>in</strong>g collateral. In particular, we like PACs backed by 4.5s, which offer <strong>in</strong>expensive<br />
call protection for rate decl<strong>in</strong>es up to 100 bp that are currently undervalued by the market. These<br />
bonds represent an attractive alternative to own<strong>in</strong>g 4.5% collateral, that unlike 5% collateral is likely<br />
to dollar roll at carry and offers an <strong>in</strong>sufficient yield premium for its <strong>in</strong>ferior convexity to discount<br />
PACs.<br />
A new development <strong>in</strong> the G<strong>in</strong>nie Mae market is the issuance of premium buydown pools <strong>in</strong> both the<br />
GNMA I and GNMA II programs. Prior to July 1, <strong>2003</strong>, most FHA buydown loans, <strong>in</strong> which the home<br />
seller (often the builder of a new development) pays 2% <strong>in</strong>terest <strong>in</strong> year one and 1% <strong>in</strong>terest <strong>in</strong> year<br />
two, were placed <strong>in</strong>to generic GNMA II pools. GNMA, however, changed their pool<strong>in</strong>g rules effective<br />
July 1, <strong>2003</strong>, limit<strong>in</strong>g buydown loans to a 10% maximum of the orig<strong>in</strong>al pr<strong>in</strong>cipal balance of a new<br />
GNMA II pool. As a consequence, several orig<strong>in</strong>ators have begun to create both GNMA I and II<br />
buydown pools, which currently trade far below TBA prices <strong>in</strong> spite of much slower expected<br />
prepayments <strong>in</strong> their first two years, when the <strong>in</strong>terest payments are be<strong>in</strong>g subsidized by the seller of<br />
the home. In GNMA 6s (I & II), buydown pools are currently offered at 14 ticks below TBA; <strong>in</strong> 6.5s, at<br />
12 ticks below TBA. While these pools are not TBA-deliverable even after the buydown period<br />
expires, these sub-TBA prices make them very attractive for buy-and-hold <strong>in</strong>vestors. A GNMA 6.5s<br />
newly issued buydown pool prepays as if it were a GNMA 4.5s <strong>in</strong> year one and as if it were a GNMA<br />
5.5 <strong>in</strong> year two, s<strong>in</strong>ce the mortgagor is receiv<strong>in</strong>g a 200 bp subsidy <strong>in</strong> year one and a 100 bp subsidy<br />
<strong>in</strong> year two. Once the GNMA buydown market grows and receives more <strong>in</strong>vestor focus, we doubt<br />
these large discounts from TBA prices will last. We recommend non-dollar roll <strong>in</strong>vestors purchase<br />
GNMA 6% and 6.5% buydown pools as a substitute for GNMA TBA 6s and 6.5s.<br />
(25)
Nomura <strong>Fixed</strong> <strong>Income</strong> Research<br />
V. Commercial MBS<br />
David Jacob (212) 667-2255<br />
A. <strong>Outlook</strong> for <strong>2004</strong><br />
1. Issuance<br />
We th<strong>in</strong>k that <strong>2004</strong> United States commercial mortgage backed securities (CMBS) issuance could<br />
approach the 1998 record of approximately $75 billion. Unlike the residential mortgage market,<br />
CMBS have very strong prepayment protection of the underly<strong>in</strong>g mortgage loans, leav<strong>in</strong>g issuance<br />
driven by the property markets' demand for capital, and the <strong>in</strong>tensity of competition among traditional<br />
lenders <strong>in</strong> supply<strong>in</strong>g that capital.<br />
Our forecast for a moderate rise <strong>in</strong> <strong>in</strong>terest rates will lead to some slow-down <strong>in</strong> acquisition f<strong>in</strong>anc<strong>in</strong>g,<br />
but that will be more than offset by the need to re-f<strong>in</strong>ance more than $20 billion of matur<strong>in</strong>g 10-year<br />
balloon loans orig<strong>in</strong>ated <strong>in</strong> 1994, and 7-year balloon loans from the boom years of 1997 and 1998.<br />
Additionally, as real estate markets beg<strong>in</strong> to recover, and particularly if property values reflect an<br />
anticipated <strong>in</strong>crease <strong>in</strong> rents as vacancies ease, transactions could pick up. Moreover, a gradually<br />
improv<strong>in</strong>g real estate market should make renovation and rehabilitation projects more feasible, further<br />
driv<strong>in</strong>g loan demand.<br />
<strong>2004</strong> Loan Maturities by Property Type<br />
8<br />
7<br />
6<br />
Amount ($Bil)<br />
5<br />
4<br />
3<br />
2<br />
1<br />
0<br />
Total = $20.0 Bil.<br />
Office<br />
Retail<br />
Hotel<br />
Apartment<br />
Mixed Use<br />
Unknown<br />
Industrial<br />
Other<br />
Healthcare<br />
Self Storage<br />
Property Type<br />
Sources: Trepp LLC, Nomura<br />
We expect some change <strong>in</strong> the mix of loans. A flatter yield curve will likely curtail some demand for<br />
5-year balloon loans as well as float<strong>in</strong>g rate product. Matur<strong>in</strong>g healthcare loans likely will be<br />
challenged to f<strong>in</strong>d lenders, but a recovery <strong>in</strong> the hotel sector should facilitate CMBS lend<strong>in</strong>g <strong>in</strong> the<br />
lodg<strong>in</strong>g sector.<br />
(26)
Nomura <strong>Fixed</strong> <strong>Income</strong> Research<br />
CMBS Market Breakdown by Loan Maturities<br />
Issue <strong>Year</strong><br />
1998 1999 2000 2001 2002 <strong>2003</strong><br />
1-7 yrs 6% 11% 8% 11% 12% 26%<br />
>8 94% 89% 92% 89% 88% 74%<br />
2 – 10 spread 13.9 21.9 -22.5 119.0 198.3 236.8<br />
Note: 2-10 spread refers to the average daily clos<strong>in</strong>g yield spread between the 2-yr and 10-yr<br />
Treasury over the year.<br />
Source: Bloomberg, Intex, Nomura<br />
2. Credit<br />
We expect a cont<strong>in</strong>ued <strong>in</strong>crease <strong>in</strong> CMBS del<strong>in</strong>quencies, despite general economic improvement.<br />
We expect "core" del<strong>in</strong>quencies (at least 60 days del<strong>in</strong>quent+REO) for seasoned conduit and fusion<br />
deals to reach 2.6% to 2.7% from the about 2.0% currently.<br />
Moreover, we expect a modest <strong>in</strong>crease <strong>in</strong> balloon defaults. This cont<strong>in</strong>u<strong>in</strong>g deterioration <strong>in</strong> credit<br />
performance will occur even though it is likely that vacancies have peaked and rents have bottomed<br />
<strong>in</strong> many markets.<br />
Defaults occur when two conditions exist: (1) when a borrower cannot pay debt service and (2) the<br />
property value is worth less than the value of the debt on it. Generally speak<strong>in</strong>g, borrowers do not<br />
default as long as they can pay their debt service. A volatile <strong>in</strong>come stream on a property, however,<br />
<strong>in</strong>creases the probability of <strong>in</strong>sufficient <strong>in</strong>come to service the debt.<br />
Hotels and healthcare properties, which have no leases and are operat<strong>in</strong>g bus<strong>in</strong>esses, tend to have<br />
volatile <strong>in</strong>come streams, mak<strong>in</strong>g del<strong>in</strong>quencies <strong>in</strong> these sectors proportionately higher than for<br />
offices, retail, and <strong>in</strong>dustrial properties. When economic recovery is at hand, however, lenders favor<br />
properties with no leases or short leases where rents can quickly be adjusted upwards, such as<br />
hotels, multi-family properties, and warehouse properties, where growth can prompt <strong>in</strong>creased<br />
demands for space. Healthcare properties rema<strong>in</strong> challenged.<br />
In contrast, with slow projected growth <strong>in</strong> office sector jobs, office properties could languish<br />
throughout <strong>2004</strong>, and we expect an especially difficult first half. Our fear is that ris<strong>in</strong>g <strong>in</strong>terest rates<br />
will nudge up cap rates without a commensurate <strong>in</strong>crease <strong>in</strong> rents. Moreover, as leases rollover <strong>in</strong><br />
the current weak market environment, cover<strong>in</strong>g debt service will become harder. In addition, as<br />
borrowers try to ref<strong>in</strong>ance their balloon mortgages, those with high vacancy rates will have difficulty.<br />
The oversupplied multi-family market should improve with ris<strong>in</strong>g <strong>in</strong>terest rates as at-the-marg<strong>in</strong><br />
prospective homebuyers are forced to rent. Hotels will cont<strong>in</strong>ue to recover and an <strong>in</strong>creas<strong>in</strong>g number<br />
of loans should f<strong>in</strong>d their way <strong>in</strong>to CMBS, but their risky nature will always limit the amount of hotel<br />
exposure <strong>in</strong> any deal. Retail should be <strong>in</strong>fluenced by consumer spend<strong>in</strong>g, and while the consumer<br />
benefited from residential mortgage ref<strong>in</strong>anc<strong>in</strong>g and the tax cut <strong>in</strong> <strong>2003</strong>, those ga<strong>in</strong>s are played out.<br />
Performance <strong>in</strong> <strong>2004</strong> will depend upon whether the economic recovery puts people back to work or<br />
not. Anchored grocery properties will cont<strong>in</strong>ue to perform, but mall properties need a consumer with<br />
discretionary cash.<br />
When talk<strong>in</strong>g about credit we need to consider defaults and severity as well. Accord<strong>in</strong>g to the<br />
October 14, <strong>2003</strong> Fitch study, CMBS Loan Losses: Property Type Highlights and Trends, loss<br />
severity for retail loans reached 46.6% (<strong>in</strong>cludes loans <strong>in</strong> fixed-rate conduit, large loan, and fusion<br />
deals rated by Fitch from 1993-2002) and is a function of how much the value of a property has fallen<br />
and the speed of resolution. Healthcare properties, accord<strong>in</strong>g to Fitch, took an average of 33.6<br />
months for disposition.<br />
(27)
Nomura <strong>Fixed</strong> <strong>Income</strong> Research<br />
With real estate fundamentals still very weak, and with the <strong>in</strong>creas<strong>in</strong>g propensity to litigate, we th<strong>in</strong>k<br />
severity can <strong>in</strong>crease <strong>in</strong> <strong>2004</strong>. For loans where there are A/B notes or participated loan structures,<br />
the severities can be even worse than for traditional loan structures. 2 The multiple parties <strong>in</strong>volved <strong>in</strong><br />
these loan structures can delay the resolution and <strong>in</strong>crease expenses to a securitization trust. These<br />
structures, where the loan itself is tranched <strong>in</strong>to participated A-notes and a B-note, can also lead to<br />
unexpected <strong>in</strong>terest short falls.<br />
While we expect credit to cont<strong>in</strong>ue to deteriorate <strong>in</strong>to <strong>2004</strong>, the levels are very modest by historical<br />
standards and will still not be large enough to hurt <strong>in</strong>vestment grade CMBS credit performance<br />
(although <strong>in</strong>vestors will probably contrast the trend with improv<strong>in</strong>g performance <strong>in</strong> the corporate<br />
sector). On the other hand, below-<strong>in</strong>vestment-grade classes from moderately seasoned deals will<br />
likely feel the impact of the poor real estate fundamentals <strong>in</strong> <strong>2004</strong>.<br />
Look<strong>in</strong>g at performance by v<strong>in</strong>tage, new deals are <strong>in</strong>sulated <strong>in</strong> the near term, but their higher<br />
leverage and lower subord<strong>in</strong>ation leaves an <strong>in</strong>vestor with a smaller marg<strong>in</strong> for error. Subord<strong>in</strong>ation<br />
levels for triple-A-rated CMBS tranches are around 20% today, compared to roughly 30% five years<br />
ago. The November 13, <strong>2003</strong> Moody's report, CMBS Loan Del<strong>in</strong>quency Rate Ramps Up Sharply As<br />
Leverage Increases, substantiates this concern. For example, the authors found that del<strong>in</strong>quency<br />
rates double for loans with LTVs of 80% to 90% versus loans with LTVs of 75% to 80%, and then<br />
more than double aga<strong>in</strong> for loans with LTVs greater than 90%. Deals from the 1998 v<strong>in</strong>tage will<br />
cont<strong>in</strong>ue to perform well compared to the 2000 v<strong>in</strong>tage despite somewhat higher securitization LTVs,<br />
due to the built up equity from property appreciation.<br />
Float<strong>in</strong>g rate loans could have some problems, particularly those that need to be re-f<strong>in</strong>anced <strong>in</strong> <strong>2004</strong>.<br />
Many of these were orig<strong>in</strong>ally 3-year loans on properties that were to be repositioned, but the weak<br />
real estate markets may make them difficult to re-f<strong>in</strong>ance.<br />
3. Spreads<br />
Senior <strong>in</strong>vestment grade CMBS are not cheap on a historical basis. They are fairly valued<br />
versus corporate bonds and fair to slightly cheap to residential mortgage products. CMBS<br />
have tightened less dur<strong>in</strong>g <strong>2003</strong> than other sectors, because <strong>in</strong>vestors recognize that the real estate<br />
recovery will lag the economic recovery. The real estate recovery will vary by property type and<br />
location, and on average, could take until the end of <strong>2004</strong> or well <strong>in</strong>to 2005 for commercial real estate<br />
to beg<strong>in</strong> to benefit from an improv<strong>in</strong>g economy. If del<strong>in</strong>quencies rise only modestly, as anticipated,<br />
spreads on CMBS relative to other sectors should hold <strong>in</strong>. On the other hand, if del<strong>in</strong>quencies were<br />
to unexpectedly rise sharply, spreads would widen across the board. In our view, CMBS spreads will<br />
not tighten further versus Treasuries unless corporate bond spreads and RMBS spreads cont<strong>in</strong>ue to<br />
tighten. By the end of the year, as the recovery takes hold, we expect senior <strong>in</strong>vestment grade<br />
CMBS spreads to ma<strong>in</strong> their levels versus corporates and tighten somewhat versus RMBS.<br />
For CMBS rated at or below triple-B-m<strong>in</strong>us, the spread story is a bit more complicated. Real estate<br />
fundamentals are weak, yet the market is anticipat<strong>in</strong>g a recovery. In our view this will lead a<br />
significant bifurcation <strong>in</strong> spreads between the new issue market and the secondary market for these<br />
credits. On the one hand, as del<strong>in</strong>quencies and defaults creep up, spreads on lower rated classes of<br />
outstand<strong>in</strong>g deals, will widen. Tranches will be traded on a very deal specific basis. On the other<br />
hand, <strong>in</strong> the new issue market, <strong>in</strong>vestors will bet that loans that are made <strong>in</strong> the current weak<br />
environment are underwritten with the current property level statistics, and therefore, will bid strongly<br />
for the lower rated classes, lead<strong>in</strong>g to a cont<strong>in</strong>u<strong>in</strong>g flatten<strong>in</strong>g of the new issue CMBS credit curve.<br />
While scenario analysis shows how well CMBS <strong>in</strong>terest-only tranches (IOs) holdup under stress<br />
scenarios, we th<strong>in</strong>k their spreads have tightened too far too fast and are vulnerable at current levels.<br />
2 For a description of these structures see Chambers, D. and Lynn, Z., Participated CMBS Loans: Too Many<br />
Cooks <strong>in</strong> the Kitchen?, Fitch special report (18 Nov <strong>2003</strong>).<br />
(28)
Nomura <strong>Fixed</strong> <strong>Income</strong> Research<br />
Whole loan spreads are relatively wide to triple-B-rated CMBS. We expect them to tighten <strong>in</strong> the first<br />
half of <strong>2004</strong>.<br />
4. Recommendations<br />
We expect a healthy supply of new issues, but sufficient demand to keep spreads stable <strong>in</strong> the most<br />
senior classes. With premium CMBS trad<strong>in</strong>g at almost even spread to par-priced bonds, we th<strong>in</strong>k<br />
<strong>in</strong>vestors are simply not gett<strong>in</strong>g paid to take what admittedly looks like a small risk at this po<strong>in</strong>t. For<br />
some seasoned deals, the risk may not be that small as del<strong>in</strong>quencies <strong>in</strong>crease, and defaults lead to<br />
prepayments without penalties and a shorten<strong>in</strong>g <strong>in</strong> duration via recoveries.<br />
In the near term, we expect IOs to widen on technical factors. In our view, IO <strong>in</strong>vestors should<br />
differentiate more on deals that have a high concentration of loans with A/B notes, mezzan<strong>in</strong>e debt<br />
and preferred equity. All of these <strong>in</strong>crease the probability of default even though the deals statistics<br />
show modest leverage.<br />
With<strong>in</strong> the <strong>in</strong>vestment grade sector, the triple-B sector at 90 bp versus swaps is most vulnerable to<br />
widen<strong>in</strong>g, particularly early <strong>in</strong> the year when <strong>in</strong>surance companies may prefer fill<strong>in</strong>g their whole loan<br />
quota rather than buy<strong>in</strong>g <strong>in</strong>to the triple-B CMBS sector.<br />
In the new issues market, we th<strong>in</strong>k the triple-B-m<strong>in</strong>us and below credits could tighten, as <strong>in</strong>vestors<br />
beg<strong>in</strong> to sense that real estate markets have bottomed and that underwrit<strong>in</strong>g is reflective of this<br />
environment.<br />
With a more difficult credit year ahead, <strong>in</strong>vestors <strong>in</strong> the secondary CMBS market need to be very<br />
discrim<strong>in</strong>at<strong>in</strong>g about the structure, collateral mix, v<strong>in</strong>tage and performance history of deals <strong>in</strong> the<br />
secondary markets. As deals pay down, and time passes, the <strong>in</strong>itial characteristics can change<br />
significantly. While <strong>in</strong> most cases subord<strong>in</strong>ation improves, the collateral mix can deteriorate. 3<br />
One novel idea might be to consider deals with credit tenant structures. Dur<strong>in</strong>g the economic<br />
downturn, these deals were shunned for perceived corporate credit risk. As the economy improves,<br />
these could look stronger.<br />
5. Trends <strong>in</strong> <strong>2004</strong><br />
The b-buyer market cont<strong>in</strong>ues to expand, with as many as eight potential bidders request<strong>in</strong>g<br />
<strong>in</strong>formation sometimes. Liquidity too is improv<strong>in</strong>g. Given this strong demand, modest tighten<strong>in</strong>g <strong>in</strong><br />
the below-<strong>in</strong>vestment-grade classes is possible, despite a weak real estate market.<br />
Other developments we see are: 1) subord<strong>in</strong>ate buyers bidd<strong>in</strong>g as a team or <strong>in</strong> partnership; 2) more<br />
frequent securitization of mezzan<strong>in</strong>e debt as mezzan<strong>in</strong>e money appears amply available and new<br />
funds are appear<strong>in</strong>g regularly; 3) loans <strong>in</strong> the $60-$80 million range hav<strong>in</strong>g more pooled capital<br />
structure <strong>in</strong> place of A/B structures as <strong>in</strong>vestors tolerate higher leverage and bigger loans <strong>in</strong> fusion<br />
deals and; 4) more hotel deals <strong>in</strong> terms of total volume (not percentage) that are readily absorbed <strong>in</strong><br />
what will be a strong issuance year for CMBS.<br />
We th<strong>in</strong>k that rat<strong>in</strong>g agency leverage has gone about as far as it can, particularly as <strong>in</strong>terest rates<br />
beg<strong>in</strong> to move up <strong>in</strong> <strong>2004</strong>. Moreover, subord<strong>in</strong>ation for conduit loans <strong>in</strong> the mid-range size will not<br />
tighten much more <strong>in</strong> <strong>2004</strong> only because the levels have moved too quickly.<br />
With s<strong>in</strong>gle asset deals and large loan deals still disfavored by <strong>in</strong>vestors, we expect to see an<br />
<strong>in</strong>creas<strong>in</strong>g number of fusion deals. In addition, the average loan size of the top 10 deals will likely<br />
cont<strong>in</strong>ue to <strong>in</strong>crease.<br />
3 Phillips, J. and Hoyt, E., Ag<strong>in</strong>g Deals: Changes <strong>in</strong> CMBS Diversity and Loan Concentration Over Time and Other<br />
age Related Issues, Nomura fixed <strong>in</strong>come research (8 October 2002)<br />
(29)
Nomura <strong>Fixed</strong> <strong>Income</strong> Research<br />
V<strong>in</strong>tage<br />
Top Ten Percentages & Average Loan Sizes by Deal Type and V<strong>in</strong>tage<br />
Deal Type<br />
Amount<br />
Issued<br />
($bn)<br />
# of Deals<br />
Average<br />
Top Ten<br />
(%)<br />
Average<br />
Deal Size<br />
($mm)<br />
Average<br />
Loan Size<br />
of Top Ten<br />
($mm)<br />
Conduit 27.75 31 32.65 895.2 29.2<br />
2000 S<strong>in</strong>gle Borrower 4.25 14 100 303.8 30.4<br />
Large Loan 0.39 1 100 393.2 39.3<br />
Conduit 35.88 35 33.88 1025.1 34.7<br />
2001 S<strong>in</strong>gle Borrower 5.38 17 100 316.3 31.6<br />
Large Loan 1.94 3 100 646.3 64.6<br />
Conduit 35.15 35 37.91 1004.3 38.1<br />
2002 S<strong>in</strong>gle Borrower 3.36 12 100 279.7 28.0<br />
Large Loan 5.13 6 98.17 855.5 84.0<br />
Conduit 53.40 47 44.24 1136.1 50.3<br />
<strong>2003</strong> S<strong>in</strong>gle Borrower 8.58 28 98.96 306.5 30.3<br />
Large Loan 11.79 13 90.20 906.8 81.8<br />
Source: Trepp LLC<br />
Other trends we anticipate will be: 1) a preoccupation with <strong>in</strong>terest short falls and the role of the<br />
special servicer, especially as del<strong>in</strong>quencies rise; 2) the <strong>in</strong>creas<strong>in</strong>g diversion of multi-family loans to<br />
conduits and away from the agencies which tightened their requirements and leverage; and 3)<br />
(despite lack<strong>in</strong>g appeal to b-buyers) the <strong>in</strong>creased availability of tenant-<strong>in</strong>-common (TIC) structures<br />
where borrowers buy properties as tenants <strong>in</strong> common and each TIC is a separate special purpose<br />
entity (SPE) much like a syndicated loan.<br />
F<strong>in</strong>ally, while the terrorism <strong>in</strong>surance issue is off the table for now, the availability and utility of<br />
environmental <strong>in</strong>surance has decreased due to policy changes by <strong>in</strong>surance providers. In particular,<br />
environmental <strong>in</strong>surance had been available to cover exist<strong>in</strong>g conditions, so where no party had been<br />
identified to clean up a condition a lender or buyer could <strong>in</strong>stead buy environmental <strong>in</strong>surance for a<br />
ta<strong>in</strong>ted property (<strong>in</strong> addition to the <strong>in</strong>dividual's liability on the carve-outs). The <strong>in</strong>surers offer<strong>in</strong>g such<br />
coverage have s<strong>in</strong>ce limited what they will cover, so <strong>in</strong>stead of hav<strong>in</strong>g coverage for the loan amount<br />
as was previously offered, one may now be limited to the costs necessary to meet local<br />
environmental law. This may still leave one with a ta<strong>in</strong>ted property that can not be sold for the loan<br />
amount, so the coverage does not elim<strong>in</strong>ate the problem the way the old coverage did.<br />
B. Review of <strong>2003</strong><br />
1. Issuance<br />
CMBS issuance was approximately $71 billion <strong>in</strong> early December, and total <strong>2003</strong> issuance is likely to<br />
be approximately $75 billion. Whether consider<strong>in</strong>g the CMBS market by itself, or look<strong>in</strong>g at the whole<br />
loan market, <strong>2003</strong> was a very strong issuance year.<br />
Unlike issuance volumes <strong>in</strong> the residential mortgage market, which were driven by low <strong>in</strong>terest rates<br />
and record re-f<strong>in</strong>anc<strong>in</strong>g activity, the volume of commercial mortgage debt issuance has added to the<br />
dollar volume outstand<strong>in</strong>g.<br />
Accord<strong>in</strong>g to the 25 th anniversary edition of Emerg<strong>in</strong>g Trends <strong>in</strong> Real Estate, by ULI and<br />
PricewaterhouseCoopers, <strong>in</strong>stitutional real estate debt now exceeds $2 trillion for the first time.<br />
All major lend<strong>in</strong>g sources <strong>in</strong>creased their lend<strong>in</strong>g, but banks far and away lead the pack. Banks now<br />
comprise about 42.6% of the <strong>in</strong>stitutional real estate debt compared to non-government CMBS with<br />
16.1% and life <strong>in</strong>surance companies with 11.5%. 4<br />
4 Basel II may could cause bank's to lower their allocation to real estate loans as it will likely require banks to hold<br />
more capital aga<strong>in</strong>st real estate loans.<br />
(30)
Nomura <strong>Fixed</strong> <strong>Income</strong> Research<br />
Lend<strong>in</strong>g activity was brisk and property acquisitions drove a significant portion of the volume. Low<br />
<strong>in</strong>terest rates helped to lower cap rates, which <strong>in</strong> turn motivated sellers. Buyers locked-<strong>in</strong> low <strong>in</strong>terest<br />
rates to support their cap rates, and lenders, both traditional and the CMBS market, accommodated<br />
borrowers with more aggressive leverage.<br />
Domestic CMBS Issuance 1998-<strong>2003</strong><br />
80<br />
70<br />
Q1 Q2 Q3 Q4<br />
60<br />
Amount ($bn)<br />
50<br />
40<br />
30<br />
20<br />
10<br />
0<br />
1998 1999 2000 2001 2002 <strong>2003</strong><br />
Sources: Commercial Mortgage Alert, Nomura<br />
The conduit and fusion deal type cont<strong>in</strong>ued to grow as the format of choice for CMBS issuance.<br />
Together, these accounted for 67% of deals <strong>in</strong> <strong>2003</strong> (year to date) compared to 60% <strong>in</strong> 2002. We<br />
expect this format to cont<strong>in</strong>ue to dom<strong>in</strong>ate CMBS issuance. With the <strong>in</strong>creas<strong>in</strong>g percentage of larger<br />
loans <strong>in</strong> these deals, rather than simply us<strong>in</strong>g constant default rates (CDRs) as stress scenarios, we<br />
believe <strong>in</strong>vestors need to run a comb<strong>in</strong>ation of CDRs on the set of loans with small balances and net<br />
operat<strong>in</strong>g <strong>in</strong>come (NOI) stresses on the larger size loans s<strong>in</strong>ce straight CDR analysis will not<br />
adequately capture the loans' lump<strong>in</strong>ess. This is particularly true <strong>in</strong> look<strong>in</strong>g at CMBS IOs s<strong>in</strong>ce much<br />
of their performance is driven by defaults. Although big loans may use an A/B note structure to lower<br />
leverage, it does not reduce the probability of default, but the loss severity.<br />
In <strong>2003</strong>, retail loans <strong>in</strong>creased their share of CMBS deals to over 33% of the new issue market, up<br />
from 30% <strong>in</strong> 2002, whereas office loans cont<strong>in</strong>ued to decl<strong>in</strong>e, runn<strong>in</strong>g currently at less than 25% of<br />
new issues. Insurance company lend<strong>in</strong>g trends were similar, with an <strong>in</strong>creas<strong>in</strong>g allocation to retail,<br />
and a decreas<strong>in</strong>g allocation to offices. For example, <strong>in</strong> the third quarter of <strong>2003</strong>, <strong>in</strong>surance<br />
companies allocated 29.4% of commitments to the retail sector and 28.8% to the office sector,<br />
whereas a year ago they allocated 19.3% to retail and 23.7% to offices.<br />
2. Credit<br />
CMBS del<strong>in</strong>quencies rose steadily <strong>in</strong> <strong>2003</strong>. The "core" (60+90+foreclosure and REO) del<strong>in</strong>quency<br />
rate for CMBS conduit/fusion deals reached 2.04% as of November <strong>2003</strong>.<br />
(31)
Nomura <strong>Fixed</strong> <strong>Income</strong> Research<br />
Del<strong>in</strong>quencies <strong>in</strong> CMBS Conduit/Fusion Deals<br />
Del<strong>in</strong>quency (%)<br />
2.0%<br />
1.8%<br />
1.6%<br />
1.4%<br />
1.2%<br />
1.0%<br />
0.8%<br />
0.6%<br />
0.4%<br />
0.2%<br />
0.0%<br />
ACLI<br />
Core<br />
Jun-00<br />
Dec-00<br />
Jun-01<br />
Dec-01<br />
Jun-02<br />
Dec-02<br />
Jun-03<br />
Note: Core = 60 + 90 + Foreclosure + REO<br />
Sources: ACLI, Trepp LLC, Nomura<br />
Accord<strong>in</strong>g to RealPo<strong>in</strong>t Research, "the total unpaid pr<strong>in</strong>cipal balance for specially-serviced CMBS"<br />
that are del<strong>in</strong>quent is runn<strong>in</strong>g at about $4.73 billion as of September <strong>2003</strong>, up from $3.69 billion <strong>in</strong><br />
October 2002.<br />
Hotel and retail loans account for the largest percentage of del<strong>in</strong>quent loans with hotels compris<strong>in</strong>g<br />
24.83% of del<strong>in</strong>quencies and retail 23.16%. As <strong>in</strong> prior periods, hotel del<strong>in</strong>quencies greatly exceed<br />
their representation with<strong>in</strong> the CMBS universe, whereas retail del<strong>in</strong>quencies rema<strong>in</strong> underrepresented.<br />
Healthcare, which will cont<strong>in</strong>ue to dim<strong>in</strong>ish as a sector <strong>in</strong> CMBS, also rema<strong>in</strong>s overrepresented.<br />
Office del<strong>in</strong>quencies are fewer than those of retail, but <strong>in</strong>creased the most over the past year and we<br />
expect cont<strong>in</strong>ued <strong>in</strong>creases <strong>in</strong> <strong>2004</strong>. In the October 14, <strong>2003</strong> report by Fitch, CMBS Loan Losses:<br />
Property Type Highlights and Trends, the rat<strong>in</strong>g agency also concludes that the office and <strong>in</strong>dustrial<br />
sectors will cont<strong>in</strong>ue to demonstrate <strong>in</strong>creased defaults and losses over the next 18 to 24 months.<br />
(32)
Nomura <strong>Fixed</strong> <strong>Income</strong> Research<br />
CMBS Del<strong>in</strong>quencies by Property Type<br />
35%<br />
30%<br />
25%<br />
% of Market<br />
% of Del<strong>in</strong>quencies<br />
Percentage<br />
20%<br />
15%<br />
10%<br />
5%<br />
0%<br />
Retail<br />
Office<br />
Multi-Family<br />
Lodg<strong>in</strong>g<br />
Industrial<br />
Other<br />
Mixed Use<br />
Mobile Home<br />
Healthcare<br />
Self Storage<br />
Sources: Trepp, Nomura<br />
2.0<br />
CMBS Conduit/Fusion Del<strong>in</strong>quencies<br />
12.5<br />
1.8<br />
1.5<br />
10.0<br />
Total Del<strong>in</strong>quency (%)<br />
1.3<br />
1.0<br />
0.8<br />
7.5<br />
5.0<br />
0.5<br />
0.3<br />
2.5<br />
0.0<br />
Jan-00 Jan-01 Jan-02 Jan-03<br />
0.0<br />
Office Multi-Family Industrial<br />
Retail Healthcare (right scale) Lodg<strong>in</strong>g (right scale<br />
Sources: Trepp, Nomura<br />
(33)
Nomura <strong>Fixed</strong> <strong>Income</strong> Research<br />
In terms of geography, Texas and Florida show the highest levels of del<strong>in</strong>quency, together<br />
compris<strong>in</strong>g close to 19% of del<strong>in</strong>quent loans, while California, which comprises about 8.5% of<br />
del<strong>in</strong>quencies, is under-represented given its roughly 20% portion of outstand<strong>in</strong>g CMBS loans.<br />
Special servicer portfolios (not surpris<strong>in</strong>gly) cont<strong>in</strong>ue to have a relatively large proportion of hotel<br />
loans. There is significant concentration of specially serviced loans with the top six servicers hav<strong>in</strong>g<br />
an 87.2% market share. Over the past year, special servicers' tactics and their aggressiveness <strong>in</strong><br />
resolv<strong>in</strong>g a loan have been scrut<strong>in</strong>ized. One key issue is whether the special servicer should adopt a<br />
higher risk profile <strong>in</strong> litigation to try and get more, but potentially lose more. The question becomes<br />
even more complicated when the special servicer is the owner of one of the junior classes <strong>in</strong> the deal.<br />
The worst v<strong>in</strong>tage by the measure of its del<strong>in</strong>quency rate cont<strong>in</strong>ues to be deals done <strong>in</strong> 1995, com<strong>in</strong>g<br />
<strong>in</strong> at above 8%. This is followed by the 1997 v<strong>in</strong>tage with del<strong>in</strong>quencies runn<strong>in</strong>g above 4%. By dollar<br />
amount, 1998 has the largest percentage of total del<strong>in</strong>quencies, but to date, it was the largest<br />
issuance year. Most studies cont<strong>in</strong>ue to show that defaults for a pool peak around the fourth year<br />
after orig<strong>in</strong>ation and then decl<strong>in</strong>e. Thus, we would expect to see the del<strong>in</strong>quency rate from the older<br />
v<strong>in</strong>tages to beg<strong>in</strong> to decl<strong>in</strong>e <strong>in</strong> <strong>2004</strong>. In contrast, we believe that some of the more recent v<strong>in</strong>tages,<br />
such as 2000, will have below-average performance as they were underwritten when rents and rent<br />
growth were at their peak.<br />
CMBS Del<strong>in</strong>quencies by Orig<strong>in</strong>ation <strong>Year</strong><br />
9%<br />
8%<br />
7%<br />
Total Del<strong>in</strong>quency (%)<br />
6%<br />
5%<br />
4%<br />
3%<br />
2%<br />
1%<br />
0%<br />
1994<br />
1995<br />
1996<br />
1997<br />
1998<br />
1999<br />
2000<br />
2001<br />
2002<br />
<strong>2003</strong><br />
Sources: Trepp LLC, Nomura<br />
At the writ<strong>in</strong>g of our mid-year report (which <strong>in</strong>cluded rat<strong>in</strong>gs actions taken through May 30, <strong>2003</strong>), the<br />
total upgrade-to-downgrade ratio across all <strong>in</strong>vestment grade and non-<strong>in</strong>vestment grade classes was<br />
about 0.96. S<strong>in</strong>ce then, upgrades have significantly outpaced downgrades, and year-to-date, the<br />
total upgrade-to-downgrade ratio is approximately 1.7 to 1 (672:388). As is usually the case, classes<br />
<strong>in</strong>itially rated <strong>in</strong>vestment grade accounted for the lion's share of the upgrades (575 out of 672), while<br />
subord<strong>in</strong>ate classes took a majority of the downgrades (229 out of 388).<br />
(34)
Nomura <strong>Fixed</strong> <strong>Income</strong> Research<br />
An <strong>in</strong>terest<strong>in</strong>g rat<strong>in</strong>gs trend that we are start<strong>in</strong>g to see more of is the simultaneous upgrade and<br />
downgrade of different classes from the same deal. This was highlighted by a recent Fitch report, 5<br />
where such a rat<strong>in</strong>gs action is referred to as a "barbell" effect. The authors write, "As loans amortize<br />
or pay off, <strong>in</strong>vestment-grade classes experience <strong>in</strong>creased credit support, becom<strong>in</strong>g even more<br />
protected from losses. The payoffs, however, frequently have the opposite effect on lower-rated<br />
tranches as riskier loans beg<strong>in</strong> to make up a larger proportion of the rema<strong>in</strong><strong>in</strong>g collateral." We expect<br />
this type of rat<strong>in</strong>gs action to become more common as loans from older deal v<strong>in</strong>tages beg<strong>in</strong> los<strong>in</strong>g<br />
their prepayment protection and ref<strong>in</strong>ance <strong>in</strong>to the current, borrower friendly, low-rate environment.<br />
Leverage has cont<strong>in</strong>ued to <strong>in</strong>crease by all measures. Moody's stressed LTV for the conduit portion of<br />
rated deals has reached over 90%. Accord<strong>in</strong>g to the most recent (NCREIF) report, <strong>in</strong>stitutional<br />
owners of real estate have been <strong>in</strong>creas<strong>in</strong>g their leverage, as have the REITs (currently over 50%).<br />
In addition, the percentage of levered properties <strong>in</strong> the NCREIF universe has doubled <strong>in</strong> the past four<br />
years.<br />
At the same time, subord<strong>in</strong>ation levels have been trend<strong>in</strong>g down. Much of the recent drop <strong>in</strong><br />
subord<strong>in</strong>ation is due to the lower leverage from the A/B structure of the large size loans <strong>in</strong> the fusion<br />
deals. Still, the protection is less than it used to be both at the triple-A level and the triple-B level, and<br />
it is quite clear from the performance numbers that the orig<strong>in</strong>al subord<strong>in</strong>ation levels were probably too<br />
conservative.<br />
Moody's Stressed LTV for Conduit Portion of Rated Deals<br />
92<br />
91<br />
90<br />
Stressed LTV (%)<br />
89<br />
88<br />
87<br />
86<br />
85<br />
84<br />
1Q99<br />
2Q99<br />
3Q99<br />
4Q99<br />
1Q00<br />
2Q00<br />
3Q00<br />
4Q00<br />
1Q01<br />
2Q01<br />
3Q01<br />
4Q01<br />
1Q02<br />
2Q02<br />
3Q02<br />
4Q02<br />
1Q03<br />
2Q03<br />
3Q03<br />
Source: Moody's<br />
5 See MacNeill, M., O'Rourke, M., and Johnson, B., <strong>2003</strong> CMBS Upgrades and Downgrades, Fitch special report<br />
(10 Dec <strong>2003</strong>).<br />
(35)
Nomura <strong>Fixed</strong> <strong>Income</strong> Research<br />
Trends <strong>in</strong> Conduit and Fusion Subord<strong>in</strong>ation Levels<br />
31<br />
13<br />
29<br />
12<br />
27<br />
11<br />
Aaa Subord<strong>in</strong>ation (%)<br />
25<br />
23<br />
21<br />
19<br />
10<br />
9<br />
8<br />
7<br />
Baa3 Subord<strong>in</strong>ation (%)<br />
17<br />
Aaa Sub % (left scale)<br />
Baa3 Sub % (right scale)<br />
15<br />
Q1 98<br />
Q3 98<br />
Q1 99<br />
Q3 99<br />
Q1 00<br />
Q3 00<br />
Q1 01<br />
Q3 01<br />
Q1 02<br />
Q3 02<br />
Q1 03<br />
Q3 03<br />
6<br />
5<br />
Sources: Moody's, Commercial Mortgage Alert, Nomura<br />
3. Spreads<br />
Spreads on CMBS versus Treasuries and swaps have tightened over the past year and are close to<br />
the tights for the year. The biggest move was <strong>in</strong> the triple-B and IO classes which have tightened by<br />
60 bp and 80/140 (PAC, Companion) bp, respectively. In the most senior classes, we are currently at<br />
the tightest levels s<strong>in</strong>ce 1998. The move <strong>in</strong> the IO spread, both PAC IOs and companion IOs, over<br />
the past several months has been extraord<strong>in</strong>ary. What is somewhat surpris<strong>in</strong>g is that given the<br />
<strong>in</strong>creas<strong>in</strong>g number of b-buyers, the spread for BB and B rated bonds has hardly moved, perhaps<br />
reflect<strong>in</strong>g the views of these real estate experts that there are still some rough waters ahead <strong>in</strong> the<br />
commercial real estate markets.<br />
In addition to the overall tighten<strong>in</strong>g, the credit curve has cont<strong>in</strong>ued to flatten. The spread between<br />
triple-B and triple-A CMBS narrowed from 95 bp to 57 bp. In contrast, the spread between triple-B<br />
CMBS and whole loan commercial mortgages widened by approximately 25 bp. Given this relatively<br />
wide spread, we expect that at least at the beg<strong>in</strong>n<strong>in</strong>g of <strong>2004</strong>, those <strong>in</strong>surance companies that still<br />
have whole loan departments might be more <strong>in</strong>cl<strong>in</strong>ed to orig<strong>in</strong>ate whole loans, and leave the triple-B<br />
CMBS for the CDO market.<br />
(36)
Nomura <strong>Fixed</strong> <strong>Income</strong> Research<br />
CMBS Spreads as of 5 Dec <strong>2003</strong><br />
3mo 6mo 1yr<br />
Z<br />
Stdev<br />
Tight<br />
Wide<br />
Mean<br />
Z<br />
Stdev<br />
Tight<br />
Wide<br />
Mean<br />
Z<br />
Stdev<br />
Tight<br />
Wide<br />
Mean<br />
Last<br />
5-yr AAA/ Swaps 32 33 37 31 2 (0.5) 33 37 30 2 (0.5) 37 46 30 5 (1.0)<br />
10-yr AAA/Swaps 33 34 38 31 3 (0.3) 34 38 31 2 (0.7) 39 50 31 5 (1.0)<br />
AA / Swaps 42 43 47 40 3 (0.4) 43 47 40 2 (0.5) 48 64 40 7 (0.9)<br />
A / Swaps 51 53 57 50 3 (0.5) 51 57 48 3 (0.1) 58 84 48 10 (0.7)<br />
BBB / Swaps 90 99 110 90 7 (1.4) 99 110 90 6 (1.4) 114 145 90 18 (1.4)<br />
BBB- / Swaps 145 151 165 145 6 (1.0) 154 165 145 7 (1.3) 164 185 145 13 (1.5)<br />
5-yr AAA/ Treas 73 75 83 70 3 (0.5) 74 91 66 6 (0.2) 78 93 64 9 (0.6)<br />
10-yr AAA/Treas 72 76 87 72 4 (0.9) 77 94 68 7 (0.7) 81 96 68 9 (1.0)<br />
AA / Treas 81 85 97 81 5 (1.0) 85 101 77 7 (0.6) 90 110 77 10 (0.9)<br />
A / Treas 90 95 107 90 5 (1.0) 94 108 83 8 (0.5) 100 130 83 12 (0.8)<br />
BBB / Treas 129 141 160 129 9 (1.3) 141 161 129 10 (1.2) 156 191 129 19 (1.4)<br />
BBB- / Treas 184 193 215 184 8 (1.1) 196 219 184 11 (1.1) 206 231 184 14 (1.6)<br />
BB/Treas 475 475 475 475 0 NA 475 475 475 0 NA 484 500 475 11 (0.9)<br />
B/Treas 975 975 975 975 0 NA 975 975 975 0 NA 975 975 975 0 NA<br />
Collateral Strip IO 275 293 300 275 12 (1.5) 296 300 275 9 (2.4) 310 325 275 16 (2.2)<br />
PAC IO/Treas 65 69 80 55 6 (0.7) 79 100 55 12 (1.2) 100 145 55 25 (1.4)<br />
Companion IO/Treas 350 379 425 350 27 (1.0) 400 425 350 30 (1.7) 434 490 350 42 (2.0)<br />
CMBS Whole Loan/Treas 152 158 168 152 5 (1.2) 157 170 148 6 (0.8) 166 189 148 12 (1.1)<br />
CMBS Whole Loan vs.<br />
BBB<br />
23 17 25 8 6 1.2 16 25 1 6 1.2 10 25 (6) 9 1.6<br />
Sources: Bloomberg, Nomura<br />
200<br />
CMBS Spreads to Swaps (Dec <strong>2003</strong> vs Dec 2002)<br />
180<br />
160<br />
3-Dec-02<br />
3-Dec-03<br />
145<br />
145<br />
Spread (bp)<br />
120<br />
80<br />
46<br />
50<br />
64<br />
84<br />
90<br />
40<br />
32<br />
33<br />
42<br />
51<br />
0<br />
5-yr "AAA" 10-yr "AAA" AA A BBB BBB-<br />
Sources: Nomura<br />
While CMBS has tightened substantially, it underperformed corporate bonds, which <strong>in</strong> the A-rated<br />
<strong>in</strong>dustrial sector tightened by roughly 60 bp. RMBS also outperformed CMBS for the year, with 10-<br />
year PACs tighten<strong>in</strong>g by 20 bp and 10-year sequentials tighten<strong>in</strong>g by 33 bp, although their total return<br />
was adversely impacted a bit by their negative convexity.<br />
(37)
Nomura <strong>Fixed</strong> <strong>Income</strong> Research<br />
C. Real Estate Markets<br />
a) Overview<br />
Cap rates <strong>in</strong> most markets dropped throughout <strong>2003</strong>, but by a lesser amount than Treasury rates.<br />
While total returns for real estate were solid <strong>in</strong> <strong>2003</strong>, this was largely a function of the <strong>in</strong>come<br />
component, rather than price appreciation. Investors who had hoped that economic recovery would<br />
quickly turn around the demand for space were disappo<strong>in</strong>ted by the outcome. The reality is that the<br />
property market fundamentals are weak, and their recovery will lag economic recovery by a good 18<br />
months <strong>in</strong> many sectors.<br />
Vacancies have probably peaked, and rents are bottom<strong>in</strong>g. In fact, the decent performance <strong>in</strong> the<br />
face of such weak fundamentals could be attributed to the lower <strong>in</strong>terest rates, which supported<br />
returns by br<strong>in</strong>g<strong>in</strong>g cap rates down. The problem for the property markets is that as <strong>in</strong>terest rates<br />
rise, cap rates will be pushed up without a commensurate rise <strong>in</strong> NOI.<br />
Historical Cap Rates for Various Property Types<br />
12.0<br />
8.0<br />
11.5<br />
7.5<br />
Cap Rate (%)<br />
11.0<br />
10.5<br />
10.0<br />
9.5<br />
9.0<br />
8.5<br />
7.0<br />
6.5<br />
6.0<br />
5.5<br />
5.0<br />
4.5<br />
8.0<br />
7.5<br />
1Q 1995<br />
1Q 1996<br />
1Q 1997<br />
1Q 1998<br />
1Q 1999<br />
1Q 2000<br />
1Q 2001<br />
1Q 2002<br />
1Q <strong>2003</strong><br />
10-yr Treasury Yield (%)<br />
4.0<br />
3.5<br />
Office Retail Industrial Apartment Hotel 10-yr Treas<br />
Sources: RERC Real Estate Report, Nomura<br />
Beyond the near term, the k<strong>in</strong>d of economic recovery we have will significantly impact the recovery <strong>in</strong><br />
the property markets. Demand for office space is driven by employment. If service sector and even<br />
high-tech jobs cont<strong>in</strong>ue to be outsourced overseas, the recovery <strong>in</strong> the office property market and<br />
<strong>in</strong>dustrial R&D market will be anemic. The key to cont<strong>in</strong>ued performance <strong>in</strong> retail is obviously the<br />
consumer, and whether the consumer performs now that the tax cut and cash-out<br />
mortgage/ref<strong>in</strong>anc<strong>in</strong>g wave is over.<br />
NCREIF Total Returns<br />
Total <strong>Income</strong> Appreciation<br />
3Q <strong>2003</strong> 1.97 1.90 0.07<br />
2Q <strong>2003</strong> 2.09 1.98 0.11<br />
1Q <strong>2003</strong> 1.88 1.96 (0.08)<br />
4Q 2002 1.67 1.96 (0.29)<br />
1-yr 7.84 8.03 (0.18)<br />
3-yr 7.87 8.43 (0.53)<br />
5-yr 9.47 8.44 0.97<br />
10-yr 9.73 8.68 0.98<br />
Source: NCREIF<br />
(38)
Nomura <strong>Fixed</strong> <strong>Income</strong> Research<br />
b) Sector Review & <strong>Outlook</strong><br />
Historical & Projected Vacancies by Property Type<br />
18<br />
16<br />
14<br />
12<br />
Vacancy (%)<br />
10<br />
8<br />
6<br />
4<br />
2<br />
0<br />
1997<br />
1998<br />
1999<br />
2000<br />
2001<br />
2002<br />
<strong>2003</strong>E<br />
<strong>2004</strong>P<br />
2005P<br />
2006P<br />
2007P<br />
Retail Industrial Office Apartment<br />
Source: REIS<br />
Historical & Projected Effective Rent Growth by Property Type<br />
15<br />
Effective Rent Growth (%)<br />
10<br />
5<br />
0<br />
-5<br />
-10<br />
1997<br />
1998<br />
1999<br />
2000<br />
2001<br />
2002<br />
<strong>2003</strong>E<br />
<strong>2004</strong>P<br />
2005P<br />
2006P<br />
2007P<br />
Retail Industrial Office Apartment<br />
Source: REIS<br />
(1) Multi-family<br />
Apartment properties performed reasonably well for the 12-month period end<strong>in</strong>g with the third<br />
quarter. Apartment and retail properties were the two sectors show<strong>in</strong>g property price appreciation <strong>in</strong><br />
the NCREIF <strong>in</strong>dex. For the one-year period, apartments showed a 2.33% appreciation return that,<br />
comb<strong>in</strong>ed with a 6.44% <strong>in</strong>come return, had a total return of 8.87%.<br />
(39)
Nomura <strong>Fixed</strong> <strong>Income</strong> Research<br />
Competition from s<strong>in</strong>gle-family homes has been a factor pressur<strong>in</strong>g apartments over the past several<br />
years as buyers, who had been on the edge, were able to qualify for mortgages with the historically<br />
low <strong>in</strong>terest rates. In particular, some of the apartments cater<strong>in</strong>g to the middle- and middle-upper<br />
class were negatively impacted. Lower-<strong>in</strong>come apartments have not been hit as much. The effects<br />
have shown up and are reflected <strong>in</strong> a ris<strong>in</strong>g vacancy rate and negative to low-positive effective rent<br />
growth.<br />
We agree with the common view that a ris<strong>in</strong>g <strong>in</strong>terest rate environment will alleviate some of the<br />
pressure. However, because of the current over-supply <strong>in</strong> some markets and the fact that there has<br />
been a run-up <strong>in</strong> prices, this market will struggle through <strong>2004</strong>.<br />
(2) Office<br />
The office market by every measure is <strong>in</strong> pa<strong>in</strong>. For the past three quarters, there has been negative<br />
absorption, ris<strong>in</strong>g vacancy, and decl<strong>in</strong><strong>in</strong>g effective rent <strong>in</strong> over 60% of the top 50 markets, accord<strong>in</strong>g<br />
to REIS. In fact, the office market has been suffer<strong>in</strong>g for several years.<br />
REIS Suffer<strong>in</strong>g Meter: Number of Top 50 Office Markets<br />
Experienc<strong>in</strong>g:<br />
Negative<br />
Decl<strong>in</strong><strong>in</strong>g<br />
Ris<strong>in</strong>g Vacancy<br />
Absorption<br />
Effective Rent<br />
Q1 <strong>2003</strong> 31 35 42<br />
Q2 <strong>2003</strong> 27 31 42<br />
Q3 <strong>2003</strong> 31 31 41<br />
Source: REIS<br />
Of all the major property types, offices had the poorest performance, show<strong>in</strong>g a 4.19% total return for<br />
the past four quarters, and 1.25% <strong>in</strong> the most recent quarter, as measured by NCREIF. Offices lost<br />
3.95% <strong>in</strong> price last year, they report, with an average price change of –2.82% per year for the past<br />
three years. Regional conditions were even worse. Western region offices lost 4.15% per year over<br />
the past three years. These drops are why balloon risk, especially for 5-year balloon mortgages<br />
orig<strong>in</strong>ated <strong>in</strong> 1999, is significant!<br />
Moreover, NOI will certa<strong>in</strong>ly suffer as leases beg<strong>in</strong> to rollover <strong>in</strong> the next several years as some rental<br />
rates have fallen to mid 1990's levels or lower. REIS projects negative effective rent growth for <strong>2004</strong>.<br />
Historical Cap Rates for the Office Sector<br />
12.0<br />
8.0<br />
11.5<br />
7.5<br />
Cap Rate (%)<br />
11.0<br />
10.5<br />
10.0<br />
9.5<br />
9.0<br />
8.5<br />
7.0<br />
6.5<br />
6.0<br />
5.5<br />
5.0<br />
4.5<br />
8.0<br />
7.5<br />
1Q 1995<br />
1Q 1996<br />
1Q 1997<br />
1Q 1998<br />
1Q 1999<br />
1Q 2000<br />
1Q 2001<br />
1Q 2002<br />
1Q <strong>2003</strong><br />
10-yr Treasury Yield (%)<br />
4.0<br />
3.5<br />
CBD Suburban 10-yr Treasury Yield<br />
Source: RERC Real Estate Report, Nomura<br />
(40)
Nomura <strong>Fixed</strong> <strong>Income</strong> Research<br />
While office cap rates decl<strong>in</strong>ed a bit <strong>in</strong> <strong>2003</strong>, suburban offices are at the same levels as mid 1999<br />
even though Treasuries have dropped by over 200 bp. Vacancy rates are comparable to those of<br />
1993. Unless the economy becomes super-charged, it will take a while to absorb the space. The<br />
only good th<strong>in</strong>g that we can say about the office market is that <strong>2004</strong> will probably not be worse than<br />
<strong>2003</strong>.<br />
(3) Retail<br />
It is a relief to move the discussion from offices to retail. Retail has been the sh<strong>in</strong><strong>in</strong>g star, supported<br />
by an <strong>in</strong>satiable American consumer who could spend dur<strong>in</strong>g the economic slowdown because of tax<br />
cuts and cash-out refis. Vacancies rema<strong>in</strong> well below the peaks set <strong>in</strong> the early 1990's real estate<br />
recession. REIS projects <strong>in</strong>creas<strong>in</strong>gly positive effective rent growth for the next several years. While<br />
all retail sectors have participated, retail power centers seem to have done the best. On a total return<br />
basis, retail posted a 3.04% return <strong>in</strong> the third quarter of <strong>2003</strong> and one-year return of 15.28%,<br />
accord<strong>in</strong>g to NCREIF! Accord<strong>in</strong>g to REIS <strong>in</strong> the last quarter, less than 25% of the top 48 markets<br />
experienced decl<strong>in</strong><strong>in</strong>g effective rents. Long term, Internet shopp<strong>in</strong>g rema<strong>in</strong>s a threat and concerned<br />
<strong>in</strong>vestors should focus on grocery-anchored retail.<br />
Historical Cap Rates for the Retail Sector<br />
12.0<br />
8.0<br />
11.5<br />
7.5<br />
Cap Rate (%)<br />
11.0<br />
10.5<br />
10.0<br />
9.5<br />
9.0<br />
8.5<br />
7.0<br />
6.5<br />
6.0<br />
5.5<br />
5.0<br />
4.5<br />
10yr Treasury Yield (%)<br />
8.0<br />
4.0<br />
7.5<br />
3.5<br />
1Q 1995<br />
1Q 1996<br />
1Q 1997<br />
1Q 1998<br />
1Q 1999<br />
1Q 2000<br />
1Q 2001<br />
1Q 2002<br />
1Q <strong>2003</strong><br />
Retail - Regional Malls<br />
Retail - Neigh/Comm<br />
Retail - Power Centers<br />
10-yr Treasury Yield<br />
Sources: RERC Real Estate Report, Nomura<br />
(4) Industrial<br />
Industrial properties, usually considered a very stable property type, have had a bad three years.<br />
Accord<strong>in</strong>g to Torto Wheaton Research (TWR), vacancies <strong>in</strong> the <strong>in</strong>dustrial market have shot up from<br />
6.3% <strong>in</strong> 2000, to 11.7% <strong>in</strong> the third quarter of <strong>2003</strong>. Over this same time period real rents decl<strong>in</strong>ed at<br />
an accelerat<strong>in</strong>g rate. These statistics <strong>in</strong>dicate that this downturn is much worse than the 1991<br />
decl<strong>in</strong>e.<br />
To understand this terrible performance on the one hand, and the decl<strong>in</strong>e <strong>in</strong> cap rates to below 9% on<br />
the other hand, one must first recognize the significant difference <strong>in</strong> performance between research &<br />
development (R&D) space and warehouse/distribution space. Us<strong>in</strong>g NCREIF return data, warehouse<br />
properties showed a 0.31% annual price change over the last three years. R&D on the other hand<br />
showed an annual decl<strong>in</strong>e of –3.35% for the last three years. This dichotomy is evident by the gap <strong>in</strong><br />
cap rates between the two property sub-types.<br />
(41)
Nomura <strong>Fixed</strong> <strong>Income</strong> Research<br />
Historical Cap Rates for the Industrial Sector<br />
Cap Rate (%)<br />
12.0<br />
11.5<br />
11.0<br />
10.5<br />
10.0<br />
9.5<br />
9.0<br />
8.5<br />
8.0<br />
7.5<br />
8.0<br />
7.5<br />
7.0<br />
6.5<br />
6.0<br />
5.5<br />
5.0<br />
4.5<br />
4.0<br />
3.5<br />
1995 Q1<br />
1996 Q1<br />
10-yr Treasury Yield (%)<br />
1997 Q1<br />
1998 Q1<br />
1999 Q1<br />
2000 Q1<br />
2001 Q1<br />
2002 Q1<br />
<strong>2003</strong> Q1<br />
Warehouse R&D 10-yr Treasury Yield<br />
Sources: RERC Real Estate Report, Nomura<br />
NCREIF Appreciation Returns for the Industrial Sector:<br />
Warehouse versus R&D<br />
Warehouse R&D Industrial (Total)<br />
3Q <strong>2003</strong> 0.33 (0.60) 0.20<br />
2Q <strong>2003</strong> (0.46) (3.33) (0.76)<br />
1-yr (0.06) (7.57) (0.88)<br />
3-yr 0.31 (3.35) (0.12)<br />
5-yr 1.21 (0.01) 1.15<br />
10-yr 1.56 2.22 1.72<br />
Source: NCREIF<br />
The R&D sector was decimated by the burst<strong>in</strong>g of the tech bubble and will likely rema<strong>in</strong> mired for a<br />
long time to come. To see how bad the market is consider the examples cited <strong>in</strong> the Korpacz Real<br />
Estate Investor Survey, 4 th quarter <strong>2003</strong>. They note that vacancy rates for flex/R&D <strong>in</strong> Dallas/Fort<br />
Worth, Denver, and Portland reached 12.2%, 17.3%, and 29.4%, respectively, <strong>in</strong> the third quarter of<br />
<strong>2003</strong>. 6 On the other hand, the warehouse/distribution centers, <strong>in</strong> our view, should beg<strong>in</strong> to feel the<br />
effects of the recover<strong>in</strong>g economy <strong>in</strong> the com<strong>in</strong>g year. Accord<strong>in</strong>g to REIS, <strong>2004</strong> should br<strong>in</strong>g a<br />
modest <strong>in</strong>crease <strong>in</strong> effective rents, and br<strong>in</strong>g some relief to vacancies.<br />
Another cut at the data reveals an additional performance aberration. The performance by region<br />
varied greatly. The western region and the eastern region showed a 1.02% and .76% average<br />
annual price appreciation, respectively, for the last three years, whereas the midwest and southern<br />
regions showed -0.99% and –2.52% returns, respectively. The coasts tend to benefit from the<br />
storage of goods com<strong>in</strong>g from overseas. The improv<strong>in</strong>g economy should eventually <strong>in</strong>crease<br />
consumer demand for goods.<br />
Some analysts cite the fact that the weaker dollar will lead to a drop <strong>in</strong> imports, which <strong>in</strong> turn, will hurt<br />
demand for warehouse/distribution space. While this true to some extent, it should be offset by two<br />
important factors. First a grow<strong>in</strong>g amount of our imports are from Ch<strong>in</strong>a, which thus far (s<strong>in</strong>ce 1994)<br />
6 The Korpacz Report used data from CoStar Realty Information<br />
(42)
Nomura <strong>Fixed</strong> <strong>Income</strong> Research<br />
has pegged its currency to the U.S. dollar. Secondly, warehouse facilities are used to some extent<br />
for exports as well, which would benefit from the weaker dollar.<br />
(5) Hotel<br />
The hotel market has a long way to go to recover. In <strong>2003</strong>, the gap between cap rates and Treasury<br />
rates reached the widest level <strong>in</strong> our data series.<br />
Historical Cap Rates for the Hotel Sector<br />
12.0<br />
8.0<br />
11.5<br />
7.5<br />
Cap Rate (%)<br />
11.0<br />
10.5<br />
10.0<br />
9.5<br />
9.0<br />
8.5<br />
7.0<br />
6.5<br />
6.0<br />
5.5<br />
5.0<br />
4.5<br />
10-yr Treasury Yield (%)<br />
8.0<br />
4.0<br />
7.5<br />
3.5<br />
1995 Q1<br />
1996 Q1<br />
1997 Q1<br />
1998 Q1<br />
1999 Q1<br />
2000 Q1<br />
2001 Q1<br />
2002 Q1<br />
<strong>2003</strong> Q1<br />
Hotel<br />
10yr Treasury Yield<br />
Sources: RERC Real Estate Report, Nomura<br />
We believe that the hotel sector will benefit greatly from the economic recovery <strong>in</strong> <strong>2004</strong>.<br />
Pricewaterhouse Coopers, <strong>in</strong> their September <strong>2003</strong> Hospitality Directions Forecast Alert predicts a<br />
4.9% <strong>in</strong>crease <strong>in</strong> RevPAR (revenue per available room) <strong>in</strong> <strong>2004</strong>. This is the largest percentage<br />
<strong>in</strong>crease <strong>in</strong> RevPAR s<strong>in</strong>ce 1997. While the <strong>in</strong>creases will be larger <strong>in</strong> the upscale segment, they are<br />
not sufficient to overcome the severe decl<strong>in</strong>es of the past several years. On the other hand,<br />
accord<strong>in</strong>g to Pricewaterhouse, the midscale segment will experience ga<strong>in</strong>s <strong>in</strong> RevPAR which will<br />
more than offset the 2% decl<strong>in</strong>e suffered <strong>in</strong> the 2000-<strong>2003</strong> time period. As is usual at this po<strong>in</strong>t <strong>in</strong> the<br />
cycle, RevPAR is be<strong>in</strong>g driven by <strong>in</strong>creases <strong>in</strong> occupancy rather <strong>in</strong>creases <strong>in</strong> Average Daily Room<br />
(ADR) rates.<br />
Occupancy rates most likely bottomed <strong>in</strong> the second quarter at about 58.1% and are very slowly<br />
creep<strong>in</strong>g back up. PwC forecast occupancy by the end of <strong>2003</strong> to rise to 60.1% and by the end of<br />
<strong>2004</strong> to hit 60.8%. The ma<strong>in</strong> reason for this very slow trend is that supply growth did not slow down<br />
as much as it should have dur<strong>in</strong>g this recession. Accord<strong>in</strong>g to Smith Travel Research, room supply<br />
<strong>in</strong>creased by 2.3% <strong>in</strong> 2001, 1.7% <strong>in</strong> 2002 and by 1.3% as of October <strong>2003</strong>.<br />
The quite dramatic drop <strong>in</strong> the value of the dollar versus European and Japanese currencies should<br />
benefit the travel hotel sector. In addition, travel associations are expect<strong>in</strong>g an <strong>in</strong>crease <strong>in</strong> domestic<br />
leisure travel. The Travel Industry of America is forecast<strong>in</strong>g a 4.4% <strong>in</strong>crease <strong>in</strong> domestic and<br />
<strong>in</strong>ternational visitor spend<strong>in</strong>g <strong>in</strong> <strong>2004</strong> and a 4.6% <strong>in</strong>crease <strong>in</strong> 2005.<br />
Bus<strong>in</strong>ess travel is a bigger factor than leisure travel when it comes to hotel profitability and demand.<br />
Unfortunately, bus<strong>in</strong>ess travel has rema<strong>in</strong>ed weak. Despite the slow recovery expected <strong>in</strong> the<br />
important bus<strong>in</strong>ess segment, the credit trend is improv<strong>in</strong>g. As noted <strong>in</strong> a recent report on the lodg<strong>in</strong>g<br />
(43)
Nomura <strong>Fixed</strong> <strong>Income</strong> Research<br />
sector by CreditSights 7 "debt coverage measures have stabilized for the major lodg<strong>in</strong>g companies."<br />
As a result, CreditSights raised their outlook for the sector from underweight to marketweight.<br />
With regard to hotel f<strong>in</strong>anc<strong>in</strong>g we believe there will be two dist<strong>in</strong>ct trends that will have implications for<br />
lender performance. First, the bad news: there are still many weak hotels with loans that were made<br />
<strong>in</strong> 1995 that will be look<strong>in</strong>g for f<strong>in</strong>anc<strong>in</strong>g <strong>in</strong> <strong>2004</strong> and 2005. Some of these will end up <strong>in</strong> special<br />
servic<strong>in</strong>g. The holders of the most junior classes from CMBS deals with these loans will cont<strong>in</strong>ue to<br />
suffer from the loans.<br />
On the other hand, given the slowly improv<strong>in</strong>g fundamentals and the very risk averse stance of<br />
CMBS b-buyers, new hotel loans <strong>in</strong> <strong>2004</strong> CMBS deals should perform very well.<br />
7 CreditSights, U.S. Morn<strong>in</strong>g Comment (17 Dec <strong>2003</strong>)<br />
(44)
Nomura <strong>Fixed</strong> <strong>Income</strong> Research<br />
VI.<br />
Asset-Backed Securities<br />
A. <strong>Outlook</strong> for the <strong>2004</strong><br />
1. Issuance<br />
Mark Adelson (212) 667-2337<br />
Beth Hoyt (212) 667-2339<br />
We expect ABS issuance to either rema<strong>in</strong> flat or to decl<strong>in</strong>e slightly <strong>in</strong> <strong>2004</strong>. The potential for higher<br />
<strong>in</strong>terest rates dampens the prospects for repeat<strong>in</strong>g this year's blockbuster level of activity <strong>in</strong> the home<br />
equity ABS sector. The credit card and auto sectors have the potential to grow, but probably not<br />
enough to offset contraction from HELs. Pressure on the automakers' corporate credit rat<strong>in</strong>gs could<br />
be an important driver of <strong>in</strong>creased auto ABS issuance <strong>in</strong> <strong>2004</strong>.<br />
The manufactured hous<strong>in</strong>g sector is positioned for a resurgence <strong>in</strong> <strong>2004</strong>. The union of Oakwood and<br />
Clayton Homes under the Berkshire Hathaway umbrella is the best news for the sector <strong>in</strong> more than a<br />
year. If the comb<strong>in</strong>ed Oakwood-Clayton entity becomes a somewhat active ABS issuer, it may<br />
re-establish the MH sector's credibility and spur other would-be issuers to enter the market.<br />
However, even if a renewed MH ABS sector emerges and achieves issuance levels on par with 2002<br />
or 2001, it will still not be a material amount relative to the whole ABS pie.<br />
Likewise, we feel that issuance activity <strong>in</strong> ABS backed by commercial assets is poised to rebound <strong>in</strong><br />
<strong>2004</strong>. Economic recovery reasonably should br<strong>in</strong>g with it greater demand for equipment.<br />
The follow<strong>in</strong>g table summarizes our projections for <strong>2004</strong> ABS issuance levels <strong>in</strong> the various major<br />
asset categories:<br />
Projected <strong>2004</strong> U.S. Public/144A ABS Issuance by Asset Class<br />
($ billions)<br />
Credit Cards 75<br />
Autos 90<br />
Home Equity 165<br />
Manufactured Hous<strong>in</strong>g 5<br />
Student Loans 40<br />
Other 30<br />
Total 405<br />
2. Credit Trends<br />
With the U.S. economy start<strong>in</strong>g to bounce back, we anticipate a generally positive credit trend <strong>in</strong><br />
<strong>2004</strong>. We expect the prime-quality, top-tier auto and credit card sectors to cont<strong>in</strong>ue their role as the<br />
anchor that has allowed the ABS market (as a whole) to ma<strong>in</strong>ta<strong>in</strong> a reputation for high credit quality.<br />
Deals from other sectors likely will display either improv<strong>in</strong>g credit quality or a slower pace of<br />
deterioration, <strong>in</strong> either case reflect<strong>in</strong>g improvement <strong>in</strong> the general economy. We expect that the pace<br />
of downgrades will slow down <strong>in</strong> virtually all ABS sectors.<br />
On the other hand, many situations <strong>in</strong>volv<strong>in</strong>g distressed ABS will persist through <strong>2004</strong> and will be a<br />
nagg<strong>in</strong>g rem<strong>in</strong>der of the problems of the past three years. Uncerta<strong>in</strong>ty will cont<strong>in</strong>ue to burden<br />
troubled deals from various sectors. Examples <strong>in</strong>clude credit card deals from NextCard and First<br />
Consumers, equipment leas<strong>in</strong>g deals from DVI, many outstand<strong>in</strong>g MH deals and the ill-fated National<br />
Century F<strong>in</strong>ancial Enterprises (NCFE) deals.<br />
3. Spreads<br />
For the first half of <strong>2004</strong>, we expect spreads on triple-A-rated ABS to revisit the tight levels that they<br />
achieved around mid-year <strong>2003</strong>. More specifically, we expect slight tighten<strong>in</strong>g for card and auto ABS<br />
and moderate tighten<strong>in</strong>g for HELs.<br />
(45)
Nomura <strong>Fixed</strong> <strong>Income</strong> Research<br />
We expect that <strong>2004</strong> will br<strong>in</strong>g a further modest spread tighten<strong>in</strong>g for subord<strong>in</strong>ate and mezzan<strong>in</strong>e<br />
ABS tranches. Improv<strong>in</strong>g consumer credit quality, driven by generally improv<strong>in</strong>g economic<br />
conditions, likely will be the primary factor. We expect the impact to be most pronounced <strong>in</strong> triple-B<br />
HELs, where the comb<strong>in</strong>ation of sub-prime borrowers and structural leverage amplify the effects of<br />
economic improvement (or deterioration). However, <strong>in</strong>vestors should not expect dramatic tighten<strong>in</strong>g;<br />
subord<strong>in</strong>ate and mezzan<strong>in</strong>e tranches already achieved a notable measure of tighten<strong>in</strong>g <strong>in</strong> the second<br />
half the <strong>2003</strong>.<br />
In addition, spreads on certa<strong>in</strong> off-the-run deals could experience substantial tighten<strong>in</strong>g. Many<br />
market participants used <strong>2003</strong> to th<strong>in</strong>k about the issues of company risk and fraud. Now, some<br />
market participants have rega<strong>in</strong>ed confidence that they can differentiate situations that are well<br />
protected from those that are not.<br />
Expected Tightest Spreads to Swaps on Selected<br />
<strong>Fixed</strong>-Rate, Triple-A-Rated ABS <strong>in</strong> <strong>2004</strong> (basis po<strong>in</strong>ts)<br />
Asset Class ↓ Average Life→ 2 3 5 10<br />
Credit Cards 2 3 8 24<br />
Prime Autos 5 3<br />
Home Equity/Sub-Prime Mortgage 35 38 62 114<br />
4. Recommendations<br />
For the first half of <strong>2004</strong> we recommend a somewhat aggressive posture. In broad terms, we<br />
recommend triple-A-rated 5-year fixed-rate home equity ABS because we feel that they have the best<br />
chance to ga<strong>in</strong> on spread tighten<strong>in</strong>g and because they offer better carry than prime-quality card and<br />
auto ABS.<br />
In addition, for <strong>in</strong>vestors with a more aggressive disposition, we recommend subord<strong>in</strong>ate and<br />
mezzan<strong>in</strong>e HELs from top-tier issuers. Those securities offer a good opportunity to benefit from the<br />
expected economic recovery. However, they have already experienced substantial spread<br />
tighten<strong>in</strong>g, and opportunities for further tighten<strong>in</strong>g may be limited. We do not recommend<br />
subord<strong>in</strong>ate and mezzan<strong>in</strong>e tranches from lower-tier HEL issuers because we rema<strong>in</strong> wary of<br />
headl<strong>in</strong>e risk and expect tier<strong>in</strong>g to rema<strong>in</strong> a permanent feature of the HEL landscape.<br />
We also recommend consider<strong>in</strong>g new issue manufactured hous<strong>in</strong>g ABS, if any appear on the scene<br />
<strong>in</strong> <strong>2004</strong>. We expect that new MH deals will be substantially stronger than those of recent v<strong>in</strong>tages.<br />
We rema<strong>in</strong> wary of outstand<strong>in</strong>g deals from the 1999 through 2002 v<strong>in</strong>tages.<br />
Improvement <strong>in</strong> the economy bodes well for off-the-run ABS sectors. Recent experience teaches that<br />
if an off-the-run deal gets <strong>in</strong>to trouble, it is much more likely to occur dur<strong>in</strong>g tough times than<br />
otherwise. Thus, for the off-the-run areas we favor short maturities. Investors at the front ends of<br />
exotic deals stand to earn attractive spreads while leav<strong>in</strong>g the great majority of risk with the holders of<br />
longer tranches. Tranches that mature <strong>in</strong> two or three years stand a reasonable chance of be<strong>in</strong>g<br />
retired before the next cyclical downturn.<br />
B. Review of the Second Half of <strong>2003</strong><br />
1. The Big Picture<br />
a) Issuance<br />
We expect that overall U.S. public and 144A ABS issuance will reach approximately $420 billion by<br />
the end of <strong>2003</strong>. We had revised our orig<strong>in</strong>al prediction of $365 million to $400 million <strong>in</strong> our midyear<br />
report. It seems that actual full-year issuance will slightly surpass our revised projections.<br />
As stated <strong>in</strong> our mid-year report, HEL ABS issuance has been substantially greater than we had<br />
orig<strong>in</strong>ally predicted for <strong>2003</strong>. We expect home equity issuance to surpass $200 billion by year-end.<br />
(46)
Nomura <strong>Fixed</strong> <strong>Income</strong> Research<br />
Auto issuance has been slower than 2002, and will most likely reach $85 billion. Credit card issuance<br />
has slowed somewhat from its faster pace at mid-year and will only reach $65 billion by the end of<br />
<strong>2003</strong>.<br />
The follow<strong>in</strong>g table shows our current estimates for how <strong>2003</strong> will wrap-up, together with our <strong>in</strong>itial<br />
and revised mid-year projections.<br />
<strong>2003</strong> U.S. Public/144A ABS Issuance by Asset Class<br />
($ billions)<br />
Asset Class<br />
Orig<strong>in</strong>al<br />
Projection<br />
(at end of 2002)<br />
Revised Projection<br />
(as of June <strong>2003</strong>)<br />
Estimated<br />
(as of December<br />
<strong>2003</strong>)<br />
Credit Cards 69 85 65<br />
Autos 90 80 89<br />
Home Equity 140 180 210<br />
Manufactured Hous<strong>in</strong>g 4
Nomura <strong>Fixed</strong> <strong>Income</strong> Research<br />
number of home equity securities were helped by upgrades. The rat<strong>in</strong>g agencies upgraded 131<br />
tranches from 56 deals.<br />
Credit card ABS experienced downgrades to 29 tranches from 11 deals. Most were concentrated <strong>in</strong><br />
the sub-prime Metris Master Trust. Twenty-four tranches from eight Metris deals suffered<br />
downgrades. Credit card ABS experienced upgrades to only seven tranches from three deals.<br />
c) Spreads<br />
The second half of the year brought spread widen<strong>in</strong>g <strong>in</strong> home equity and prime auto ABS. Most of<br />
the widen<strong>in</strong>g occurred <strong>in</strong> August and September. As we approach year-end, ABS spread movements<br />
year-to-date have displayed a slight tighten<strong>in</strong>g trend. In our mid-year report, we had predicted ABS<br />
spread widen<strong>in</strong>g for the second half of the year, but we expected that it would occur mostly <strong>in</strong> the<br />
fourth quarter rather than <strong>in</strong> the third.<br />
The follow<strong>in</strong>g table summarizes the spread movements relative to swaps for fixed-rate top-tier paper<br />
from the major asset classes at various average lives:<br />
<strong>Fixed</strong>-Rate ABS – Triple-A-Rated<br />
Change <strong>in</strong> Spread to Swaps (bp) <strong>in</strong> Third and Fourth Quarters of <strong>2003</strong><br />
Asset Class ↓ Average Life→ 2 3 5 10<br />
Credit Cards<br />
Q3 0 0 -2 -2<br />
Q4 0 0 -1 -1<br />
Prime Autos<br />
Q3 2 2<br />
Q4 -1 0<br />
Home Equity/Sub-Prime Mortgage<br />
Q3 14 16 27 10<br />
Q4 -6 -6 0 -3<br />
The next table summarizes representative spreads to swaps for fixed-rate top-tier paper from the<br />
major asset classes at various average lives, as we approach year-end.<br />
<strong>Fixed</strong>-Rate ABS – Triple-A-Rated<br />
Approximate Spreads over Swaps (bp) Approach<strong>in</strong>g <strong>Year</strong> End <strong>2004</strong><br />
Asset Class ↓ Average Life→ 2 3 5 10<br />
Credit Cards 4 5 8 24<br />
Prime Autos 7 7<br />
Home Equity/Sub-Prime Mortgage 47 50 88 120<br />
2. Developments<br />
a) Off-Balance Sheet Account<strong>in</strong>g<br />
As a whole, <strong>2003</strong> brought a flood of developments affect<strong>in</strong>g the off-balance sheet treatment of<br />
securitizations. The areas most directly threatened were asset-backed commercial paper (ABCP)<br />
and collateralized debt obligations (CDOs). For now, the threat to ABCP has largely subsided. It<br />
appears that many ABCP program sponsors will be able to restructure their programs to avoid<br />
consolidation, if they want to. CDOs seem to be fac<strong>in</strong>g greater uncerta<strong>in</strong>ty.<br />
Dur<strong>in</strong>g the second half of <strong>2003</strong>, key developments came from several different directions <strong>in</strong>clud<strong>in</strong>g (1)<br />
F<strong>in</strong>ancial Account<strong>in</strong>g Standards Board (FASB), (2), the Securities and Exchange Commission (SEC),<br />
and (3) U.S. bank regulators. FASB and its staff issued a number of <strong>in</strong>terpretations and proposals,<br />
<strong>in</strong>clud<strong>in</strong>g a significant proposed amendment to FIN 46. 8 The SEC released its congressionally<br />
mandated study "on the adoption by the United States f<strong>in</strong>ancial report<strong>in</strong>g system of a pr<strong>in</strong>ciples-<br />
8 F<strong>in</strong>ancial Account<strong>in</strong>g Standards Board, Exposure Draft, Proposed Interpretation Consolidation of Variable<br />
Interest Entities a Modification of FASB Interpretation No. 46 (31 Oct <strong>2003</strong>) (available at<br />
http://www.fasb.org/draft/ed_prop_<strong>in</strong>terp_vie.pdf).<br />
(48)
Nomura <strong>Fixed</strong> <strong>Income</strong> Research<br />
based account<strong>in</strong>g system." 9 The SEC's study urges a shift toward an account<strong>in</strong>g framework that is<br />
primarily pr<strong>in</strong>ciples-based, but which also <strong>in</strong>cludes rules to provide an appropriate amount of<br />
implementation guidance. The bank regulators published <strong>in</strong>terim rules and proposed permanent<br />
rules that prevent consolidation of ABCP programs on bank f<strong>in</strong>ancial statements for risk-based<br />
capital purposes. 10<br />
The whole subject of off-balance sheet treatment for securitizations is becom<strong>in</strong>g <strong>in</strong>creas<strong>in</strong>gly arcane<br />
and convoluted. For readers who want to delve more deeply <strong>in</strong>to the issues, we recently published a<br />
more expansive treatment of the subject <strong>in</strong> a report titled Off-Balance Sheet Update (November<br />
<strong>2003</strong>).<br />
b) Fraud<br />
Dur<strong>in</strong>g the second half of <strong>2003</strong>, the ABS market cont<strong>in</strong>ued to wrestle with the issue of fraud <strong>in</strong><br />
securitizations. The subject was a central theme at the ABS East conference <strong>in</strong> October. The<br />
(allegedly) fraud-ta<strong>in</strong>ted NCFE heath-care deals rema<strong>in</strong> unresolved and at the center of extensive<br />
litigation. 11 At this po<strong>in</strong>t, it seems likely that litigation will cont<strong>in</strong>ue through <strong>2004</strong> and possibly even<br />
beyond 2005.<br />
Unfortunately, NCFE was not the only rem<strong>in</strong>der of fraud risk dur<strong>in</strong>g the second half of <strong>2003</strong>. In early<br />
September, Spiegel released an "Independent Exam<strong>in</strong>er's Report" reveal<strong>in</strong>g that the company had<br />
made material misstatements and omissions <strong>in</strong> the sales of credit card ABS and that it had<br />
manipulated <strong>in</strong>terchange rates to improperly avoid breach<strong>in</strong>g excess spread triggers. 12 The<br />
deception committed by Spiegel is important because it serves as a rem<strong>in</strong>der that even a seem<strong>in</strong>gly<br />
reputable enterprise may commit fraud under conditions of f<strong>in</strong>ancial distress.<br />
Also, early December brought a rem<strong>in</strong>der of the ill-fated CFS transactions. On December 3, a Tulsa,<br />
Oklahoma jury found former CFS boss, Bill Bartmann, "not guilty" on 57 counts of fraud. It rema<strong>in</strong>s to<br />
be seen whether ABS <strong>in</strong>vestors will pursue Bartmann's personal assets <strong>in</strong> civil litigation. Before<br />
NCFE, the CFS charged-off credit card deals represented the worst beat<strong>in</strong>g that the ABS market had<br />
ever dished-out. On roughly $1.6 billion of securities, <strong>in</strong>vestors recovered only $70.7 million. 13<br />
Respond<strong>in</strong>g to heightened sensitivity to fraud risk, the American <strong>Securitization</strong> Forum (ASF)<br />
announced an <strong>in</strong>itiative to develop guidel<strong>in</strong>es and "best practices" for ABS issuers. That <strong>in</strong>itiative<br />
may prove to be a strong, positive development for the ABS market. In a similar ve<strong>in</strong>, a ris<strong>in</strong>g<br />
number of market participants are call<strong>in</strong>g for <strong>in</strong>creased third party oversight for deals with significant<br />
9 United States Securities and Exchange Commission, Study Pursuant to Section 108(d) of the Sarbanes-Oxley<br />
Act of 2002 on the Adoption by the United States F<strong>in</strong>ancial Report<strong>in</strong>g System of a Pr<strong>in</strong>ciples-Based Account<strong>in</strong>g<br />
System (25 Jul <strong>2003</strong>) (available at http://www.sec.gov/news/studies/pr<strong>in</strong>ciplesbasedstand.htm).<br />
10 Office of the Comptroller of the Currency [here<strong>in</strong>after "OCC"], Federal Reserve System, Federal Deposit<br />
Insurance Corporation [here<strong>in</strong>after "FDIC"], and Office of Thrift Supervision [here<strong>in</strong>after "OTS"], Risk-Based<br />
Capital Guidel<strong>in</strong>es; Capital Adequacy Guidel<strong>in</strong>es; Capital Ma<strong>in</strong>tenance: Interim Capital Treatment of Consolidated<br />
Asset-Backed Commercial Paper Program Assets, 68 Fed. Reg. 56530 (1 Oct <strong>2003</strong>); OCC, Federal Reserve<br />
System, FDIC, and OTS, Risk-Based Capital Guidel<strong>in</strong>es; Capital Adequacy Guidel<strong>in</strong>es; Capital Ma<strong>in</strong>tenance:<br />
Asset-Backed Commercial Paper Programs and Early Amortization Provisions, 68 Fed. Reg. 56568 (1 Oct <strong>2003</strong>).<br />
11 National Century F<strong>in</strong>ancial Enterprises (NCFE) filed for bankruptcy <strong>in</strong> November of 2002. Previously, the<br />
company had completed dozens of purported healthcare securitizations. The company and its pr<strong>in</strong>cipals have<br />
been accused of fraud <strong>in</strong> connection with those deals. Roughly $3.35 billion of outstand<strong>in</strong>g securities have<br />
defaulted, and estimates of ultimate losses to <strong>in</strong>vestors have run higher than 85%. The ma<strong>in</strong> component of the<br />
alleged fraud is that collateral for the deals either was <strong>in</strong>eligible or did not exist. The revolv<strong>in</strong>g nature of the<br />
collateral pools comb<strong>in</strong>ed with the absence of mean<strong>in</strong>gful third-party oversight arguably enabled NCFE to<br />
perpetrate that aspect of the fraud. A secondary aspect of the NCFE fraud <strong>in</strong>volves the company's diversion of<br />
reserve funds that formed a part of its deals' credit enhancement. Investors have alleged that the trustees for the<br />
NCFE deals should have prevented the company's diversion of the reserve fund balances. See City of Chandler<br />
et al. v. Bank One et al., No. CV<strong>2003</strong>-010173, (Ariz. Superior Ct. Maricopa County, filed 23 May <strong>2003</strong>)<br />
12 Spiegel, Inc., Form 8-K Current Report (12 Sep <strong>2003</strong>)<br />
13 For a more extensive discussion of the CFS transactions see ABS Credit Migrations, Nomura fixed <strong>in</strong>come<br />
research report at 20 (updated 5 March 2002).<br />
(49)
Nomura <strong>Fixed</strong> <strong>Income</strong> Research<br />
potential for fraud risk (e.g., revolv<strong>in</strong>g pools of specialty assets). The broader subject of "company<br />
risk" – of which fraud risk is just one of several dimensions – was a central theme at the ABS East<br />
conference <strong>in</strong> October. Several highly respected ABS professionals expressed the view that<br />
"bankruptcy remoteness" is illusory and that ABS should be considered a special case of "super<br />
secured" debt. Just a few years ago, many market participants would have thought such remarks<br />
virtually heretical.<br />
c) Credit Card ABS<br />
A variety of credit card ABS issuers made important corporate announcements <strong>in</strong> the second half of<br />
<strong>2003</strong>. In late July, Sears announced that it would sell its portfolio and operations to Citigroup. Sears<br />
credit card ABS tightened by 10 bp to 20 bp <strong>in</strong> response to the news. In early August, GE Capital<br />
announced its plans to securitize its private-label and retail credit card receivables. GE's Monogram<br />
Credit Card Bank of Georgia reportedly has more than 100 million accounts represent<strong>in</strong>g about $60<br />
billion <strong>in</strong> receivables. In late September, Metris completed a $590 million portfolio sale and replaced<br />
its $610 million 2001-1 series with a private conduit facility. Later, the company sold another $495<br />
million of its credit card portfolio and announced that it would delay fil<strong>in</strong>g its third quarter f<strong>in</strong>ancial<br />
reports. In late September, Target announced its plans to issue $3 billion <strong>in</strong> credit card ABS through<br />
its Target Credit Card Master Trust. In late October, Bank of America announced that it would merge<br />
with FleetBoston F<strong>in</strong>ancial. Accord<strong>in</strong>g to the merger parties, the comb<strong>in</strong>ed entity will be the fifth<br />
largest bank card issuer <strong>in</strong> the U.S., with $47 billion <strong>in</strong> managed outstand<strong>in</strong>gs and 35 million<br />
accounts.<br />
d) NERA Study – Notch<strong>in</strong>g<br />
The long awaited NERA study on structured f<strong>in</strong>ance rat<strong>in</strong>gs was released <strong>in</strong> early November. 14 We<br />
believe the study was disappo<strong>in</strong>t<strong>in</strong>gly <strong>in</strong>conclusive. We have not observed any subsequent change<br />
<strong>in</strong> rat<strong>in</strong>g agency notch<strong>in</strong>g practices, nor do we expect to observe any change. However, we feel that<br />
the NERA study has potentially important implications for regulators. The study's <strong>in</strong>ability to conclude<br />
that the rat<strong>in</strong>gs from different rat<strong>in</strong>g agencies perform similarly calls <strong>in</strong>to question the <strong>in</strong>creas<strong>in</strong>g<br />
regulatory use of rat<strong>in</strong>gs. The regulatory use of rat<strong>in</strong>gs presumes that correspond<strong>in</strong>g rat<strong>in</strong>gs from<br />
different rat<strong>in</strong>g agencies are equivalent. If that presumption cannot be analytically supported, entire<br />
regulatory regimes might be based more on wishful th<strong>in</strong>k<strong>in</strong>g than on fact.<br />
We reviewed the NERA study more extensively <strong>in</strong> a report titled NERA Study of Structured F<strong>in</strong>ance<br />
Market Rat<strong>in</strong>gs – Market Implications, dated November 6.<br />
14 Carron, A.S., Dhrymes, P.J., and Beloreshki, T.N., Credit Rat<strong>in</strong>gs for Structured Products – A Review of<br />
Analytical Methodologies, Credit Assessment Accuracy, and Issuer Selectivity among Credit Rat<strong>in</strong>g Agencies,<br />
National Economic Research Associates (6 Nov. <strong>2003</strong>).<br />
(50)
Nomura <strong>Fixed</strong> <strong>Income</strong> Research<br />
VII.<br />
Collateralized Debt Obligations<br />
A. <strong>Outlook</strong> for <strong>2004</strong><br />
David P. Jacob (212) 667-2255<br />
Michael van Bemmelen (212) 667-9504<br />
We expect corporate spreads <strong>in</strong> the U.S. to cont<strong>in</strong>ue to tighten modestly dur<strong>in</strong>g <strong>2004</strong>. The highgrade<br />
Dow Jones TRAC-X <strong>in</strong>dex of the 100 most actively traded corporate credits (<strong>in</strong> CDS form) may<br />
reach as low as 40 bp by mid <strong>2004</strong>. Any further drastic tighten<strong>in</strong>g would put the <strong>in</strong>dex at Japanese<br />
levels, where credit spreads are an average of 30 bp for the 50 most actively traded credits (<strong>in</strong> CDS<br />
markets) at year end <strong>2003</strong>.<br />
In the more dynamic U.S. economy, the spread market is reach<strong>in</strong>g the tightest level we expect to see<br />
dur<strong>in</strong>g the expansion. The dom<strong>in</strong>ance of credit upgrades over downgrades that we foresee for <strong>2004</strong><br />
will support very tight levels for the upgraded credits, and support tighten<strong>in</strong>g pressure on the<br />
corporate market as a whole.<br />
The CDO picture is not as rosy because <strong>in</strong> the past, the rat<strong>in</strong>g agencies only reluctantly downgraded<br />
deteriorat<strong>in</strong>g CDOs, and that was too little and too late. We believe that even if a large number of<br />
credits <strong>in</strong>cluded <strong>in</strong> CDOs were to be upgraded, it will not erase the negative overhang and result <strong>in</strong><br />
CDO tranches be<strong>in</strong>g upgraded dur<strong>in</strong>g <strong>2004</strong>. 15 The pace of downgrades for the sector, however, will<br />
cont<strong>in</strong>ue to slow dur<strong>in</strong>g the first half and the credit lows may f<strong>in</strong>ally be reached <strong>in</strong> mid <strong>2004</strong> for most<br />
CDO types.<br />
We see good value <strong>in</strong> the credit <strong>in</strong>dex products, which will benefit from the tighten<strong>in</strong>g, as well as from<br />
improved liquidity as this market matures. The TRAC-X <strong>in</strong>dexes <strong>in</strong> un-funded (derivative) form trade<br />
as tight as 3 bp bid-ask for both the high-yield and high-grade pools. For funded credit tranches,<br />
where dealers provide only a "one-way market", <strong>in</strong>dex spreads are currently wider, but the product<br />
has the potential to tighten as the product matures.<br />
B. Review of <strong>2003</strong><br />
1. New Credit Derivative Product<br />
a) Recent Developments<br />
An excit<strong>in</strong>g development for <strong>in</strong>vestors <strong>in</strong> Credit Products is the emergence of credit <strong>in</strong>dexes based on<br />
diversified pools of 50 to 125 <strong>in</strong>dividual Credit Default Swaps (CDS). Two compet<strong>in</strong>g products that<br />
have emerged dur<strong>in</strong>g <strong>2003</strong> are TRAC-X and iBoxx, each of which is promoted by approximately a<br />
dozen dealers. 16 The high-grade corporate iBoxx <strong>in</strong>dex of 125 credits began trad<strong>in</strong>g <strong>in</strong> the U.S. on<br />
October 20, followed <strong>in</strong> November by the iBoxx high-yield <strong>in</strong>dex.<br />
TRAC-X results from an April 1, <strong>2003</strong> merger of two dealers' fledg<strong>in</strong>g efforts. The sponsors rebalanced<br />
the TRAC-X <strong>in</strong>dexes every six months to <strong>in</strong>clude the 100 most actively traded CDS dur<strong>in</strong>g<br />
the previous six months <strong>in</strong> the newly calculated <strong>in</strong>dex. The weight of each CDS <strong>in</strong> the <strong>in</strong>dex is 1%.<br />
S<strong>in</strong>ce CDS trad<strong>in</strong>g data is not publicly available, the selection procedure for new <strong>in</strong>dex names was<br />
not transparent to market participants. Additionally, TRAC-X was perceived as be<strong>in</strong>g too dependent<br />
on its two sponsors, and it lacked third party overview.<br />
The TRAC-X sponsors <strong>in</strong>vited Dow Jones Indexes (DJI) to assume responsibility for the product,<br />
<strong>in</strong>clud<strong>in</strong>g future re-balanc<strong>in</strong>g of the <strong>in</strong>dex, effective November 24. As a result, the <strong>in</strong>dexes were<br />
renamed Dow Jones TRAC-X Indexes and currently benefit from third-party overview. By the first<br />
15 One CDO sector rema<strong>in</strong>s an exception: the residential mortgage backed CDOs have seen such high prepays<br />
and <strong>in</strong>creases <strong>in</strong> support levels that credit performance has been excellent <strong>in</strong>clud<strong>in</strong>g a number of upgrades.<br />
16 Nomura International Plc., an affiliate of NSI, makes a market <strong>in</strong> the TRAC-X <strong>in</strong>dex.<br />
(51)
Nomura <strong>Fixed</strong> <strong>Income</strong> Research<br />
quarter of <strong>2004</strong>, DJI will take over the actual calculation and distribution of <strong>in</strong>dex values. DJI is<br />
currently putt<strong>in</strong>g together regional Advisory Committees <strong>in</strong> the U.S., Europe and Asia composed of<br />
credit derivatives market makers who will provide <strong>in</strong>put for the <strong>in</strong>clusion of credits <strong>in</strong> the <strong>in</strong>dex at the<br />
semi-annual reset dates. At mid-December, 12 <strong>in</strong>dexes were part of this CDS <strong>in</strong>dex family17. DJI<br />
completed their first rebalanc<strong>in</strong>g under prelim<strong>in</strong>ary procedures on December 3, when 14 credits were<br />
replaced <strong>in</strong> the 100 name high-yield TRAC-X NA <strong>in</strong>dex.<br />
Between its launch on April 1, <strong>2003</strong> and DJI's <strong>in</strong>volvement <strong>in</strong> November, over $150 billion l<strong>in</strong>ked to<br />
the Dow Jones TRAC-X Indexes traded. Trad<strong>in</strong>g volume is not easily compared to new issue<br />
volume, which is the measure tracked for funded CDOs. It is <strong>in</strong>terest<strong>in</strong>g, though, to compare the<br />
<strong>in</strong>dex trade data to global issued volume dur<strong>in</strong>g <strong>2003</strong> for all CDO types, which we estimate at $95<br />
billion. Comb<strong>in</strong><strong>in</strong>g the two <strong>in</strong>dependent <strong>in</strong>dex efforts, as is expected to eventually occur, would<br />
further promote trad<strong>in</strong>g volumes and liquidity of the <strong>in</strong>dex product. In the current strong credit<br />
environment, liquidity <strong>in</strong> the high-yield <strong>in</strong>dex is phenomenal with two-way markets at 3 bp bid-ask<br />
spreads quoted. The real test for the product's value to Credit <strong>in</strong>vestors is dur<strong>in</strong>g periods of spread<br />
widen<strong>in</strong>g, when there is traditionally limited liquidity <strong>in</strong> the underly<strong>in</strong>g fixed-<strong>in</strong>come securities.<br />
b) Product Background<br />
The credit derivatives market is experienc<strong>in</strong>g explosive growth, as can be seen <strong>in</strong> the surveys by the<br />
British Bankers' Association (BBA). Notional amount stood at $180 billion <strong>in</strong> 1997, but had <strong>in</strong>creased<br />
10-fold by 2002. The latest survey of BBA members forecasts a global market of $4.8 trillion for<br />
<strong>2004</strong>, with half of this amount consist<strong>in</strong>g of CDS. Dur<strong>in</strong>g its early phase, transactions typically were<br />
<strong>in</strong>itiated by a commercial bank or others with long positions look<strong>in</strong>g for protection on exist<strong>in</strong>g<br />
exposures. Acceptance by bank regulators of CDS as an effective hedge for exist<strong>in</strong>g bank exposure<br />
gave the market a boost. Convergence <strong>in</strong> certa<strong>in</strong> documentation issues further helped standardize<br />
trades, which currently occur under <strong>2003</strong> ISDA agreements. On the other hand, <strong>in</strong>vestors <strong>in</strong> this<br />
market us<strong>in</strong>g CDS as an <strong>in</strong>strument to create long positions prefer the customized tranches of CDS<br />
pools. The structure is similar to a funded CDO with a manager hav<strong>in</strong>g wide discretion <strong>in</strong> select<strong>in</strong>g<br />
exposures, either before clos<strong>in</strong>g, or worse, after clos<strong>in</strong>g the transaction. S<strong>in</strong>ce each pool has<br />
different components and often is governed by unique documentation, liquidity rema<strong>in</strong>s limited. The<br />
lack of liquidity has led to additional loss <strong>in</strong> value after credit stress appeared. The new <strong>in</strong>dexes<br />
avoid the moral hazard risk because their composition is based on the most active traded CDS dur<strong>in</strong>g<br />
the six-month period before the <strong>in</strong>dex reset. Investors choose exposure to high-yield vs. high-grade<br />
and the geographic area they prefer.<br />
The <strong>in</strong>dexes trade both <strong>in</strong> unfunded (derivative) format as well as <strong>in</strong> funded format. The latter is often<br />
referred to as a Credit L<strong>in</strong>ked Note (CLN) because <strong>in</strong>vestors <strong>in</strong> the funded <strong>in</strong>dex purchase an actual<br />
security (note) and the repayment is l<strong>in</strong>ked to performance of the referenced <strong>in</strong>dex. Currently, there<br />
is limited standardization <strong>in</strong> the funded <strong>in</strong>dex. Clearly, <strong>in</strong> a funded and credit-tranched form the <strong>in</strong>dex<br />
is an attractive alternative to an actively managed CDO. A tranched <strong>in</strong>dex has the potential to<br />
outperform a comparable CDO class because of its lower fee and expense basis and much improved<br />
liquidity. Despite improvements <strong>in</strong> disclosure and underwriters' efforts to establish a secondary<br />
market, most tranches of CDOs still trade "by appo<strong>in</strong>tment only."<br />
Dealers <strong>in</strong> credit derivatives and related CDS <strong>in</strong>dexes are try<strong>in</strong>g to make their product more attractive<br />
to traditional buy-and-hold <strong>in</strong>vestors. One of the factors restra<strong>in</strong><strong>in</strong>g these <strong>in</strong>stitutional <strong>in</strong>vestors from<br />
enter<strong>in</strong>g CDS markets is the need for specialized back-office systems and procedures to confirm and<br />
track their CDS exposures. In response to this need, DTC has announced that it has about a dozen<br />
dealers signed up to use the DTC system to confirm CDS trades. The first trades were entered <strong>in</strong> the<br />
fourth quarter of <strong>2003</strong>. This may be a step <strong>in</strong> the direction of creat<strong>in</strong>g a liquid and transparent market<br />
<strong>in</strong> CDS, which over time may become more similar to the corporate bond market than an OTC<br />
derivative market.<br />
17 Most notable composites are: Dow Jones TRAC-X Europe, Dow Jones TRAC-X NA (North America), Dow<br />
Jones TRAC-X NA High Yield, Dow Jones TRAC-X Japan, and Dow Jones TRAC-X EM (Emerg<strong>in</strong>g Markets).<br />
(52)
Nomura <strong>Fixed</strong> <strong>Income</strong> Research<br />
Several factors are com<strong>in</strong>g together <strong>in</strong> establish<strong>in</strong>g the <strong>in</strong>dex product. Evolution of f<strong>in</strong>ancial<br />
technology is widely credited as the driv<strong>in</strong>g force beh<strong>in</strong>d this group of products. However, we believe<br />
recent <strong>in</strong>vestor skepticism regard<strong>in</strong>g managers' added value is an important driver beh<strong>in</strong>d the move<br />
to <strong>in</strong>dex trad<strong>in</strong>g and will cont<strong>in</strong>ue to force dealers to take this product to its logical next phase, as is<br />
expla<strong>in</strong>ed below.<br />
c) Next Steps<br />
DJI is tak<strong>in</strong>g the TRAC-X <strong>in</strong>dex product to several global exchanges to try and get list<strong>in</strong>gs for<br />
exchange-cleared trad<strong>in</strong>g and establish a platform for further <strong>in</strong>novation. The stated target is to roll<br />
out exchange-traded credit futures by the middle of next year. Accord<strong>in</strong>g to DJI, they have seen<br />
"tremendous <strong>in</strong>terest" <strong>in</strong> issu<strong>in</strong>g structured products, exchange-traded derivatives and Exchange<br />
Traded Futures based on the Dow Jones TRAC-X Indexes and expect to issue the first licenses<br />
soon. 18 Clearly, a widely accepted and listed contract with its own futures and options would be a<br />
watershed event for global credit markets. Despite the existence of bond <strong>in</strong>dexes, there are few<br />
effective futures contracts available to fixed-<strong>in</strong>come <strong>in</strong>vestors to take broad market positions. For<br />
<strong>in</strong>stance the lack of activity <strong>in</strong> trad<strong>in</strong>g futures on the Municipal Bond Index (MBI) prompted the Bond<br />
Market Association (BMA) to field a task force to <strong>in</strong>vestigate. Some of the task force conclusions<br />
perta<strong>in</strong><strong>in</strong>g to the MBI apply to the older CDS <strong>in</strong>dexes as well. 19 However, by reta<strong>in</strong><strong>in</strong>g DJI, TRAC-X<br />
has <strong>in</strong>corporated many of the BMA recommendations for improved <strong>in</strong>dex trad<strong>in</strong>g, and the current<br />
momentum leads us to expect TRAC-X to become a platform for develop<strong>in</strong>g a new generation of<br />
derivatives.<br />
Dur<strong>in</strong>g November <strong>2003</strong>, the TRAC-X sponsors replaced the EM <strong>in</strong>dex of CDS with the exist<strong>in</strong>g<br />
emerg<strong>in</strong>g markets bond <strong>in</strong>dex EMBI. The methodology of calculat<strong>in</strong>g the EMBI, or any other bond<br />
<strong>in</strong>dex for that matter, is fundamentally different from the CDS <strong>in</strong>dexes. Bond <strong>in</strong>dexes are widely<br />
accepted by <strong>in</strong>vestors as performance benchmarks when compil<strong>in</strong>g their portfolios. CDS <strong>in</strong>dexes are<br />
still at the early stages of build<strong>in</strong>g <strong>in</strong>vestor acceptance, but by their design of pool<strong>in</strong>g the 100 most<br />
actively traded CDS each at 1% of the <strong>in</strong>dex, they are more focused on CDS dealers. <strong>Fixed</strong> <strong>in</strong>come<br />
fund managers need weights for each credit, which are more reflective of the size of traded debt.<br />
The substitution of the EMBI for the TRAC-X EM may be the beg<strong>in</strong>n<strong>in</strong>g of a more <strong>in</strong>vestor-friendly<br />
CDS <strong>in</strong>dex.<br />
2. Credit Developments<br />
a) Upgrades Back <strong>in</strong> Vogue<br />
Dur<strong>in</strong>g <strong>2003</strong>, the credit cycle cont<strong>in</strong>ued its move off the 2002 through, as evidenced by defaults<br />
statistics, see Table.<br />
Default Rate of U.S. Corporate Bonds<br />
(as a percent of outstand<strong>in</strong>gs)<br />
2002 <strong>2003</strong><br />
High-Yield 7.44 5.68<br />
High-Grade 0.61 0.11<br />
Comb<strong>in</strong>ed 3.29 2.42<br />
Source: Standard & Poor's, <strong>2003</strong> <strong>Year</strong>-End U.S. Corporate<br />
Bond Review and Forecast, December 9, <strong>2003</strong><br />
18 The consortium beh<strong>in</strong>d iBoxx, which <strong>in</strong>cludes Deutsche Boerse, has also stated their <strong>in</strong>tention to <strong>in</strong>troduce<br />
exchange-traded futures on the credit <strong>in</strong>dex by mid <strong>2004</strong>.<br />
19 Bond Market Association Municipal Bond Futures Task Force, Creat<strong>in</strong>g a Viable Contract: Issues and<br />
Recommendations Relat<strong>in</strong>g to the Municipal Bond Futures Contract, (May 2000) (available at<br />
http://www.bondmarkets.com/Market/MuniBondFutTaskFrc500.pdf). The report listed the follow<strong>in</strong>g requirements<br />
for a successful futures contract on the bond <strong>in</strong>dex: more transparency, third-party oversight, an objective set of<br />
criteria for <strong>in</strong>clud<strong>in</strong>g a bond <strong>in</strong> the <strong>in</strong>dex, a live market <strong>in</strong> the underly<strong>in</strong>g <strong>in</strong>dex, disclosure of prices and dealer<br />
quotes, disclosure of credits eligible for future <strong>in</strong>clusion.<br />
(53)
Nomura <strong>Fixed</strong> <strong>Income</strong> Research<br />
Rat<strong>in</strong>g Agencies are catch<strong>in</strong>g up with the development and the downgrade-to-upgrade ratio for all<br />
corporate and structured debt has improved from 6:1 for 2002 to a ratio of 3:1 for the <strong>2003</strong> first half.<br />
The downgrade-to-upgrade ratio as calculated by Moody's for non-f<strong>in</strong>ancial corporations is rapidly<br />
mov<strong>in</strong>g back to parity. This ratio stood at 1:1 for the period 1993-1997 but had deteriorated by 2002<br />
to a read<strong>in</strong>g of 3:1 for count downgrades and 23:1 for dollar volume of affected debt, see Table.<br />
Downgrade-to-Upgrade Ratio<br />
Period By Dollar Volume By Number<br />
1993-1997 1:1 1:1<br />
2000 3:1 2:1<br />
2001 6:1 4:1<br />
2002 23:1 6:1<br />
Quarter 1, <strong>2003</strong> 9:1 3:1<br />
Quarter 2, <strong>2003</strong> 7:1 3:1<br />
Quarter 3, <strong>2003</strong> - 2.1:1<br />
Source: Moody's Investors Service, November 18, <strong>2003</strong><br />
As we predicted <strong>in</strong> the Nomura <strong>2003</strong> <strong>Outlook</strong>, the ratios downgrade-to-upgrade for ABS and CDOs<br />
have not turned as dramatically. High pre-pay speeds on Mortgage Backed Securities have<br />
improved the leverage ratios for CDOs backed by mortgage securities, which resulted <strong>in</strong> a number of<br />
upgrades. Downgrades however were still widespread <strong>in</strong> <strong>2003</strong>, albeit at a slow<strong>in</strong>g monthly rate.<br />
Moody's placed 60 CDO tranches on review for downgrade and four on review for upgrade dur<strong>in</strong>g the<br />
Third Quarter, br<strong>in</strong>g<strong>in</strong>g the total on watch to 155 for downgrade and eight for upgrade. This ratio<br />
leaves us still with negative overhang, which is no longer present <strong>in</strong> the corporate market.<br />
b) Managers Overpaid?<br />
Early dur<strong>in</strong>g <strong>2003</strong>, Moody's published a report, which was one of the few critical studies address<strong>in</strong>g<br />
CDO managers' performance. 20 After the <strong>in</strong>itial report on this comparison, Moody's started publish<strong>in</strong>g<br />
widely followed monthly performance <strong>in</strong>dexes for CDOs. Unfortunately the <strong>in</strong>dex for each year's<br />
CDO orig<strong>in</strong>ation (cohort) is based on the monitored CDOs. S<strong>in</strong>ce the <strong>in</strong>dex is effectively the average<br />
performance of the group, roughly half of the deals (and the managers) appear as under-perform<strong>in</strong>g<br />
and the other half as out-perform<strong>in</strong>g the "market." A more critical yardstick is the performance of the<br />
CDO cohort versus a broad market <strong>in</strong>dex, such as Moody's applied <strong>in</strong> the referenced report.<br />
Compar<strong>in</strong>g performance of CDOs to an <strong>in</strong>dex lead to the conclusion that CBO managers, as a group,<br />
had under-performed the broad high-yield market. The managers' weak performance was largely<br />
blamed on <strong>in</strong>dustry concentration (<strong>in</strong> Telecom) and to an aggressive <strong>in</strong>vestment philosophy. The<br />
term "aggressive" refers to managers' tendency to purchase the cheapest asset for a given rat<strong>in</strong>g,<br />
which <strong>in</strong> a deteriorat<strong>in</strong>g credit environment results <strong>in</strong> more severe portfolio deterioration. Moody's<br />
estimated that for some mezzan<strong>in</strong>e CDO classes the manager caused four additional notches of<br />
downgrades versus what would have happened to the rat<strong>in</strong>g if simple re<strong>in</strong>vestment rules had<br />
prevailed. These comparisons will not help conv<strong>in</strong>ce <strong>in</strong>vestors to stay active <strong>in</strong> the managed CDO<br />
sector. In addition to pay<strong>in</strong>g annual fees to the collateral manager, there is a cash transfer at the<br />
CDO clos<strong>in</strong>g from <strong>in</strong>vestors pay<strong>in</strong>g 1.5% to 2.5% <strong>in</strong> fees and expenses to underwriters, rat<strong>in</strong>g<br />
agencies and other service providers.<br />
3. Spread and Issuance<br />
The divergent movement <strong>in</strong> rat<strong>in</strong>gs between CDOs and underly<strong>in</strong>g collateral is one of the reasons<br />
that spreads on CDOs and collateral are mov<strong>in</strong>g out of synch. Spreads on new-issue CDOs had<br />
followed the collateral spreads down <strong>in</strong> an <strong>in</strong>itial tighten<strong>in</strong>g of both types of securities dur<strong>in</strong>g the first<br />
quarter of <strong>2003</strong>. The triple-A-rated class for synthetic CDOs at mid-December stands at a spread of<br />
95 bp, which is a bit wider than end of the first quarter <strong>2003</strong>, and only marg<strong>in</strong>ally better than the<br />
beg<strong>in</strong>n<strong>in</strong>g of the year. Mezzan<strong>in</strong>e classes with triple-B rat<strong>in</strong>gs reveal a similar pattern of com<strong>in</strong>g<br />
down from the year-end 2002 spread widen<strong>in</strong>g but have gone sideways throughout the rest of the<br />
20 Fu, Y. and Harris, G., U.S. High-Yield CBOs: Analyz<strong>in</strong>g the Performance of a Beleaguered CDO Category,<br />
Moody's special report (21 Jan <strong>2003</strong>).<br />
(54)
Nomura <strong>Fixed</strong> <strong>Income</strong> Research<br />
year. The effect for CDOs of collateral spreads contract<strong>in</strong>g and liability spreads hold<strong>in</strong>g steady is<br />
reduction <strong>in</strong> arbitrage profits.<br />
Spread of Synthetic AAA CDO vs. TRAC-X 2002 Index North America<br />
190<br />
160<br />
TRAC-X<br />
AAA CDO<br />
Basis Po<strong>in</strong>ts<br />
130<br />
100<br />
70<br />
40<br />
6/1/2002<br />
8/1/2002<br />
10/1/2002<br />
12/1/2002<br />
2/1/<strong>2003</strong><br />
4/1/<strong>2003</strong><br />
6/1/<strong>2003</strong><br />
8/1/<strong>2003</strong><br />
10/1/<strong>2003</strong><br />
12/1/<strong>2003</strong><br />
Not surpris<strong>in</strong>gly, the compression of arbitrage opportunities has squeezed issuance globally of<br />
<strong>in</strong>vestment-grade CDOs down by 30% to an estimated $17.5 billion for <strong>2003</strong> versus $25 billion <strong>in</strong><br />
2002. However, cont<strong>in</strong>ued growth <strong>in</strong> two CDO segments, high-yield loan backed (CLO) and<br />
structured product backed, offset part of the decl<strong>in</strong>e and Moody's forecast a drop of 15% <strong>in</strong> rated U.S.<br />
CDO volume for the year, see Chart. The CLO and structured products rema<strong>in</strong> fertile ground for the<br />
CDO structure, because of limited secondary markets <strong>in</strong> these products, especially for the triple-B<br />
and lower-rated securities, which make up the collateral for the CDOs. Furthermore, <strong>in</strong>vestors may<br />
lack the expertise to select the assets, thus an experienced fund manager with an aligned <strong>in</strong>terest<br />
could add value.<br />
(55)
Nomura <strong>Fixed</strong> <strong>Income</strong> Research<br />
U.S. Rated CDO Transactions and Volume (all collateral types)<br />
90<br />
80<br />
70<br />
60<br />
Volume (left scale)<br />
Number (right scale)<br />
180<br />
160<br />
140<br />
120<br />
$ Billion<br />
50<br />
40<br />
30<br />
20<br />
10<br />
100<br />
80<br />
60<br />
40<br />
20<br />
0<br />
0<br />
1995<br />
1996<br />
1997<br />
1998<br />
1999<br />
2000<br />
2001<br />
2002<br />
<strong>2003</strong>E<br />
Source: Moody's<br />
The <strong>in</strong>creas<strong>in</strong>g popularity of credit <strong>in</strong>dex trad<strong>in</strong>g for both high-yield and high-grade corporates may<br />
permanently reduce the volume of CDO issuance. The CDO vehicle is not very efficient for tak<strong>in</strong>g<br />
short or medium-term positions <strong>in</strong> a generic credit product. The explosive growth of CDOs dur<strong>in</strong>g<br />
1996-2002 can be traced to strong demand from two separate <strong>in</strong>vestor constituencies. Both these<br />
constituencies may be enticed to transact <strong>in</strong> the credit <strong>in</strong>dex market.<br />
Commercial Banks, which sponsor CP conduits and other structured vehicles have a strong demand<br />
for Triple-A and AA rated <strong>in</strong>vestments with modest claims on bank regulatory capital. CDOs provided<br />
both the rat<strong>in</strong>g and a pick-up <strong>in</strong> spread of 20-30 bp versus similar rated liquid ABS <strong>in</strong>vestments.<br />
Follow<strong>in</strong>g credit stress on CDOs and regulatory pressures, the commercial bank vehicles have<br />
become less active <strong>in</strong> funded markets. Most of the large <strong>in</strong>ternational banks do actively trade the<br />
credit <strong>in</strong>dexes. S<strong>in</strong>ce positions <strong>in</strong> the <strong>in</strong>dex are marked-to-market, these require limited amounts of<br />
regulatory capital.<br />
The second group of traditional CDO <strong>in</strong>vestors, the mezzan<strong>in</strong>e class buyers, consists mostly of fixedrate<br />
<strong>in</strong>vestors who had to reach for yield <strong>in</strong> the fall<strong>in</strong>g <strong>in</strong>terest rate environment s<strong>in</strong>ce the mid-1990s.<br />
This group of <strong>in</strong>vestors has seen the value of their CDO hold<strong>in</strong>gs severely reduced. Total return on a<br />
portfolio of mezzan<strong>in</strong>e tranches yield<strong>in</strong>g 200-240 bp over the comparable benchmark will be severely<br />
affected by the non-performance of relatively few positions. There are enough mezzan<strong>in</strong>e classes<br />
trad<strong>in</strong>g for pennies on the dollar <strong>in</strong> the high-yield, high-grade and CDS sectors to go around. This<br />
<strong>in</strong>vestor base has further been hurt by the lack of liquidity and very large bid-ask spreads, quoted<br />
even by the orig<strong>in</strong>al lead managers on the CDOs. Thus the mezzan<strong>in</strong>e CDO <strong>in</strong>vestor is also a fertile<br />
prospect for <strong>in</strong>dex <strong>in</strong>vest<strong>in</strong>g, but this <strong>in</strong>vestor base needs a more bond-like product. Implementation<br />
of the plans to turn the credit <strong>in</strong>dexes <strong>in</strong> full-fledged bond products will enhance its acceptance.<br />
— E N D —<br />
(56)
Nomura <strong>Fixed</strong> <strong>Income</strong> Research<br />
Recent Nomura <strong>Fixed</strong> <strong>Income</strong> Research<br />
<strong>Fixed</strong> <strong>Income</strong> General Topics<br />
• U.S. <strong>Fixed</strong> <strong>Income</strong> <strong>2003</strong> Mid-<strong>Year</strong> <strong>Outlook</strong>/Review (27 June <strong>2003</strong>)<br />
• Off-Balance Sheet Update (24 November <strong>2003</strong>)<br />
• NERA Study of Structured F<strong>in</strong>ance Rat<strong>in</strong>gs – Market Implications (6 November <strong>2003</strong>)<br />
• U.S. <strong>Fixed</strong> <strong>Income</strong> <strong>2003</strong> Mid-<strong>Year</strong> <strong>Outlook</strong>/Review (27 June <strong>2003</strong>)<br />
• Report from Arizona: Coverage of Selected Sessions of the February <strong>2003</strong><br />
<strong>Securitization</strong> Conferences (18 February <strong>2003</strong>)<br />
• Senate Report Attacks Structured F<strong>in</strong>ance (6 January <strong>2003</strong>)<br />
• <strong>Securitization</strong> Glossary (26 November 2002)<br />
MBS<br />
• Monthly Update on FHA/VA Reperform<strong>in</strong>g Mortgages: Historical Prepayment Speeds,<br />
Default Losses, and Total Returns (3 December <strong>2003</strong>)<br />
• Australian MBS Primer (9 September <strong>2003</strong>)<br />
• Agency Capped Callable LIBOR Floaters Offer Structur<strong>in</strong>g Flexibility to Create<br />
Investment Profiles That May Be Difficult to Create <strong>in</strong> New Issue CMO Floaters (2 July<br />
<strong>2003</strong>)<br />
• A Journey to the Alt-A Zone (3 June <strong>2003</strong>)<br />
• Oops… They Did It Aga<strong>in</strong> – Jumbo MBS Credit Enhancement Levels Keep Fall<strong>in</strong>g<br />
(2 April <strong>2003</strong>)<br />
• Monthly Update on FHA/VA Reperform<strong>in</strong>g Mortgages: Historical Prepayment Speeds,<br />
Default Losses, and Total Returns (4 March <strong>2003</strong>)<br />
• Terrorism Insurance Update (published <strong>in</strong> Nomura CMBS Weekly Report, 7 June 2002)<br />
CMBS<br />
• GNPL REMIC Factor Comparison (28 October <strong>2003</strong>)<br />
• GNMA Project Loan Prepayment Report (14 October <strong>2003</strong>)<br />
• CMBS Watchlist<strong>in</strong>gs, Downgrades, and Surveillance (2 October <strong>2003</strong>)<br />
• Temporal Aspects of CMBS Downgrades and Surveillance (1 July <strong>2003</strong>)<br />
• Some Investment Characteristics of GNMA Project Loan Securities (1 May <strong>2003</strong>)<br />
• CMBS Credit Migrations (4 December 2002)<br />
ABS<br />
• ABS Gold Coast Report: Coverage of Selected Sessions of ABS East <strong>2003</strong><br />
(20 October <strong>2003</strong>)<br />
• What a Co<strong>in</strong>cidence? – One Reason Why CDOs and ABS Backed by Aircraft,<br />
Franchise Loans, and 12b 1 Fees Performed Poorly <strong>in</strong> 2002 (19 May <strong>2003</strong>)<br />
• Healthcare ABS Primer (18 October 2002)<br />
• ABS Credit Migrations (9 Jan 2002, updated 5 March 2002)<br />
Corporates<br />
• U.S. Corporate Monthly - November (8 December <strong>2003</strong>)<br />
• Toys "R" Us, Inc. - (18 November <strong>2003</strong>)<br />
• U.S. Corporate Monthly - October (10 November <strong>2003</strong>)<br />
• Ford Motor Co./Credit Corp. (17 October <strong>2003</strong>)<br />
• U.S. Corporate Monthly – September (8 October <strong>2003</strong>)<br />
• Nomura Credit Quarterly – September <strong>2003</strong><br />
• U.S. Corporate Monthly – June (9 July <strong>2003</strong>)<br />
• U.S. Corporate Monthly – May (8 June <strong>2003</strong>)<br />
(57)
NEW YORK TOKYO LONDON<br />
Nomura Securities International Nomura Securities Company Nomura International PLC<br />
2 World F<strong>in</strong>ancial Center, Build<strong>in</strong>g B 2-2-2, Otemachi, Chiyoda-Ku Nomura House<br />
New York, NY 10281 Tokyo, Japan 100-8130 1 St Mart<strong>in</strong>'s-le-grand<br />
(212) 667-9300 81 3 3211 1811 London EC1A 4NP<br />
44 207 521 2000<br />
Nomura <strong>Fixed</strong> <strong>Income</strong> Research<br />
New York<br />
David P. Jacob (212) 667 2255 International Head of Research<br />
David Resler (212) 667 2415 Head of U.S. Economic Research<br />
Mark Adelson (212) 667 2337 <strong>Securitization</strong>/ABS Research<br />
Arthur Q. Frank (212) 667 1477 MBS Research<br />
Louis (Trey) Ott (212) 667 9521 Corporate Bond Research<br />
Parul Ja<strong>in</strong> (212) 667 2418 Deputy Chief Economist<br />
Elizabeth Hoyt (212) 667 2339 Analyst<br />
James Manzi (212) 667 2231 Analyst<br />
Edward Santevecchi<br />
Analyst<br />
Kumiko Kimura (212) 667 9088 Translator<br />
Michiko Whetten (212) 667 2338 Translator<br />
Tokyo<br />
Nobuyuki Tsutsumi 81 3 3211 1811 ABS Research<br />
London<br />
John Higg<strong>in</strong>s 44 207 521 2534 Head of Research - Europe<br />
Each of the research analysts referenced on page 1 hereof with regard to the section of this research report for which he or she is<br />
responsible certifies that all of the views expressed <strong>in</strong> this report accurately reflect his or her personal views about any and all of the subject<br />
securities or issuers discussed here<strong>in</strong>. In addition, each of the research analysts referenced on page 1 hereof hereby certifies that no part of<br />
his or her compensation was, is, or will be, directly or <strong>in</strong>directly related to the specific recommendations or views that he or she has<br />
expressed <strong>in</strong> this research report.<br />
© Copyright <strong>2003</strong> Nomura Securities International, Inc.<br />
This publication conta<strong>in</strong>s material that has been prepared by one or more of the follow<strong>in</strong>g Nomura entities: Nomura Securities Co., Ltd. ("NSC") and Nomura Research<br />
Institute, Ltd., Tokyo, Japan; Nomura International plc and Nomura Research Institute Europe, Limited, United K<strong>in</strong>gdom; Nomura Securities International, Inc. ("NSI") and<br />
Nomura Research Institute America, Inc., New York, NY; Nomura International (Hong Kong) Ltd., Hong Kong; Nomura S<strong>in</strong>gapore Ltd., S<strong>in</strong>gapore; Capital Nomura Securities<br />
Public Co., Ltd., Bangkok, Thailand; Nomura Australia Ltd., Australia; P.T. Nomura Indonesia, Indonesia; Nomura Advisory Services (Malaysia) Sdn. Bhd., Malaysia; Nomura<br />
Securities Co., Ltd., Taipei, Taiwan; or Nomura Securities Co., Ltd., or Seoul, Korea. This material is: (i) for your private <strong>in</strong>formation, and we are not solicit<strong>in</strong>g any action based<br />
upon it; (ii) not to be construed as an offer to sell or a solicitation of an offer to buy any security <strong>in</strong> any jurisdiction where such an offer or solicitation would be illegal; and (iii) is<br />
based upon <strong>in</strong>formation that we consider reliable, but we do not represent that it is accurate or complete, and it should not be relied upon as such. Op<strong>in</strong>ions expressed are<br />
current op<strong>in</strong>ions as of the date appear<strong>in</strong>g on this material only and the <strong>in</strong>formation, <strong>in</strong>clud<strong>in</strong>g the op<strong>in</strong>ions conta<strong>in</strong>ed here<strong>in</strong> are subject to change without notice. Affiliates<br />
and/or subsidiaries of Nomura Hold<strong>in</strong>gs, Inc. (collectively referred to as the "Nomura Group") may from time to time perform <strong>in</strong>vestment bank<strong>in</strong>g or other services (<strong>in</strong>clud<strong>in</strong>g<br />
act<strong>in</strong>g as advisor, manager or lender) for, or solicit <strong>in</strong>vestment bank<strong>in</strong>g or other bus<strong>in</strong>ess from, companies mentioned here<strong>in</strong>. The Nomura Group, its officers, directors and<br />
employees, <strong>in</strong>clud<strong>in</strong>g persons <strong>in</strong>volved <strong>in</strong> the preparation or issuance of this material may, from time to time, have long or short positions <strong>in</strong>, and buy or sell (or make a market<br />
<strong>in</strong>), the securities, or derivatives (<strong>in</strong>clud<strong>in</strong>g options) thereof, of companies mentioned here<strong>in</strong>, or related securities or derivatives. The Nomura Group may act as a market<br />
maker and is will<strong>in</strong>g to buy and sell certa<strong>in</strong> Japanese equities for its <strong>in</strong>stitutional clients. NSC and other non-US members of the Nomura Group, their officers, directors and<br />
employees may, to the extent it relates to non-US issuers and is permitted by applicable law, have acted upon or used this material, prior to or immediately follow<strong>in</strong>g its<br />
publication. Foreign currency-denom<strong>in</strong>ated securities are subject to fluctuations <strong>in</strong> exchange rates that could have an adverse effect on the value or price of, or <strong>in</strong>come<br />
derived from the <strong>in</strong>vestment. In addition, <strong>in</strong>vestors <strong>in</strong> securities such as ADRs, the values of which are <strong>in</strong>fluenced by foreign currencies, effectively assume currency risk. The<br />
securities described here<strong>in</strong> may not have been registered under the U.S. Securities Act of 1933, and, <strong>in</strong> such case, may not be offered or sold <strong>in</strong> the United States or to U.S.<br />
persons unless they have been registered under such Act, or except <strong>in</strong> compliance with an exemption from the registration requirements of such Act. Unless govern<strong>in</strong>g law<br />
permits otherwise, you must contact a Nomura entity <strong>in</strong> your home jurisdiction if you want to use our services <strong>in</strong> effect<strong>in</strong>g a transaction <strong>in</strong> the securities mentioned <strong>in</strong> this<br />
material. This publication has been approved for distribution <strong>in</strong> the United K<strong>in</strong>gdom by Nomura International plc, which is regulated by The F<strong>in</strong>ancial Services Authority<br />
("FSA") and is a member of the London Stock Exchange. It is <strong>in</strong>tended only for <strong>in</strong>vestors who are "market counterparties" or "<strong>in</strong>termediate customers" as def<strong>in</strong>ed by FSA, and<br />
may not, therefore, be redistributed to other classes of <strong>in</strong>vestors. This publication has also been approved for distribution <strong>in</strong> Hong Kong by Nomura International (Hong Kong)<br />
Ltd.. NSI accepts responsibility for the contents of this material when distributed <strong>in</strong> the United States. No part of this material may be (i) copied, photocopied, or duplicated <strong>in</strong><br />
any form, by any means, or (ii) redistributed without NSI's prior written consent. Further <strong>in</strong>formation on any of the securities mentioned here<strong>in</strong> may be obta<strong>in</strong>ed upon request. If<br />
this publication has been distributed by electronic transmission, such as e-mail, then such transmission cannot be guaranteed to be secure or error-free as <strong>in</strong>formation could<br />
be <strong>in</strong>tercepted, corrupted, lost, destroyed, arrive late or <strong>in</strong>complete, or conta<strong>in</strong> viruses. The sender therefore does not accept liability for any errors or omissions <strong>in</strong> the<br />
contents of this publication, which may arise as a result of electronic transmission. If verification is required, please request a hard-copy version.