Link to 3C Final Report - The Ohio State University
Link to 3C Final Report - The Ohio State University
Link to 3C Final Report - The Ohio State University

You also want an ePaper? Increase the reach of your titles
YUMPU automatically turns print PDFs into web optimized ePapers that Google loves.
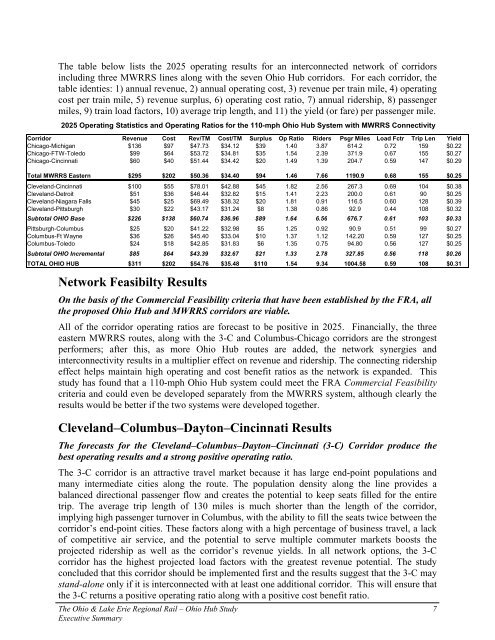
<strong>The</strong> table below lists the 2025 operating results for an interconnected network of corridors<br />
including three MWRRS lines along with the seven <strong>Ohio</strong> Hub corridors. For each corridor, the<br />
table identies: 1) annual revenue, 2) annual operating cost, 3) revenue per train mile, 4) operating<br />
cost per train mile, 5) revenue surplus, 6) operating cost ratio, 7) annual ridership, 8) passenger<br />
miles, 9) train load fac<strong>to</strong>rs, 10) average trip length, and 11) the yield (or fare) per passenger mile.<br />
2025 Operating Statistics and Operating Ratios for the 110-mph <strong>Ohio</strong> Hub System with MWRRS Connectivity<br />
Corridor Revenue Cost Rev/TM Cost/TM Surplus Op Ratio Riders Psgr Miles Load Fctr Trip Len Yield<br />
Chicago-Michigan $136 $97 $47.73 $34.12 $39 1.40 3.87 614.2 0.72 159 $0.22<br />
Chicago-FTW-Toledo $99 $64 $53.72 $34.81 $35 1.54 2.39 371.9 0.67 155 $0.27<br />
Chicago-Cincinnati $60 $40 $51.44 $34.42 $20 1.49 1.39 204.7 0.59 147 $0.29<br />
Total MWRRS Eastern $295 $202 $50.36 $34.40 $94 1.46 7.66 1190.9 0.68 155 $0.25<br />
Cleveland-Cincinnati $100 $55 $78.01 $42.88 $45 1.82 2.56 267.3 0.69 104 $0.38<br />
Cleveland-Detroit $51 $36 $46.44 $32.82 $15 1.41 2.23 200.0 0.61 90 $0.25<br />
Cleveland-Niagara Falls $45 $25 $69.49 $38.32 $20 1.81 0.91 116.5 0.60 128 $0.39<br />
Cleveland-Pittsburgh $30 $22 $43.17 $31.24 $8 1.38 0.86 92.9 0.44 108 $0.32<br />
Sub<strong>to</strong>tal OHIO Base $226 $138 $60.74 $36.96 $89 1.64 6.56 676.7 0.61 103 $0.33<br />
Pittsburgh-Columbus $25 $20 $41.22 $32.98 $5 1.25 0.92 90.9 0.51 99 $0.27<br />
Columbus-Ft Wayne $36 $26 $45.40 $33.04 $10 1.37 1.12 142.20 0.59 127 $0.25<br />
Columbus-Toledo $24 $18 $42.85 $31.83 $6 1.35 0.75 94.80 0.56 127 $0.25<br />
Sub<strong>to</strong>tal OHIO Incremental $85 $64 $43.39 $32.67 $21 1.33 2.78 327.85 0.56 118 $0.26<br />
TOTAL OHIO HUB $311 $202 $54.76 $35.48 $110 1.54 9.34 1004.58 0.59 108 $0.31<br />
Network Feasibilty Results<br />
On the basis of the Commercial Feasibility criteria that have been established by the FRA, all<br />
the proposed <strong>Ohio</strong> Hub and MWRRS corridors are viable.<br />
All of the corridor operating ratios are forecast <strong>to</strong> be positive in 2025. Financially, the three<br />
eastern MWRRS routes, along with the 3-C and Columbus-Chicago corridors are the strongest<br />
performers; after this, as more <strong>Ohio</strong> Hub routes are added, the network synergies and<br />
interconnectivity results in a multiplier effect on revenue and ridership. <strong>The</strong> connecting ridership<br />
effect helps maintain high operating and cost benefit ratios as the network is expanded. This<br />
study has found that a 110-mph <strong>Ohio</strong> Hub system could meet the FRA Commercial Feasibility<br />
criteria and could even be developed separately from the MWRRS system, although clearly the<br />
results would be better if the two systems were developed <strong>to</strong>gether.<br />
Cleveland–Columbus–Day<strong>to</strong>n–Cincinnati Results<br />
<strong>The</strong> forecasts for the Cleveland–Columbus–Day<strong>to</strong>n–Cincinnati (3-C) Corridor produce the<br />
best operating results and a strong positive operating ratio.<br />
<strong>The</strong> 3-C corridor is an attractive travel market because it has large end-point populations and<br />
many intermediate cities along the route. <strong>The</strong> population density along the line provides a<br />
balanced directional passenger flow and creates the potential <strong>to</strong> keep seats filled for the entire<br />
trip. <strong>The</strong> average trip length of 130 miles is much shorter than the length of the corridor,<br />
implying high passenger turnover in Columbus, with the ability <strong>to</strong> fill the seats twice between the<br />
corridor’s end-point cities. <strong>The</strong>se fac<strong>to</strong>rs along with a high percentage of business travel, a lack<br />
of competitive air service, and the potential <strong>to</strong> serve multiple commuter markets boosts the<br />
projected ridership as well as the corridor’s revenue yields. In all network options, the 3-C<br />
corridor has the highest projected load fac<strong>to</strong>rs with the greatest revenue potential. <strong>The</strong> study<br />
concluded that this corridor should be implemented first and the results suggest that the 3-C may<br />
stand-alone only if it is interconnected with at least one additional corridor. This will ensure that<br />
the 3-C returns a positive operating ratio along with a positive cost benefit ratio.<br />
<strong>The</strong> <strong>Ohio</strong> & Lake Erie Regional Rail – <strong>Ohio</strong> Hub Study 7<br />
Executive Summary