Physics 241 Lab â RLC Radios
Physics 241 Lab â RLC Radios
Physics 241 Lab â RLC Radios

Create successful ePaper yourself
Turn your PDF publications into a flip-book with our unique Google optimized e-Paper software.
<strong>Physics</strong> <strong>241</strong> <strong>Lab</strong> – <strong>RLC</strong> <strong>Radios</strong><br />
http://bohr.physics.arizona.edu/~leone/ua/ua_spring_2010/phys<strong>241</strong>lab.html<br />
Name:____________________________<br />
Section 1:<br />
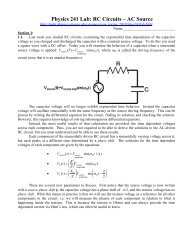
1. Begin today by reviewing the experimental procedure for finding C, L and resonance . This may<br />
help you to do well on your lab practical. (Be sure to sign up for your lab practical time slot today.)<br />
1.1. Reminder of how to measure an unknown capacitance C with an RC circuit:<br />
The component voltage amplitudes of an RC circuit driven sinusoidally with angular frequency<br />
drive are given by<br />
V C,amplitude<br />
C<br />
Z V source,amplitude and V R,amplitude R Z V source,amplitude .<br />
These component voltage amplitudes are equal when C<br />
R. Substituting R C<br />
<br />
1<br />
drive<br />
C and<br />
solving for C gives<br />
1<br />
C <br />
.<br />
R 2 f drive<br />
Remember this is only true when the voltage amplitude across the resistor is equal to the voltage<br />
amplitude across the capacitor. Therefore, to find an unknown capacitance C, measure R and find the<br />
driving frequency where V C,amplitude<br />
V R,amplitude<br />
. (No question.)<br />
1.2. Reminder of how to measure an unknown inductance L with an RL circuit:<br />
In an RL circuit driven sinusoidally with angular frequency drive ,<br />
V L,amplitude<br />
L<br />
Z V and V R source,amplitude R,amplitude<br />
Z V .<br />
source,amplitude<br />
These component voltage amplitudes are equal when L<br />
R. Substituting R L<br />
drive<br />
L and<br />
solving for L gives<br />
R<br />
L .<br />
2 f drive<br />
Remember this is only true when the voltage amplitude across the resistor is equal to the voltage<br />
amplitude across the inductor. Therefore, to find an unknown inductance L, measure R and find the<br />
driving frequency where V L,amplitude<br />
V R,amplitude<br />
. (No question.)<br />
1.3. Reminder of how to measure the resonant frequency resonance of an <strong>RLC</strong> circuit:<br />
In a sinusoidally driven <strong>RLC</strong> circuit, there is a driving frequency at which the current in the<br />
resistor is maximized (i.e. absorbing the most power from the oscillating source). This happens when<br />
the total circuit impedance Z R 2 L<br />
C 2 is minimized. This occurs when L<br />
C 2 0.<br />
The driving frequency at which L<br />
C<br />
0 occurs is called the resonant frequency. This can<br />
1<br />
be found by setting C equal to L so that<br />
drive<br />
C L. Solving gives 1<br />
drive drive<br />
<br />
resonance L C . (No<br />
question.)
1.4. A plot of current vs. driving frequency in an <strong>RLC</strong> circuit has a maximum at the resonant<br />
frequency. This is useful because an <strong>RLC</strong> circuit can be tuned to a specific resonant frequency by<br />
adjusting its C or L. If you lower the resistance of an <strong>RLC</strong> circuit and retake your measurements, the<br />
resonant frequency won’t change (since L and C don’t change), but you will measure a higher quality<br />
factor:<br />
The smaller the resistance, the sharper this peak gets. This is useful because an <strong>RLC</strong> circuit<br />
with low resistance only “reacts to” frequencies very near resonance while ignoring other driving<br />
frequencies. A radio can be made using a low-resistance <strong>RLC</strong> circuit that responds only to a specific<br />
radio frequency electromagnetic wave. How could you make the peak as sharp as possible in an <strong>RLC</strong><br />
circuit for use in a radio? Take the resistor out so that only the tiny resistance of metal wires is present.<br />
(No question.)<br />
1.5. Reminder of how to observe f resonance using an oscilloscope:<br />
The most accurate way to find f resonance is to utilize the fact that at resonance, V R (t) and V source (t)<br />
are exactly in phase with each other with equal amplitudes. You should place each of these voltages<br />
on your oscilloscope channels and examine an XY formatted display. The resonance frequency is<br />
easily found because you will see an ellipse when V R (t) and V source (t) are out of phase and a diagonal<br />
line when they are in phase. You see a straight line when they are in phase because both voltages must<br />
reach zero simultaneously.<br />
(No question.)<br />
Section 2: Modulating High Frequency Waves<br />
with Low Frequency Waves<br />
2.1. Imagine that you want to transmit the following<br />
sound wave from one solenoid (the transmitter) to<br />
another solenoid (the receiver). The two solenoids are<br />
not connected in any way so that the oscillating<br />
magnetic field inside one solenoid must be made to<br />
oscillate within the other solenoid to utilize Faraday’s<br />
Law.
Unfortunately, this wave is alternating much too slowly to induce a large voltage in the<br />
receiving solenoid. Remember the equation for mutual inductance, V induced<br />
dI circuit 1<br />
M 1 to 2<br />
, where<br />
in circuit 2 dt<br />
M is a constant that describes how much the solenoids overlap. If the current doesn’t oscillate rapidly<br />
enough, then V induced<br />
in circuit 2<br />
is very small.<br />
“Gee, I wish this wave oscillated more quickly to cause a bigger induced voltage in the<br />
receiving solenoid,” you might say. But then it wouldn’t be the same sound pitch that you wanted to<br />
hear in the first place! Still, it sounds like something you would say. (No question.)<br />
2.2. Next examine a wave that oscillates quickly, radio or slightly sub-radio frequency for example.<br />
This isn’t the frequency you want to hear (you are not able to!), but it does oscillate so quickly<br />
as to create a large induced voltage in the receiving solenoid. I.e., it oscillates quickly enough to be<br />
transmitted into the receiving circuit through the mutual inductance of the “transformer” (overlapping<br />
solenoids).<br />
2.3. The solution is to combine the two waves by multiplying them together. This modulated wave<br />
has the properties of both waves: it carries information about the audio frequency component and it<br />
oscillates quickly enough to generate a highly induced voltage in the receiver circuit.
The modulating wave (or envelope wave) is the low frequency oscillation while the high<br />
frequency oscillation is often called the carrier wave.<br />
2.4. Why are we interested in using a low frequency envelope wave in today’s lab?<br />
Your answer:<br />
2.5. Why do we need to use a rapidly oscillating carrier wave in today’s lab?<br />
Your answer:<br />
2.6. In today’s lab, we would like to transmit a modulated sound wave transmitted by one solenoid<br />
into another “receiving” solenoid. We will use a capacitor in the second “receiving” circuit to make an<br />
<strong>RLC</strong> “receiving” circuit. By changing the capacitor of the “receiving” circuit, we can adjust its<br />
resonant frequency. Therefore, we will be able to “tune” our “receiver” to a particular radio frequency.<br />
Now you would like to listen to your transmitted wave. But there is a huge problem.<br />
Whenever the wave is positive, it causes an upward force on the speaker, and whenever it is negative it<br />
causes a downward force on the speaker. The modulated wave is oscillating up and down with the<br />
rapid radio frequency, much too fast for the speaker to respond to. It just sits there quivering.<br />
The trick is to add a diode to the output. Remember that a diode is a quantum mechanical<br />
component that only allows current to flow in one direction once a turn-on voltage has been reached<br />
(determined by the semiconductor band gap energy). This will allow only positive voltage to reach the<br />
speaker.<br />
The speaker now gets pushed out a maximum distance at the maximum amplitude of the pulse and<br />
relaxes at the minimum.<br />
2.7. Would you be able to hear the speaker if the direction of the diode in the circuit was reversed?<br />
Explain your answer? Your answer and explanation:
Section 3: Now you will experimentally use a sound wave to modulate a radio frequency wave.<br />
Never insert the speaker directly into your ear without first verifying that the sound level is safe.<br />
The basic set-up provided consists of two solenoids wound together (to be perfectly<br />
overlapping) and a diode-speaker connector:<br />
Clean your ear-speaker with alcohol. Set your function generator to 3,600 Hz. Connect your<br />
function generator to the speaker/diode connection of your double-solenoid board as shown below<br />
(PVC pipe with wound red wire, only looks like one solenoid but is really two wound together).<br />
3.1. Slowly increase the output voltage until you can hear the signal. Ask for help if you have any<br />
doubts about the proper operation of these devices. Find the upper end of the frequency range of<br />
your hearing. It may be significantly less than your classmates if you are older or have suffered<br />
hearing loss due to loud noises. Also note any intermediate ranges of hearing loss. Do these<br />
frequencies correspond to the kinds of music you listen to (too loudly)? Record your measured<br />
range(s) of hearing:<br />
f max,sound = ___________________Hz<br />
3.2. What frequency makes the speaker diaphragm vibrations resonate, i.e. what is the resonant<br />
frequency that makes the speaker the loudest? There may be more than one resonant frequency for<br />
your speaker since it is a complex mechanical system.<br />
Your observed speaker resonant frequency(s):<br />
f resonance,speaker = ___________________Hz
3.3. Now input an audio-frequency signal of 1,000 Hz from your function generator into your RF<br />
modulator. Use a carrier radio-frequency wave of 500,000 Hz to create a modulated output wave of<br />
1,000 Hz envelope waves surrounding a 500 kHz high frequency wave. What are the periods for these<br />
two kinds of oscillations in the output modulated wave? Your answer:<br />
T audio = ________________ s<br />
T RF = ________________ s<br />
Examine the output of this signal on your oscilloscope at two time ranges so that you can see<br />
the audio-frequency signal and the radio-frequency signal separately. To do this, choose a seconds per<br />
division setting for the time axis that is appropriate for the time scale of the wave you wish to examine<br />
(i.e., use the wave’s period). You may need to press the “run-stop” button to view the wave packets if<br />
they appear smeared out on the oscilloscope.<br />
Sketch the appearance of the modulated wave at the audio frequency scale and then the radio<br />
frequency scale, and record the time scales used to observe the waves. Notice that the RF generator<br />
does not necessarily produce a clean RF output as was discussed earlier in this handout. Be sure you<br />
can hear the envelope waves of the modulated signal.<br />
Make sketches of the modulated wave and record the time-scale used:<br />
Radio Frequency<br />
Audio Frequency
Section 4: Now you will use a sound wave to modulate a radio frequency wave, then use mutual<br />
inductance to transmit the radio frequency wave to a separate <strong>RLC</strong> circuit, and finally listen to the<br />
sound wave.<br />
4.1. First determine the inductances L A and L B of your solenoids using the methods described in<br />
part 1. In other words, for each solenoid create an RL circuit driven sinusoidally and monitor the<br />
voltage across the resistor and inductor as you vary the driving frequency. Use the appropriate<br />
equation to solve for the inductance L. Even with the 10 resistor, you will need to use large driving<br />
frequencies as these inductances are very small.<br />
Your measured inductances:<br />
4.2. Input the audio signal at f resonance,speaker from your function generator into your RF modulator<br />
initially set to f RF = 550,000 Hz. Use the following sketch to set up your circuit. We will refer to the<br />
solenoid connected to the RF modulator the “transmitter” and the solenoid connected to the speaker the<br />
“receiver”. The variable capacitor component represents the capacitance you choose to use.<br />
4.3. Calculate the resonant frequency f resonance for your receiver solenoid in series with a 0.001 F<br />
capacitor. Your calculated resonant frequency:<br />
4.4. With your capacitor box set to 0.001 F, use your oscilloscope to measure the voltage signal<br />
being received across the speaker. Adjust f RF until your transmitted signal is in resonance with the<br />
receiving circuit and record this f RF, resonance . You will see this as maximizing the signal sent to the<br />
speaker. Some students can perform this part of the experiment searching for RF resonance by hearing<br />
when the transmitted signal is the loudest. This occurs when L,receiver = C,receiver in your receiving<br />
circuit. Compare this to your result in 4.3. Your measured resonant frequency and comparison:
Section 5: Write directly onto the figure below to completely explain how this compound circuit(s)<br />
works. You can use labels, text and arrows, and you do not need to write in complete sentences. Note<br />
that the speaker is shown wired in parallel to the receiving <strong>RLC</strong> circuit rather than in series, but you do<br />
not need to explain this particular feature. You will need to use equations described earlier in this lab<br />
for full credit.
Section 6: Now you will replace the function generator used in part 4 of this lab with an antenna<br />
attached to the outside of the building to detect radio frequency electromagnetic waves permeating the<br />
surrounding atmosphere. Room noise must be kept to a minimum for success here.<br />
6.1. Implement the following sketch.<br />
6.2. Using the receiver inductance L receiver measured in part 4.1 and the three smallest capacitances<br />
available to you, calculate the three resonant frequencies f resonant that you could detect with your<br />
receiving <strong>RLC</strong> circuit using the smallest capacitors. Your calculated detectable radio wave<br />
frequencies:<br />
6.3. Change your receiver capacitance using single capacitors and series capacitors to detect AM<br />
radio stations. The AM radio band is from 520 kHz to 1.61 MHz. Rely on the oscilloscope rather than<br />
the ear-speaker to detect induced voltages in the receiving <strong>RLC</strong> circuit since it is unlikely you will be<br />
able to hear the radio station. (Some students manage to barely hear the station in a very quiet room).<br />
Record the frequency of any broadcast stations you find. Your detected radio station frequencies:<br />
Report Guidelines: Write a separate section using the labels and instructions provided below. You<br />
may add diagrams and equations by hand to your final printout. However, images, text or equations<br />
plagiarized from the internet are not allowed!<br />
Title – A catchy title worth zero points so make it fun.<br />
Goals – Write a 3-4 sentence paragraph stating the experimental goals of the lab (the big<br />
picture). Do NOT state the learning goals (keep it scientific). [~1-point]<br />
Concepts & Equations – [~12-points].<br />
<br />
<br />
<br />
<br />
Procedure & Results – Do not write this section. [~0-points]<br />
Conclusion – Write at least three paragraphs where you analyze and interpret the results you<br />
observed or measured based upon your previous discussion of concepts and equations. It is all<br />
right to sound repetitive since it is important to get your scientific points across to your reader.<br />
Write a separate paragraph analyzing and interpreting your results from your open-ended<br />
experiment. Do NOT write personal statements or feeling about the learning process (keep it<br />
scientific). [~7-points]<br />
Graphs – None. [0-points]<br />
Worksheet – thoroughly completed in class and signed by your TA. [~5-points]