FTIR Spectroscopy: Attenuated Total Reflectance (ATR)
FTIR Spectroscopy: Attenuated Total Reflectance (ATR)
FTIR Spectroscopy: Attenuated Total Reflectance (ATR)

You also want an ePaper? Increase the reach of your titles
YUMPU automatically turns print PDFs into web optimized ePapers that Google loves.
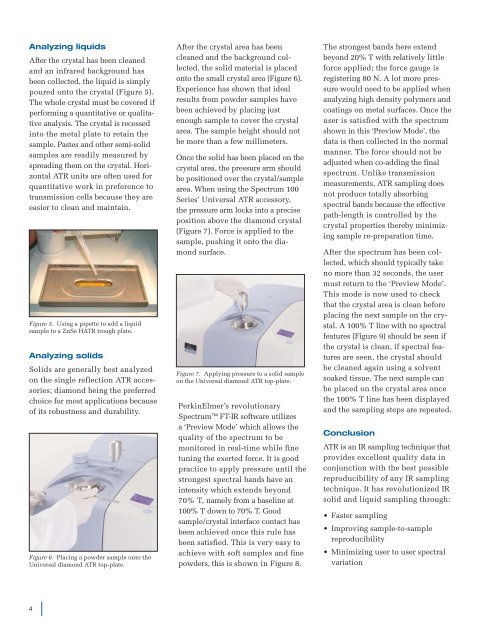
Analyzing liquids<br />
After the crystal has been cleaned<br />
and an infrared background has<br />
been collected, the liquid is simply<br />
poured onto the crystal (Figure 5).<br />
The whole crystal must be covered if<br />
performing a quantitative or qualitative<br />
analysis. The crystal is recessed<br />
into the metal plate to retain the<br />
sample. Pastes and other semi-solid<br />
samples are readily measured by<br />
spreading them on the crystal. Horizontal<br />
<strong>ATR</strong> units are often used for<br />
quantitative work in preference to<br />
transmission cells because they are<br />
easier to clean and maintain.<br />
Figure 5. Using a pipette to add a liquid<br />
sample to a ZnSe H<strong>ATR</strong> trough plate.<br />
Analyzing solids<br />
Solids are generally best analyzed<br />
on the single reflection <strong>ATR</strong> accessories;<br />
diamond being the preferred<br />
choice for most applications because<br />
of its robustness and durability.<br />
Figure 6. Placing a powder sample onto the<br />
Universal diamond <strong>ATR</strong> top-plate.<br />
4<br />
After the crystal area has been<br />
cleaned and the background collected,<br />
the solid material is placed<br />
onto the small crystal area (Figure 6).<br />
Experience has shown that ideal<br />
results from powder samples have<br />
been achieved by placing just<br />
enough sample to cover the crystal<br />
area. The sample height should not<br />
be more than a few millimeters.<br />
Once the solid has been placed on the<br />
crystal area, the pressure arm should<br />
be positioned over the crystal/sample<br />
area. When using the Spectrum 100<br />
Series’ Universal <strong>ATR</strong> accessory,<br />
the pressure arm locks into a precise<br />
position above the diamond crystal<br />
(Figure 7). Force is applied to the<br />
sample, pushing it onto the diamond<br />
surface.<br />
Figure 7. Applying pressure to a solid sample<br />
on the Universal diamond <strong>ATR</strong> top-plate.<br />
PerkinElmer’s revolutionary<br />
Spectrum FT-IR software utilizes<br />
a ‘Preview Mode’ which allows the<br />
quality of the spectrum to be<br />
monitored in real-time while fine<br />
tuning the exerted force. It is good<br />
practice to apply pressure until the<br />
strongest spectral bands have an<br />
intensity which extends beyond<br />
70% T, namely from a baseline at<br />
100% T down to 70% T. Good<br />
sample/crystal interface contact has<br />
been achieved once this rule has<br />
been satisfied. This is very easy to<br />
achieve with soft samples and fine<br />
powders, this is shown in Figure 8.<br />
The strongest bands here extend<br />
beyond 20% T with relatively little<br />
force applied; the force gauge is<br />
registering 80 N. A lot more pressure<br />
would need to be applied when<br />
analyzing high density polymers and<br />
coatings on metal surfaces. Once the<br />
user is satisfied with the spectrum<br />
shown in this ‘Preview Mode’, the<br />
data is then collected in the normal<br />
manner. The force should not be<br />
adjusted when co-adding the final<br />
spectrum. Unlike transmission<br />
measurements, <strong>ATR</strong> sampling does<br />
not produce totally absorbing<br />
spectral bands because the effective<br />
path-length is controlled by the<br />
crystal properties thereby minimizing<br />
sample re-preparation time.<br />
After the spectrum has been collected,<br />
which should typically take<br />
no more than 32 seconds, the user<br />
must return to the ‘Preview Mode’.<br />
This mode is now used to check<br />
that the crystal area is clean before<br />
placing the next sample on the crystal.<br />
A 100% T line with no spectral<br />
features (Figure 9) should be seen if<br />
the crystal is clean, if spectral features<br />
are seen, the crystal should<br />
be cleaned again using a solvent<br />
soaked tissue. The next sample can<br />
be placed on the crystal area once<br />
the 100% T line has been displayed<br />
and the sampling steps are repeated.<br />
Conclusion<br />
<strong>ATR</strong> is an IR sampling technique that<br />
provides excellent quality data in<br />
conjunction with the best possible<br />
reproducibility of any IR sampling<br />
technique. It has revolutionized IR<br />
solid and liquid sampling through:<br />
• Faster sampling<br />
• Improving sample-to-sample<br />
reproducibility<br />
•Minimizing user to user spectral<br />
variation