FTIR Spectroscopy: Attenuated Total Reflectance (ATR)
FTIR Spectroscopy: Attenuated Total Reflectance (ATR)
FTIR Spectroscopy: Attenuated Total Reflectance (ATR)

Create successful ePaper yourself
Turn your PDF publications into a flip-book with our unique Google optimized e-Paper software.
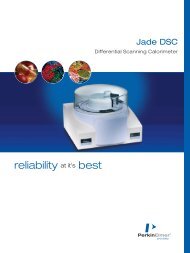
FT-IR <strong>Spectroscopy</strong><br />
<strong>Attenuated</strong> <strong>Total</strong> <strong>Reflectance</strong> (<strong>ATR</strong>)<br />
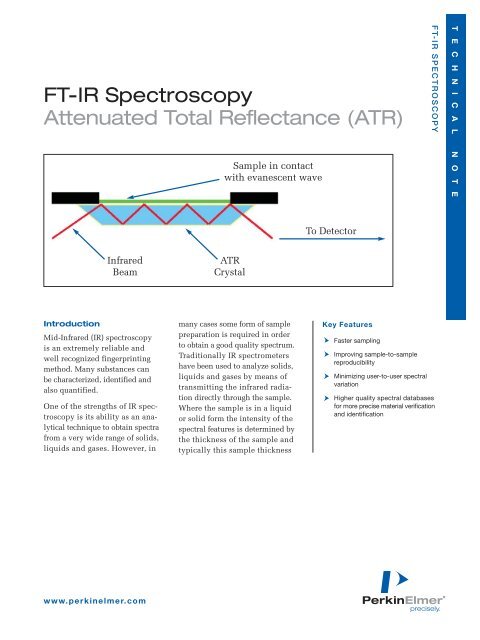
Infrared<br />
Beam<br />
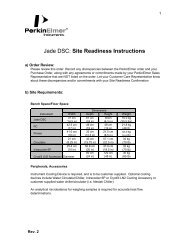
Introduction<br />
Mid-Infrared (IR) spectroscopy<br />
is an extremely reliable and<br />
well recognized fingerprinting<br />
method. Many substances can<br />
be characterized, identified and<br />
also quantified.<br />
One of the strengths of IR spectroscopy<br />
is its ability as an analytical<br />
technique to obtain spectra<br />
from a very wide range of solids,<br />
liquids and gases. However, in<br />
www.perkinelmer.com<br />
Sample in contact<br />
with evanescent wave<br />
<strong>ATR</strong><br />
Crystal<br />
many cases some form of sample<br />
preparation is required in order<br />
to obtain a good quality spectrum.<br />
Traditionally IR spectrometers<br />
have been used to analyze solids,<br />
liquids and gases by means of<br />
transmitting the infrared radiation<br />
directly through the sample.<br />
Where the sample is in a liquid<br />
or solid form the intensity of the<br />
spectral features is determined by<br />
the thickness of the sample and<br />
typically this sample thickness<br />
To Detector<br />
Key Features<br />
Faster sampling<br />
Improving sample-to-sample<br />
reproducibility<br />
Minimizing user-to-user spectral<br />
variation<br />
FT-IR SPECTROSCOPY<br />
Higher quality spectral databases<br />
for more precise material verification<br />
and identification<br />
T E C H N I C A L N O T E
cannot be more than a few tens of<br />
microns. Figure 1 displays a typical<br />
IR transmission spectrum.<br />
The technique of <strong>Attenuated</strong> <strong>Total</strong><br />
<strong>Reflectance</strong> (<strong>ATR</strong>) has in recent<br />
years revolutionized solid and<br />
liquid sample analyses because<br />
it combats the most challenging<br />
aspects of infrared analyses,<br />
namely sample preparation and<br />
spectral reproducibility.<br />
Issues surrounding<br />
traditional transmission<br />
sample preparation<br />
The two most common forms of<br />
sample preparation for solids both<br />
involve grinding the material to a<br />
fine powder and dispersing it in a<br />
matrix. The ground material can be<br />
dispersed in a liquid to form a mull.<br />
The most commonly used liquid is<br />
mineral oil (nujol). Typically no<br />
more than 20 mg of solid is ground<br />
and then one or two drops of nujol<br />
are used to create a paste which is<br />
then spread between two Mid-Infrared<br />
transparent windows e.g. NaCl,<br />
KBr, CaF2. The sample is now ready<br />
to be placed in the spectrometer for<br />
analysis by transmission.<br />
Potassium bromide (KBr) is probably<br />
the most widely used matrix<br />
material. Between 1 and 3 mg of<br />
ground material needs to be mixed<br />
Figure 1. A Mid-Infrared spectrum of Hexene.<br />
2<br />
thoroughly with about 350 mg of<br />
ground KBr. The mixture is now<br />
transferred to a die that has a barrel<br />
diameter of 13 mm (Figure 2). This is<br />
then placed in a suitable press and<br />
pressed (evacuation is optional) at<br />
around 12,000 psi for one to two<br />
minutes. Re-crystallization of the<br />
KBr results in a clear glassy disk<br />
about 1 mm thick. This disk is now<br />
ready to be analyzed by transmission.<br />
Evacuable KBr Die<br />
Figure 2. Potassium bromide 13 mm die.<br />
Figure 3. Sealed (l) and demountable (r)<br />
liquid cells.<br />
Liquids are traditionally analyzed<br />
as thin films in cells (Figure 3), a cell<br />
consists of two IR transparent windows.<br />
A Teflon ® spacer is generally<br />
used to produce a film of the desired<br />
thickness or pathlength. A constant<br />
pathlength is highly desirable when<br />
performing quantitative analyses.<br />
Overall, sample preparation is easier<br />
for liquid transmission studies<br />
when compared to solid transmission<br />
sampling but both suffer from<br />
inevitable reproducibility issues<br />
given the complexity of the sample<br />
preparation methods. In addition,<br />
preparation can be very messy and<br />
time consuming and is further complicated<br />
by difficulties in getting<br />
sample to matrix ratios correct and<br />
homogenous throughout the sample.<br />
The materials involved are fragile and<br />
hydroscopic and the quality of measurements<br />
can be adversely affected if<br />
handled or stored incorrectly. The<br />
technique of <strong>Attenuated</strong> <strong>Total</strong><br />
<strong>Reflectance</strong> addresses these issues.<br />
Principles of <strong>ATR</strong><br />
An attenuated total reflection<br />
accessory operates by measuring<br />
the changes that occur in a totally<br />
internally reflected infrared beam<br />
when the beam comes into contact<br />
with a sample (indicated in Figure 4).<br />
An infrared beam is directed onto<br />
an optically dense crystal with a<br />
high refractive index at a certain<br />
angle. This internal reflectance<br />
creates an evanescent wave that<br />
extends beyond the surface of the<br />
crystal into the sample held in contact<br />
with the crystal. It can be easier<br />
to think of this evanescent wave as<br />
a bubble of infrared that sits on the<br />
surface of the crystal. This evanescent<br />
wave protrudes only a few microns<br />
(0.5 µ - 5 µ) beyond the crystal<br />
surface and into the sample. Consequently,<br />
there must be good contact<br />
between the sample and the crystal<br />
surface. In regions of the infrared<br />
spectrum where the sample absorbs<br />
energy, the evanescent wave will be<br />
attenuated or altered. The attenuated<br />
energy from each evanescent wave
is passed back to the IR beam, which<br />
then exits the opposite end of the<br />
crystal and is passed to the detector<br />
in the IR spectrometer. The system<br />
then generates an infrared spectrum.<br />
For the technique to be successful,<br />
the following two requirements must<br />
be met:<br />
• The sample must be in direct<br />
contact with the <strong>ATR</strong> crystal,<br />
because the evanescent wave or<br />
bubble only extends beyond the<br />
crystal 0.5 µ - 5 µ.<br />
• The refractive index of the crystal<br />
must be significantly greater<br />
than that of the sample or else<br />
internal reflectance will not occur<br />
– the light will be transmitted<br />
rather than internally reflected in<br />
the crystal. Typically, <strong>ATR</strong> crystals<br />
have refractive index values between<br />
2.38 and 4.01 at 2000 cm -1 .<br />
It is safe to assume that the majority<br />
of solids and liquids have much<br />
lower refractive indices.<br />
<strong>ATR</strong> accessories<br />
The traditional <strong>ATR</strong> design in which<br />
a thin sample was clamped against<br />
the vertical face of the crystal has<br />
been now been replaced by a horizontal<br />
design. In horizontal <strong>ATR</strong><br />
(H<strong>ATR</strong>) units, the crystal is a parallel-sided<br />
plate, typically about 5 cm<br />
by 1 cm, with the upper surface exposed<br />
(Figure 4). The number of<br />
reflections at each surface of the<br />
crystal is usually between five and<br />
ten, depending on the length and<br />
thickness of the crystal and the angle<br />
of incidence.<br />
When measuring solids by <strong>ATR</strong>, it<br />
is essential to ensure good optical<br />
contact between the sample and the<br />
crystal. The accessories have devices<br />
that clamp the sample to the crystal<br />
surface and apply pressure. This<br />
works well with elastomers and other<br />
deformable materials, and also with<br />
fine powders but many solids give<br />
very weak spectra because the contact<br />
is confined to small areas. The<br />
effects of poor contact are greatest<br />
at shorter wavelengths where the<br />
depth of penetration is lowest.<br />
The issue of solid sample/crystal<br />
contact has been overcome to a great<br />
extent by the introduction of <strong>ATR</strong><br />
accessories with very small crystals,<br />
typically about 2 mm across. The<br />
most frequently used small crystal<br />
<strong>ATR</strong> material is diamond because it<br />
has the best durability and chemical<br />
inertness. These small area <strong>ATR</strong> crystal<br />
top-plates generally provide only a<br />
single reflection but this is sufficient,<br />
given the very low noise levels of<br />
PerkinElmer’s modern FT-IR spectrometers.<br />
Much higher pressure with<br />
limited force can now be generated<br />
onto these small areas. A much<br />
smaller area of contact is now required<br />
in comparison to the H<strong>ATR</strong><br />
units. As a result, spectra can be<br />
obtained from a wide variety of<br />
solid materials including minerals.<br />
Germanium has a much better working<br />
pH range and can be used to<br />
analyze weak acids and alkalis.<br />
Germanium has by far the highest<br />
refractive index of all the <strong>ATR</strong><br />
materials available which means<br />
that the effective depth of penetration<br />
is approximately 1 micron.<br />
For most samples this will result<br />
in a weak spectrum being produced,<br />
however, this is an advantage when<br />
analyzing highly absorbing materials;<br />
carbon black filled rubbers are<br />
typically analyzed using Germanium<br />
<strong>ATR</strong> accessories.<br />
Diamond is by far the best <strong>ATR</strong> crystal<br />
material because of its robustness<br />
and durability. The original purchase<br />
cost is obviously higher than that of<br />
other crystal materials available, but<br />
over the instrument’s lifetime replacement<br />
costs should be minimal.<br />
The same cannot be said of Zinc<br />
Selenide or Germanium, both of<br />
which can scratch and break with<br />
improper use.<br />
As with all FT-IR measurements, an<br />
infrared background is collected, in<br />
this case, from the clean <strong>ATR</strong> crystal.<br />
The crystals are usually cleaned<br />
by using a solvent soaked piece of<br />
tissue. Typically water, methanol or<br />
isopropanol are used to clean <strong>ATR</strong><br />
crystals. The <strong>ATR</strong> crystal must be<br />
checked for contamination and carry<br />
over before sample presentation,<br />
this is true for all liquids and solids.<br />
Crystal materials<br />
and cleaning<br />
There are a number of crystal materials<br />
available for <strong>ATR</strong>. Zinc Selenide<br />
(ZnSe) and Germanium are by far<br />
the most common used for H<strong>ATR</strong><br />
sampling. Zinc Selenide is a relatively<br />
low cost <strong>ATR</strong> crystal material<br />
and is ideal for analyzing liquids<br />
and non-abrasive pastes<br />
and gels but it is not<br />
particularly robust with<br />
a working pH range of<br />
5-9. ZnSe scratches quite<br />
Sample in contact<br />
with evanescent wave<br />
easily and so care must<br />
be taken when cleaning<br />
To Detector<br />
the crystal. It is recom-<br />
Infrared <strong>ATR</strong><br />
mended that lint free<br />
Beam<br />
Crystal<br />
tissue is used.<br />
Figure 4. A multiple reflection <strong>ATR</strong> system.<br />
www.perkinelmer.com<br />
3
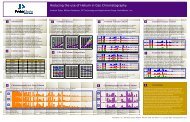
Analyzing liquids<br />
After the crystal has been cleaned<br />
and an infrared background has<br />
been collected, the liquid is simply<br />
poured onto the crystal (Figure 5).<br />
The whole crystal must be covered if<br />
performing a quantitative or qualitative<br />
analysis. The crystal is recessed<br />
into the metal plate to retain the<br />
sample. Pastes and other semi-solid<br />
samples are readily measured by<br />
spreading them on the crystal. Horizontal<br />
<strong>ATR</strong> units are often used for<br />
quantitative work in preference to<br />
transmission cells because they are<br />
easier to clean and maintain.<br />
Figure 5. Using a pipette to add a liquid<br />
sample to a ZnSe H<strong>ATR</strong> trough plate.<br />
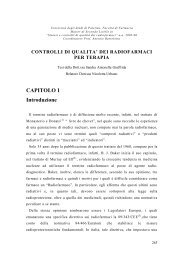
Analyzing solids<br />
Solids are generally best analyzed<br />
on the single reflection <strong>ATR</strong> accessories;<br />
diamond being the preferred<br />
choice for most applications because<br />
of its robustness and durability.<br />
Figure 6. Placing a powder sample onto the<br />
Universal diamond <strong>ATR</strong> top-plate.<br />
4<br />
After the crystal area has been<br />
cleaned and the background collected,<br />
the solid material is placed<br />
onto the small crystal area (Figure 6).<br />
Experience has shown that ideal<br />
results from powder samples have<br />
been achieved by placing just<br />
enough sample to cover the crystal<br />
area. The sample height should not<br />
be more than a few millimeters.<br />
Once the solid has been placed on the<br />
crystal area, the pressure arm should<br />
be positioned over the crystal/sample<br />
area. When using the Spectrum 100<br />
Series’ Universal <strong>ATR</strong> accessory,<br />
the pressure arm locks into a precise<br />
position above the diamond crystal<br />
(Figure 7). Force is applied to the<br />
sample, pushing it onto the diamond<br />
surface.<br />
Figure 7. Applying pressure to a solid sample<br />
on the Universal diamond <strong>ATR</strong> top-plate.<br />
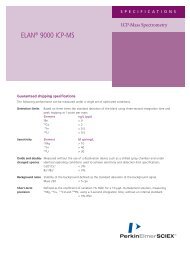
PerkinElmer’s revolutionary<br />
Spectrum FT-IR software utilizes<br />
a ‘Preview Mode’ which allows the<br />
quality of the spectrum to be<br />
monitored in real-time while fine<br />
tuning the exerted force. It is good<br />
practice to apply pressure until the<br />
strongest spectral bands have an<br />
intensity which extends beyond<br />
70% T, namely from a baseline at<br />
100% T down to 70% T. Good<br />
sample/crystal interface contact has<br />
been achieved once this rule has<br />
been satisfied. This is very easy to<br />
achieve with soft samples and fine<br />
powders, this is shown in Figure 8.<br />
The strongest bands here extend<br />
beyond 20% T with relatively little<br />
force applied; the force gauge is<br />
registering 80 N. A lot more pressure<br />
would need to be applied when<br />
analyzing high density polymers and<br />
coatings on metal surfaces. Once the<br />
user is satisfied with the spectrum<br />
shown in this ‘Preview Mode’, the<br />
data is then collected in the normal<br />
manner. The force should not be<br />
adjusted when co-adding the final<br />
spectrum. Unlike transmission<br />
measurements, <strong>ATR</strong> sampling does<br />
not produce totally absorbing<br />
spectral bands because the effective<br />
path-length is controlled by the<br />
crystal properties thereby minimizing<br />
sample re-preparation time.<br />
After the spectrum has been collected,<br />
which should typically take<br />
no more than 32 seconds, the user<br />
must return to the ‘Preview Mode’.<br />
This mode is now used to check<br />
that the crystal area is clean before<br />
placing the next sample on the crystal.<br />
A 100% T line with no spectral<br />
features (Figure 9) should be seen if<br />
the crystal is clean, if spectral features<br />
are seen, the crystal should<br />
be cleaned again using a solvent<br />
soaked tissue. The next sample can<br />
be placed on the crystal area once<br />
the 100% T line has been displayed<br />
and the sampling steps are repeated.<br />
Conclusion<br />
<strong>ATR</strong> is an IR sampling technique that<br />
provides excellent quality data in<br />
conjunction with the best possible<br />
reproducibility of any IR sampling<br />
technique. It has revolutionized IR<br />
solid and liquid sampling through:<br />
• Faster sampling<br />
• Improving sample-to-sample<br />
reproducibility<br />
•Minimizing user to user spectral<br />
variation
Figure 8. ‘Preview Mode’ screenshot taken from PerkinElmer’s Spectrum<br />
v6 FT-IR software.<br />
Figure 9: ‘Preview Mode’ displaying a 100%T line, namely a spectrum<br />
of a clean diamond <strong>ATR</strong> crystal.<br />
PerkinElmer Life and<br />
Analytical Sciences<br />
710 Bridgeport Avenue<br />
Shelton, CT 06484-4794 USA<br />
Phone: (800) 762-4000 or<br />
(+1) 203-925-4602<br />
www.perkinelmer.com<br />
For a complete listing of our global offices, visit www.perkinelmer.com/lasoffices<br />
Most importantly, the improved spectral<br />
acquisition and reproducibility<br />
associated with this technique leads<br />
to better quality database building for<br />
more precise material verification<br />
and identification. <strong>ATR</strong> is clearly<br />
an extremely robust and reliable<br />
technique for quantitative studies<br />
involving liquids.<br />
©2005 PerkinElmer, Inc. All rights reserved. The PerkinElmer logo and design are registered trademarks of PerkinElmer, Inc. Spectrum is a trademark and PerkinElmer is a registered<br />
trademark of PerkinElmer, Inc. or its subsidiaries, in the United States and other countries. Teflon is a registered trademark of E.I. du Pont de Nemours and Company. All other trademarks<br />
not owned by PerkinElmer, Inc. or its subsidiaries that are depicted herein are the property of their respective owners. PerkinElmer reserves the right to change this document at any time<br />
without notice and disclaims liability for editorial, pictorial or typographical errors.<br />
007024B_01 Printed in USA