Chapter 26 - Metamorphic Reactions - Faculty web pages
Chapter 26 - Metamorphic Reactions - Faculty web pages
Chapter 26 - Metamorphic Reactions - Faculty web pages

You also want an ePaper? Increase the reach of your titles
YUMPU automatically turns print PDFs into web optimized ePapers that Google loves.
<strong>Chapter</strong> <strong>26</strong>: <strong>Metamorphic</strong> <strong>Reactions</strong><br />
If we treat isograds as reactions, we can:<br />
Understand what physical variables might<br />
affect the location of a particular isograd<br />
We may also be able to estimate the P-T-X P<br />
conditions that an isograd represents
Types of <strong>Metamorphic</strong> <strong>Reactions</strong><br />
1. Phase Transformations:<br />
Phase transformations (the polymorphs of SiO 2 or<br />
Al 2 SiO 5 or graphite-diamond or calcite-aragonite)<br />
aragonite)<br />
are the simplest to deal with<br />
The transformations depend on temperature and<br />
pressure only
1. Phase Transformations<br />
Figure <strong>26</strong>-1. A portion of the<br />
equilibrium boundary for the calcitearagonite<br />
phase transformation in the<br />
CaCO 3<br />
system. After Johannes and<br />
Puhan (1971), Contrib. Mineral. Petrol.,<br />
31, 28-38. Winter (2001) An<br />
Introduction to Igneous and<br />
<strong>Metamorphic</strong> Petrology. Prentice Hall.
Figure <strong>26</strong>-15. The P-T phase diagram<br />
for the system Al 2<br />
SiO 5<br />
showing the<br />
stability fields for the three<br />
polymorphs andalusite, kyanite, and<br />
sillimanite. Calculated using the<br />
program TWQ (Berman, 1988, 1990,<br />
1991). Winter (2001) An Introduction<br />
to Igneous and <strong>Metamorphic</strong><br />
Petrology. Prentice Hall.<br />
1. Phase Transformations
1. Phase Transformations<br />
<br />
<br />
Little driving force for phase transformations to proceed<br />
→ common metastable relics of one polymorph in the<br />
stability field of another<br />
Coexisting polymorphs may therefore represent non-<br />
equilibrium states
Figure 6-16. T-X phase<br />
diagram of the system<br />
albite-orthoclase at 0.2<br />
GPa H 2<br />
O pressure. After<br />
Bowen and Tuttle (1950). J.<br />
Geology, 58, 489-511. Winter<br />
(2001) An Introduction to<br />
Igneous and <strong>Metamorphic</strong><br />
Petrology. Prentice Hall.<br />
2. Exsolution
3. Solid-Solid Net-Transfer <strong>Reactions</strong><br />
Involve solids only<br />
Differ from polymorphic transformations: involve<br />
solids of differing composition, and thus material<br />
must diffuse from one site to another for the<br />
reaction to proceed
3. Solid-Solid Net-Transfer <strong>Reactions</strong><br />
Examples:<br />
NaAlSi 2 O 6 + SiO 2 = NaAlSi 3 O 8<br />
Jd<br />
Qtz<br />
MgSiO 3 + CaAl 2 Si 2 O 8<br />
En<br />
An<br />
Ab<br />
4 (Mg,Fe)SiO 3 + CaAl 2 Si 2 O 8 =<br />
Opx<br />
Plag<br />
= CaMgSi 2 O 6 + Al 2 SiO 5<br />
Di<br />
And<br />
(Mg,Fe) 3 Al 2 Si 3 O 12 + Ca(Mg,Fe)Si 2 O 6 + SiO 2<br />
Gnt<br />
Cpx<br />
Qtz
Figure 27-1. Temperature-pressure phase diagram for the reaction: Albite = Jadeite + Quartz calculated using the<br />
program TWQ of Berman (1988, 1990, 1991). Winter (2001) An Introduction to Igneous and <strong>Metamorphic</strong> Petrology. Prentice<br />
Hall.
3. Solid-Solid Net-Transfer <strong>Reactions</strong><br />
If minerals contain volatiles, the volatiles must be<br />
conserved in the reaction so that no fluid phase is<br />
generated or consumed<br />
For example, the reaction:<br />
Mg 3 Si 4 O 10 (OH) 2 + 4 MgSiO 3 = Mg 7 Si 8 O 22 (OH) 2<br />
Tlc<br />
En<br />
Ath<br />
involves hydrous phases, but conserves H 2 O<br />
It may therefore be treated as a solid-solid net-<br />
transfer reaction
3. Solid-Solid Net-Transfer <strong>Reactions</strong><br />
When solid-solution solution is limited, solid-solid net-<br />
transfer reactions are discontinuous reactions<br />
Discontinuous reactions run to completion at a<br />
single temperature and at a particular pressure<br />
There is thus an abrupt, discontinuous change<br />
from the reactant assemblage to the product<br />
assemblage at the reaction isograd
4. Devolatilization <strong>Reactions</strong><br />
Among the most common metamorphic reactions<br />
H 2 O-CO<br />
2 systems are most common<br />
<strong>Reactions</strong> dependent not only upon temperature<br />
and pressure, but also upon the partial pressure of<br />
the volatile species
4. Devolatilization <strong>Reactions</strong><br />
<br />
For example the location on a P-T P T phase diagram of the<br />
dehydration reaction:<br />
KAl 2 Si 3 AlO 10 (OH) 2 + SiO 2 = KAlSi 3 O 8 + Al 2 SiO 5 + H 2 O<br />
Ms<br />
Qtz<br />
Kfs<br />
Sill<br />
depends upon the partial pressure of H 2 O (p(<br />
H2O )<br />
This dependence is easily demonstrated by applying Le<br />
Châtelier’s s principle to the reaction at equilibrium<br />
W
4. Devolatilization <strong>Reactions</strong><br />
The equilibrium curve<br />
represents equilibrium<br />
between the reactants and<br />
products under water-<br />
saturated conditions<br />
(p H2O = P Lithostatic )<br />
P-T phase diagram for the reaction Ms + Qtz<br />
= Kfs + Al 2<br />
SiO 5<br />
+ H 2<br />
O showing the shift in<br />
equilibrium conditions as p H2O<br />
varies<br />
(assuming ideal H 2<br />
O-CO 2<br />
mixing). Calculated<br />
using the program TWQ by Berman (1988,<br />
1990, 1991). After Winter (2001) An<br />
Introduction to Igneous and <strong>Metamorphic</strong><br />
Petrology. Prentice Hall.
KAl 2 Si 3 AlO 10 (OH) 2 + SiO 2 = KAlSi<br />
AlO 10<br />
Ms<br />
Qtz<br />
= KAlSi 3 O 8 + Al 2 SiO 5 + H 2 O<br />
Kfs<br />
Sill<br />
W<br />
<br />
<br />
<br />
<br />
Suppose H 2 O is withdrawn from the system at some point<br />
on the water-saturated equilibrium curve: p H2O < P lithostatic<br />
According to Le Châtelier’s s Principle, removing water at<br />
equilibrium will be compensated by the reaction running<br />
to the right, thereby producing more water<br />
This has the effect of stabilizing the right side of the<br />
reaction at the expense of the left side<br />
So as water is withdrawn the Kfs + Sill + H 2 O field<br />
expands slightly at the expense of the Mu + Qtz field, and<br />
the reaction curve shifts toward lower temperature
Figure <strong>26</strong>-2. P-T phase<br />
diagram for the reaction<br />
Ms + Qtz = Kfs + Al 2<br />
SiO 5<br />
+<br />
H 2<br />
O showing the shift in<br />
equilibrium conditions as<br />
p H2O<br />
varies (assuming ideal<br />
H 2<br />
O-CO 2<br />
mixing).<br />
Calculated using the program<br />
TWQ by Berman (1988, 1990,<br />
1991). Winter (2001) An<br />
Introduction to Igneous and<br />
<strong>Metamorphic</strong> Petrology.<br />
Prentice Hall.
4. Devolatilization <strong>Reactions</strong><br />
<br />
p H2O<br />
P fluid<br />
H2O can become less than P Lith by either of two ways<br />
fluid < P Lith by drying out the rock and reducing the<br />
fluid content<br />
P fluid = P Lith , but the water in the fluid can become<br />
diluted by adding another fluid component, such as<br />
CO 2 or some other volatile phase
4. Devolatilization <strong>Reactions</strong><br />
<br />
<br />
The temperature of an isograd based on a devolatilization<br />
reaction is sensitive to the partial pressure of the volatile<br />
species involved<br />
T-X fluid phase diagram<br />
Because H 2 O and CO 2 are by far the most common<br />
metamorphic volatiles, the X in T-X T X diagrams is usually<br />
the mole fraction of CO 2 (or H 2 O) in H 2 O-CO<br />
2 mixtures<br />
Because pressure is also a common variable, a T-XT<br />
fluid<br />
diagram must be created for a specified pressure
Figure <strong>26</strong>-4. T-X H2O<br />
phase<br />
diagram for the reaction Ms<br />
+ Qtz = Kfs + Sil + H 2<br />
O at<br />
0.5 GPa assuming ideal<br />
H 2<br />
O-CO 2<br />
mixing, calculated<br />
using the program TWQ by<br />
Berman (1988, 1990, 1991).<br />
Winter (2001) An Introduction<br />
to Igneous and <strong>Metamorphic</strong><br />
Petrology. Prentice Hall.<br />
4. Devolatilization <strong>Reactions</strong>
4. Devolatilization <strong>Reactions</strong><br />
Figure <strong>26</strong>-2. Winter (2001) An Introduction to Igneous and<br />
<strong>Metamorphic</strong> Petrology. Prentice Hall.<br />
Figure <strong>26</strong>-4. Winter (2001) An Introduction to Igneous and<br />
<strong>Metamorphic</strong> Petrology. Prentice Hall.
4. Devolatilization <strong>Reactions</strong><br />
Shape of ~ all dehydration curves on T-XT<br />
fluid<br />
diagrams is similar to the curve below<br />
<br />
Maximum temperature is at the pure H 2 O end, and<br />
slope gently at high X H2O , but steeper toward low<br />
X H2O , becoming near vertical at very low X H2O
4. Devolatilization <strong>Reactions</strong><br />
Decarbonation reactions<br />
CaCO 3<br />
Cal<br />
+ SiO 2 = CaSiO 3 + CO 2 (<strong>26</strong>-6)<br />
6)<br />
Qtz<br />
Wo<br />
Can also be shown on a T-XT<br />
CO2 diagram<br />
Maximum thermal stability of the carbonate<br />
mineral assemblage occurs at pure X CO2
4. Devolatilization <strong>Reactions</strong><br />
Figure <strong>26</strong>-1. A portion of the equilibrium boundary for the calcitearagonite<br />
phase transformation in the CaCO 3<br />
system. After<br />
Johannes and Puhan (1971), Contrib. Mineral. Petrol., 31, 28-38.<br />
Winter (2001) An Introduction to Igneous and <strong>Metamorphic</strong><br />
Petrology. Prentice Hall.<br />
Figure <strong>26</strong>-5. T-X CO2<br />
phase diagram for the reaction Cal + Qtz<br />
= Wo + CO 2<br />
at 0.5 GPa assuming ideal H 2<br />
O-CO 2<br />
mixing,<br />
calculated using the program TWQ by Berman (1988, 1990,<br />
1991). Winter (2001) An Introduction to Igneous and<br />
<strong>Metamorphic</strong> Petrology. Prentice Hall.
5 types of<br />
devolatilization<br />
reactions, each with a<br />
unique general shape<br />
on a T-X T X diagram<br />
Reaction #3:<br />
dehydration-<br />
decarbonation<br />
Ca 2 Mg 5 Si 8 O 22 (OH) 2 + 3 CaCO 3 + 2 SiO 2<br />
Tr<br />
Cal<br />
Qtz<br />
= 5 CaMgSi 2 O 6 + 3 CO 2 + H 2 O<br />
Di<br />
Figure <strong>26</strong>-6. Schematic T-X CO2<br />
phase diagram illustrating the general<br />
shapes of the five types of reactions involving CO 2<br />
and H 2<br />
O fluids. After<br />
Greenwood (1967). In P. H. Abelson (ed.), Researches in Geochemistry. John<br />
Wiley. New York. V. 2, 542-567. Winter (2001) An Introduction to Igneous<br />
and <strong>Metamorphic</strong> Petrology. Prentice Hall.
5. Continuous <strong>Reactions</strong><br />
Continuous reactions involve members of a solid solution<br />
series.<br />
Most metamorphic reactions.<br />
Partitioning of chemical elements between phases changes<br />
progressively during reactions over range of P and T OR<br />
with the production of new phases<br />
e.g., Ca-rich garnet grows accompanied by reduction in An<br />
content of plagioclase as it reacts and fractionates into the<br />
garnet
5. Continuous <strong>Reactions</strong><br />
<br />
Continuous reactions occur when the reactants and<br />
products coexist over a temperature (or grade) interval<br />
<br />
The composition of solid solution phases vary<br />
across the interval, and the proportions of the<br />
minerals changes until one of the reactants<br />
disappears with increasing grade
5. Continuous <strong>Reactions</strong><br />
<br />
Discontinuous reactions occur at a constant grade<br />
Do not involve solid solution series<br />
The P-T P T path crosses the reaction at a single grade<br />
Take place instantaneously at specified P and T<br />
e.g., tie line switch reaction – caused disappearance<br />
of particular mineral only from certain rock<br />
composition; or disappearance of mineral from all<br />
rock compositions
6. Ion Exchange <strong>Reactions</strong><br />
<br />
<br />
<br />
<br />
Reciprocal exchange of components between 2 or<br />
more minerals<br />
MgSiO 3 + CaFeSi 2 O 6 = FeSiO 3 + CaMgSi 2 O 6<br />
Annite + Pyrope = Phlogopite + Almandine<br />
Expressed as pure end-members, but really<br />
involves Mg-Fe (or other) exchange between<br />
intermediate solutions<br />
Basis for many geothermobarometers<br />
Causes rotation of tie-lines on compatibility<br />
diagrams
Figure 27-6. AFM projections showing the relative distribution of Fe and Mg in garnet vs.<br />
biotite at approximately 500 o C (a) and 800 o C (b). From Spear (1993) <strong>Metamorphic</strong> Phase Equilibria and<br />
Pressure-Temperature-Time Paths. Mineral. Soc. Amer. Monograph 1. MSA. Winter (2001) An Introduction to Igneous and<br />
<strong>Metamorphic</strong> Petrology. Prentice Hall.
6. Redox <strong>Reactions</strong><br />
<br />
<br />
Involves a change in oxidation state of an element<br />
6 Fe 2 O 3 = 4 Fe 3 O 4 + O 2<br />
2 Fe 3 O 4 + 3 SiO 2 = 3 Fe 2 SiO 4 + O 2<br />
At any particular pressure these become oxygen<br />
buffers<br />
Fig. <strong>26</strong>-10. Isobaric T-f O2<br />
diagram showing the location of<br />
reactions (<strong>26</strong>-13) - (<strong>26</strong>-15) used<br />
to buffer oxygen in<br />
experimental systems. After Frost<br />
(1991), Rev. in Mineralogy, 25, MSA,<br />
pp. 469-488. Winter (2001) An<br />
Introduction to Igneous and<br />
<strong>Metamorphic</strong> Petrology. Prentice<br />
Hall.
7. <strong>Reactions</strong> Involving Dissolved Species<br />
<br />
Minerals plus ions plus neutral molecules dissolved in<br />
a fluid<br />
<br />
One example is hydrolysis:<br />
2 KAlSi 3 O 8 + 2 H + + H 2 O = Al 2 Si 2 O 5 (OH) 4 +<br />
SiO 2 + 2 K +<br />
Kfs + aq. species = kaolinite + aq. . species
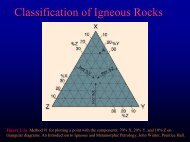
<strong>Reactions</strong> and Chemographics<br />
We can use chemographics to infer reactions<br />
Per Fo En Qtz<br />
MgO SiO 2<br />
Fo + Qtz = En<br />
Mg 2 SiO 4 + SiO 2 = Mg 2 Si 2 O 6<br />
En + Per = Fo<br />
Mg 2 Si 2 O 6 + 2 MgO = 2 Mg 2 SiO 4<br />
Per + Qtz = Fo or En<br />
If we know the chemographics we can determine<br />
that a reaction is possible
<strong>Reactions</strong> and Chemographics<br />
What reaction is possible between A-B-C-D? A<br />
A chemographic<br />
diagram for some<br />
metamorphic zone<br />
Fig. <strong>26</strong>-14a. From Winter (2001) An<br />
Introduction to Igneous and<br />
<strong>Metamorphic</strong> Petrology. Prentice<br />
Hall.
Below the<br />
isograd<br />
Fig. <strong>26</strong>-14. From Winter (2001) An<br />
Introduction to Igneous and<br />
<strong>Metamorphic</strong> Petrology. Prentice<br />
Hall.<br />
A + B = C + D<br />
At the isograd<br />
Above the<br />
isograd<br />
This is called a tie-line flip, , and<br />
results in new groupings in the<br />
next metamorphic zone
Petrogenetic Grids<br />
<br />
P-T T diagrams for multicomponent systems that show a<br />
set of reactions, generally for a specific rock type<br />
Petrogenetic grid<br />
for mafic rocks<br />
Fig. <strong>26</strong>-19.<br />
Simplified petrogenetic grid for metamorphosed mafic rocks showing the location of several determined<br />
univariant reactions in the CaO-MgO<br />
MgO-Al<br />
2<br />
O 3<br />
-SiO<br />
2<br />
-H 2<br />
O-(Na<br />
2<br />
O) system (“C(N)MASH(<br />
C(N)MASH”). ). Winter (2001) An<br />
Introduction to Igneous and <strong>Metamorphic</strong> Petrology. Prentice Hall.