SIP Performance Chart - Thefinapolis
SIP Performance Chart - Thefinapolis
SIP Performance Chart - Thefinapolis
Create successful ePaper yourself
Turn your PDF publications into a flip-book with our unique Google optimized e-Paper software.
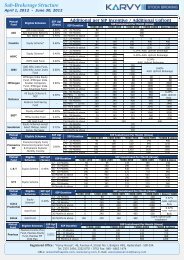
<strong>SIP</strong> <strong>Performance</strong> <strong>Chart</strong><br />
PF / MFS / 13122010 / 648 December 13, 2010<br />
Scheme Name<br />
Current<br />
NAV (Rs)<br />
as on 9<br />
Dec, 10<br />
Present<br />
Value<br />
(Rs)<br />
<strong>SIP</strong> For 1 Year <strong>SIP</strong> For 3 Years <strong>SIP</strong> For 5 Years<br />
Investment Amount 12000 Investment Amount 36000 Investment Amount 60000<br />
Start Date: 9 December 2009 Start Date: 9 December 2007 Start Date: 9 December 2005<br />
End Date: 9 December 2010 End Date: 9 December 2010 End Date: 9 December 2010<br />
Yield<br />
Profit-<br />
<strong>SIP</strong><br />
Profit-<br />
One Time<br />
Investment<br />
Present<br />
Value (Rs)<br />
Index - SENSEX<br />
Yield<br />
Profit-<strong>SIP</strong><br />
Profit-<br />
One Time<br />
Investment<br />
Present<br />
Value (Rs)<br />
Yield<br />
Profit-<strong>SIP</strong><br />
Profit-<br />
One Time<br />
Investment<br />
Franklin India Index-BSE Sensex(G) 55.9251 13291.41 10.76 1291.41 1613.70 49109.61 36.42 13109.61 -192.59 86448.98 44.08 26448.98 65963.11<br />
HDFC Index-Sensex Plus(G) 242.2693 13501.81 12.52 1501.81 2080.40 52330.15 45.36 16330.15 4598.94 94599.97 57.67 34599.97 84603.57<br />
HDFC Index-Sensex Plus(G)(Post<br />
Addendum)<br />
242.2693 13501.81 12.52 1501.81 2080.40 52330.15 45.36 16330.15 4598.94 94599.97 57.67 34599.97 84603.57<br />
HDFC Index-Sensex(G) 165.8474 13282.73 10.69 1282.73 1573.41 48121.43 33.67 12121.43 -2994.74 81489.77 35.82 21489.77 53091.78<br />
HDFC Index-Sensex(G)(Post Addendum) 165.8474 13282.73 10.69 1282.73 1573.41 48121.43 33.67 12121.43 -2994.74 81489.77 35.82 21489.77 53091.78<br />
LICMF Index-Sensex Adv(G) 34.8021 13178.30 9.82 1178.30 1474.21 47927.52 33.13 11927.52 -4128.81 78938.94 31.56 18938.94 36390.91<br />
LICMF Index-Sensex(G) 37.0771 13299.11 10.83 1299.11 1637.22 47994.98 33.32 11994.98 -2782.99 80722.74 34.54 20722.74 50692.23<br />
Tata Index-Sensex(G) 48.2741 13251.72 10.43 1251.72 1544.45 48586.67 34.96 12586.67 -1749.08 84141.92 40.24 24141.92 61682.03<br />
UTI Master Index(G) 61.4996 13298.83 10.82 1298.83 1626.13 49034.58 36.21 13034.58 -1126.78 85669.24 42.78 25669.24 65742.05<br />
UTI VIS(G) 17.5111 12914.97 7.62 914.97 1154.95 42103.89 16.96 6103.89 -3717.18 68108.47 13.51 8108.47 12431.25<br />
Source: ACE MF<br />
Disclaimer<br />
The information and views presented in this report are prepared by Karvy Stock Broking Limited. The information contained herein is based on our analysis and upon sources that we<br />
consider reliable. We, however, do not vouch for the accuracy or the completeness thereof. This material is for personal information and we are not responsible for any loss incurred based<br />
upon it. While acting upon any information or analysis mentioned in this report, investors may please note that neither Karvy nor Karvy Stock Broking nor any person connected with any<br />
associate companies of Karvy accepts any liability arising from the use of this information and views mentioned in this document.<br />
This report is intended for a restricted audience and we are not soliciting any action based on it.<br />
Research Team<br />
Pradeep Kumar S.<br />
E-mail : pradeep.s@karvy.com<br />
Neelima Bajaj, Santosh Rudrabhatla<br />
Direct Ph : 040 4467 7542<br />
Ph : 040 23312454 Ext : 7542<br />
Production: Raju A<br />
Call us on : 1800 425 8282<br />
10


