SIP Performance Chart - Thefinapolis
SIP Performance Chart - Thefinapolis
SIP Performance Chart - Thefinapolis
You also want an ePaper? Increase the reach of your titles
YUMPU automatically turns print PDFs into web optimized ePapers that Google loves.
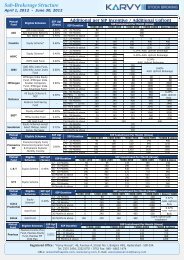
<strong>SIP</strong> <strong>Performance</strong> <strong>Chart</strong><br />
PF / MFS / 13122010 / 648 December 13, 2010<br />
Scheme Name<br />
Current<br />
NAV (Rs)<br />
as on 9<br />
Dec, 10<br />
Present<br />
Value<br />
(Rs)<br />
<strong>SIP</strong> For 1 Year <strong>SIP</strong> For 3 Years <strong>SIP</strong> For 5 Years<br />
Investment Amount 12000 Investment Amount 36000 Investment Amount 60000<br />
Start Date: 9 December 2009 Start Date: 9 December 2007 Start Date: 9 December 2005<br />
End Date: 9 December 2010 End Date: 9 December 2010 End Date: 9 December 2010<br />
Yield<br />
Profit-<br />
<strong>SIP</strong><br />
Profit-<br />
One Time<br />
Investment<br />
Present<br />
Value (Rs)<br />
Yield<br />
Profit-<strong>SIP</strong><br />
Profit-<br />
One Time<br />
Investment<br />
Present<br />
Value (Rs)<br />
Yield<br />
Profit-<strong>SIP</strong><br />
Profit-<br />
One Time<br />
Investment<br />
Reliance Pharma(G) 56.9617 13652.57 13.77 1652.57 3566.85 71882.14 99.67 35882.14 30332.88 138454.15 130.76 78454.15 134406.32<br />
Religare Banking-Reg(G) 22.6900 14892.40 24.10 2892.40 5398.08<br />
Religare Infrastructure(G) 8.8800 12656.59 5.47 656.59 1155.56 45952.14 27.64 9952.14 -8465.12<br />
Sahara Banking & Financial Services(G) 34.3060 14787.98 23.23 2787.98 5231.55<br />
Sahara Infra-Fixed Pricing(G) 16.9889 12073.24 0.61 73.24 14.99 45218.65 25.61 9218.65 -5950.95<br />
SBI Infrastructure-I(G) 10.7600 12353.29 2.94 353.29 379.67 43835.04 21.76 7835.04 -10431.68<br />
SBI Magnum Pharma(G) 46.0300 14018.12 16.82 2018.12 3437.67 57433.66 59.54 21433.66 6358.90 89659.91 49.43 29659.91 25372.49<br />
Sundaram-Select Thematic Funds-CAPEX<br />
Oppor(G)<br />
26.1284 12414.93 3.46 414.93 758.68 48549.13 34.86 12549.13 -7873.19 86537.70 44.23 26537.70 80216.45<br />
Sundaram-Select Thematic Funds-Energy<br />
Opp(G)<br />
8.6089 12155.93 1.30 155.93 -182.70<br />
Sundaram-Select Thematic Funds-Enter<br />
Oppor(G)<br />
15.3904 12049.21 0.41 49.21 176.67<br />
Sundaram-Select Thematic Funds-Fin<br />
Serv Oppor(G)<br />
22.6525 14943.49 24.53 2943.49 5118.84<br />
Tata Grow Economies Infra-B(G) 12.8828 12769.02 6.41 769.02 830.41<br />
Tata Infrastructure(G) 36.5081 12765.38 6.38 765.38 1153.07 47079.39 30.78 11079.39 -6517.23 86081.44 43.47 26081.44 85550.14<br />
Tata Service Inds(G) 25.9795 12697.92 5.82 697.92 944.87 51270.93 42.42 15270.93 -4290.51 85461.62 42.44 25461.62 49892.49<br />
Taurus Infrastructure(G) 14.9700 12469.98 3.92 469.98 1160.44 53196.69 47.77 17196.69 -5292.31<br />
UTI Banking Sector(G) 48.7500 15089.01 25.74 3089.01 5467.90 66319.26 84.22 30319.26 14272.13 127512.96 112.52 67512.96 124193.95<br />
UTI Energy(G) 11.4500 12111.86 0.93 111.86 159.29 43768.33 21.58 7768.33 -9058.82 55263.88 -7.89 -4736.12 -30117.44<br />
UTI Infrastructure Adv-1(G) 9.4100 12246.05 2.05 246.05 -88.61<br />
UTI Infrastructure(G) 36.0300 12165.46 1.38 165.46 23.36 42458.66 17.94 6458.66 -9780.47 75490.59 25.82 15490.59 60770.95<br />
UTI Pharma & Healthcare(G) 41.8300 14288.73 19.07 2288.73 4361.15 61142.65 69.84 25142.65 24187.05 107463.23 79.11 47463.23 61953.35<br />
UTI Services Inds(G) 62.6800 13106.28 9.22 1106.28 1515.90 50551.96 40.42 14551.96 -5274.51 83622.63 39.37 23622.63 42112.41<br />
Dividend Yield Funds<br />
Birla SL Dividend Yield Plus(G) 90.9900 13831.15 15.26 1831.15 3573.81 61573.68 71.04 25573.68 13205.95 112995.38 88.33 52995.38 82841.44<br />
BNP Paribas Dividend Yield Fund(G) 18.8060 13441.07 12.01 1441.07 2507.07 55811.16 55.03 19811.16 5013.87 96737.80 61.23 36737.80 42049.38<br />
ING Dividend Yield(G) 24.7200 13644.76 13.71 1644.76 3243.58 61220.63 70.06 25220.63 10568.29 112615.22 87.69 52615.22 82341.65<br />
Principal Dividend Yield(G) 25.6900 13865.94 15.55 1865.94 3052.73 54780.27 52.17 18780.27 -55.97 92821.46 54.70 32821.46 41274.64<br />
Tata Dividend Yield(G) 34.5604 13648.75 13.74 1648.75 3374.07 57815.56 60.60 21815.56 4997.59 105041.73 75.07 45041.73 77215.23<br />
UTI Dividend Yield(G) 33.9100 13601.68 13.35 1601.68 2653.22 56631.68 57.31 20631.68 9432.08 108261.24 80.44 48261.24 95788.67<br />
Call us on : 1800 425 8282<br />
8


