Highland Park Dam Mitigation Project Appendix C - Partners for ...
Highland Park Dam Mitigation Project Appendix C - Partners for ...
Highland Park Dam Mitigation Project Appendix C - Partners for ...

Create successful ePaper yourself
Turn your PDF publications into a flip-book with our unique Google optimized e-Paper software.
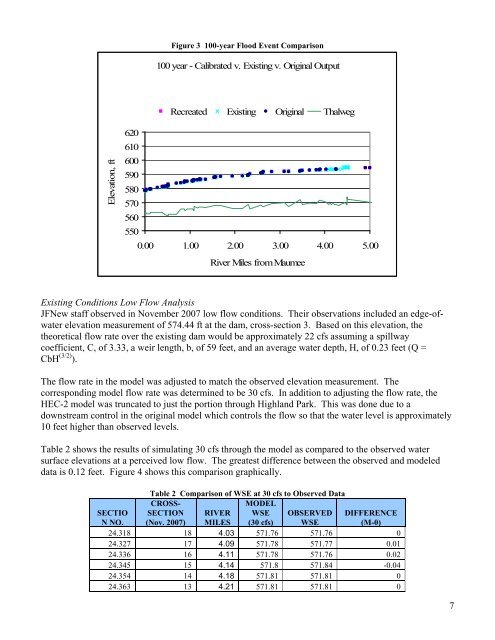
Figure 3 100-year Flood Event Comparison<br />
100 year - Calibrated v. Existing v. Original Output<br />
Recreated Existing Original Thalweg<br />
Elevation, ft<br />
620<br />
610<br />
600<br />
590<br />
580<br />
570<br />
560<br />
550<br />
0.00 1.00 2.00 3.00 4.00 5.00<br />
River Miles from Maumee<br />
Existing Conditions Low Flow Analysis<br />
JFNew staff observed in November 2007 low flow conditions. Their observations included an edge-ofwater<br />
elevation measurement of 574.44 ft at the dam, cross-section 3. Based on this elevation, the<br />
theoretical flow rate over the existing dam would be approximately 22 cfs assuming a spillway<br />
coefficient, C, of 3.33, a weir length, b, of 59 feet, and an average water depth, H, of 0.23 feet (Q =<br />
CbH (3/2) ).<br />
The flow rate in the model was adjusted to match the observed elevation measurement. The<br />
corresponding model flow rate was determined to be 30 cfs. In addition to adjusting the flow rate, the<br />
HEC-2 model was truncated to just the portion through <strong>Highland</strong> <strong>Park</strong>. This was done due to a<br />
downstream control in the original model which controls the flow so that the water level is approximately<br />
10 feet higher than observed levels.<br />
Table 2 shows the results of simulating 30 cfs through the model as compared to the observed water<br />
surface elevations at a perceived low flow. The greatest difference between the observed and modeled<br />
data is 0.12 feet. Figure 4 shows this comparison graphically.<br />
SECTIO<br />
N NO.<br />
Table 2 Comparison of WSE at 30 cfs to Observed Data<br />
CROSS-<br />
MODEL<br />
SECTION RIVER WSE OBSERVED DIFFERENCE<br />
(Nov. 2007) MILES (30 cfs) WSE<br />
(M-0)<br />
24.318 18 4.03 571.76 571.76 0<br />
24.327 17 4.09 571.78 571.77 0.01<br />
24.336 16 4.11 571.78 571.76 0.02<br />
24.345 15 4.14 571.8 571.84 -0.04<br />
24.354 14 4.18 571.81 571.81 0<br />
24.363 13 4.21 571.81 571.81 0<br />
7