A HEAD-AND-FACE ANTHROPOMETRIC SURVEY - The National ...
A HEAD-AND-FACE ANTHROPOMETRIC SURVEY - The National ...
A HEAD-AND-FACE ANTHROPOMETRIC SURVEY - The National ...

You also want an ePaper? Increase the reach of your titles
YUMPU automatically turns print PDFs into web optimized ePapers that Google loves.
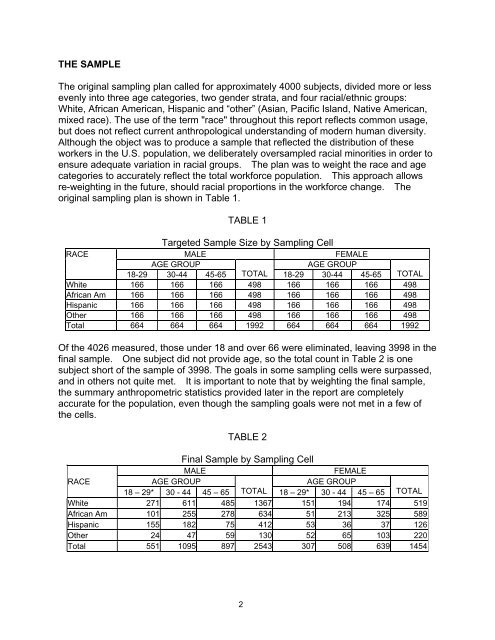
THE SAMPLE<br />
<strong>The</strong> original sampling plan called for approximately 4000 subjects, divided more or less<br />
evenly into three age categories, two gender strata, and four racial/ethnic groups:<br />
White, African American, Hispanic and “other” (Asian, Pacific Island, Native American,<br />
mixed race). <strong>The</strong> use of the term "race" throughout this report reflects common usage,<br />
but does not reflect current anthropological understanding of modern human diversity.<br />
Although the object was to produce a sample that reflected the distribution of these<br />
workers in the U.S. population, we deliberately oversampled racial minorities in order to<br />
ensure adequate variation in racial groups. <strong>The</strong> plan was to weight the race and age<br />
categories to accurately reflect the total workforce population. This approach allows<br />
re-weighting in the future, should racial proportions in the workforce change. <strong>The</strong><br />
original sampling plan is shown in Table 1.<br />
TABLE 1<br />
Targeted Sample Size by Sampling Cell<br />
RACE MALE FEMALE<br />
AGE GROUP<br />
AGE GROUP<br />
18-29 30-44 45-65 TOTAL 18-29 30-44 45-65 TOTAL<br />
White 166 166 166 498 166 166 166 498<br />
African Am 166 166 166 498 166 166 166 498<br />
Hispanic 166 166 166 498 166 166 166 498<br />
Other 166 166 166 498 166 166 166 498<br />
Total 664 664 664 1992 664 664 664 1992<br />
Of the 4026 measured, those under 18 and over 66 were eliminated, leaving 3998 in the<br />
final sample. One subject did not provide age, so the total count in Table 2 is one<br />
subject short of the sample of 3998. <strong>The</strong> goals in some sampling cells were surpassed,<br />
and in others not quite met. It is important to note that by weighting the final sample,<br />
the summary anthropometric statistics provided later in the report are completely<br />
accurate for the population, even though the sampling goals were not met in a few of<br />
the cells.<br />
TABLE 2<br />
Final Sample by Sampling Cell<br />
MALE<br />
FEMALE<br />
RACE<br />
AGE GROUP<br />
AGE GROUP<br />
18 – 29* 30 - 44 45 – 65 TOTAL 18 – 29* 30 - 44 45 – 65 TOTAL<br />
White 271 611 485 1367 151 194 174 519<br />
African Am 101 255 278 634 51 213 325 589<br />
Hispanic 155 182 75 412 53 36 37 126<br />
Other 24 47 59 130 52 65 103 220<br />
Total 551 1095 897 2543 307 508 639 1454<br />
2